Publisher’s version / Version de l'éditeur:
Marine Biotechnology, 13, 4, pp. 733-750, 2011-08-01
READ THESE TERMS AND CONDITIONS CAREFULLY BEFORE USING THIS WEBSITE.
https://nrc-publications.canada.ca/eng/copyright
Vous avez des questions? Nous pouvons vous aider. Pour communiquer directement avec un auteur, consultez la
première page de la revue dans laquelle son article a été publié afin de trouver ses coordonnées. Si vous n’arrivez pas à les repérer, communiquez avec nous à PublicationsArchive-ArchivesPublications@nrc-cnrc.gc.ca.
Questions? Contact the NRC Publications Archive team at
PublicationsArchive-ArchivesPublications@nrc-cnrc.gc.ca. If you wish to email the authors directly, please see the first page of the publication for their contact information.
NRC Publications Archive
Archives des publications du CNRC
This publication could be one of several versions: author’s original, accepted manuscript or the publisher’s version. / La version de cette publication peut être l’une des suivantes : la version prépublication de l’auteur, la version acceptée du manuscrit ou la version de l’éditeur.
For the publisher’s version, please access the DOI link below./ Pour consulter la version de l’éditeur, utilisez le lien DOI ci-dessous.
https://doi.org/10.1007/s10126-010-9335-6
Access and use of this website and the material on it are subject to the Terms and Conditions set forth at
Development and experimental validation of a 20K Atlantic cod (Gadus
morhua) oligonucleotide microarray based on a collection of over
150,000 ESTs
Booman, Marije; Borza, Tudor; Feng, Charles Y.; Hori, Tiago S.; Higgins,
Brent; Culf, Adrian; Léger, Daniel; Chute, Ian C.; Belkaid, Anissa; Rise,
Marlies; Gamperl, A. Kurt; Hubert, Sophie; Kimball, Jennifer; Ouellette,
Rodney J.; Johnson, Stewart C.; Bowman, Sharen; Rise, Matthew L.
https://publications-cnrc.canada.ca/fra/droits
L’accès à ce site Web et l’utilisation de son contenu sont assujettis aux conditions présentées dans le site LISEZ CES CONDITIONS ATTENTIVEMENT AVANT D’UTILISER CE SITE WEB.
NRC Publications Record / Notice d'Archives des publications de CNRC:
https://nrc-publications.canada.ca/eng/view/object/?id=3f96cd1a-286b-402c-8b3a-e7abd2b8e180 https://publications-cnrc.canada.ca/fra/voir/objet/?id=3f96cd1a-286b-402c-8b3a-e7abd2b8e180
ORIGINAL ARTICLE
Development and Experimental Validation of a 20K Atlantic
Cod (Gadus morhua) Oligonucleotide Microarray Based
on a Collection of over 150,000 ESTs
Marije Booman&Tudor Borza&Charles Y. Feng&Tiago S. Hori&Brent Higgins&
Adrian Culf&Daniel Léger&Ian C. Chute&Anissa Belkaid&Marlies Rise&
A. Kurt Gamperl&Sophie Hubert&Jennifer Kimball&Rodney J. Ouellette&
Stewart C. Johnson&Sharen Bowman&Matthew L. Rise
Received: 27 August 2010 / Accepted: 5 November 2010 / Published online: 3 December 2010 # The Author(s) 2010. This article is published with open access at Springerlink.com.
Abstract The collapse of Atlantic cod (Gadus morhua) wild populations strongly impacted the Atlantic cod fishery and led to the development of cod aquaculture. In order to improve aquaculture and broodstock quality, we need to gain knowledge of genes and pathways involved in Atlantic cod responses to pathogens and other stressors. The Atlantic Cod Genomics and Broodstock Development Project has generated over 150,000 expressed sequence tags from 42 cDNA libraries representing various tissues, developmental stages, and stimuli. We used this resource to develop an Atlantic cod oligonucleotide microarray con-taining 20,000 unique probes. Selection of sequences from the full range of cDNA libraries enables application of the microarray for a broad spectrum of Atlantic cod functional genomics studies. We included sequences that were highly abundant in suppression subtractive hybridization (SSH) libraries, which were enriched for transcripts responsive to
pathogens or other stressors. These sequences represent genes that potentially play an important role in stress and/or immune responses, making the microarray particularly useful for studies of Atlantic cod gene expression responses to immune stimuli and other stressors. To demonstrate its value, we used the microarray to analyze the Atlantic cod spleen response to stimulation with formalin-killed, atypical Aeromonas salmonicida, resulting in a gene expression profile that indicates a strong innate immune response. These results were further validated by quantitative PCR analysis and comparison to results from previous analysis of an SSH library. This study shows that the Atlantic cod 20K oligonucleotide microarray is a valuable new tool for Atlantic cod functional genomics research.
Keywords Atlantic cod . Aquaculture . Microarray . Gene expression profiling
Electronic supplementary material The online version of this article (doi:10.1007/s10126-010-9335-6) contains supplementary material, which is available to authorized users.
M. Booman
:
C. Y. Feng:
T. S. Hori:
M. Rise:
A. K. Gamperl:
M. L. Rise
Ocean Sciences Centre, Memorial University of Newfoundland, 1 Marine Lab Road,
St. John’s, NL, Canada A1C 5S7
T. Borza
:
B. Higgins:
M. Rise:
S. Hubert:
S. BowmanGenome Atlantic, 1721 Lower Water Street, Halifax, NS, Canada B3J 1S5
A. Culf
:
D. Léger:
I. C. Chute:
A. Belkaid:
R. J. OuelletteAtlantic Microarray Facility, Atlantic Cancer Research Institute,
35 Providence Street,
Moncton, NB, Canada E1C 8X3
J. Kimball
NRC Institute for Marine Biosciences, 1411 Oxford Street,
Halifax, NS, Canada B3H 3Z1 S. C. Johnson
Pacific Biological Station, Fisheries and Oceans Canada, Nanaimo, BC, Canada V9T 6N7
M. L. Rise (*)
Canada Research Chair (Tier 2) in Marine Biotechnology, Ocean Sciences Centre,
Memorial University of Newfoundland, 1 Marine Lab Road,
St. John’s, NL, Canada A1C 5S7 e-mail: mrise@mun.ca
Introduction
The collapse of wild populations of Atlantic cod (Gadus morhua) has had a large impact on the cod fishery, which has historically been an important industry in several countries including Canada and Norway. To allow wild cod stocks to recover while still satisfying consumer demands, Atlantic cod aquaculture is an important alterna-tive to wild fishery. However, attempts at commercial-scale cod aquaculture have not been fully successful and are hampered by slow growth, early maturation (Hansen et al.
2001), infectious diseases (Samuelsen et al. 2006), and stress associated with handling (Brown et al. 2003) and with fluctuating temperatures in sea cages (Gollock et al.
2006). In order to solve these problems, we need to learn more about cod biology, especially the response to stress and pathogens as the high-density of fish populations in aquaculture makes them more prone to exposure to these factors.
Atlantic cod has a peculiar immune system compared to other teleosts (reviewed in Pilstrom et al.2005; Samuelsen et al. 2006; Solem and Stenvik 2006). Specific antibody responses to pathogens are weak or absent, although Atlantic cod does respond to vaccination (Gudmundsdóttir et al. 2009; Lund et al. 2006, 2007). Atlantic cod has a relatively high level of natural antibodies with a broad specificity and an affinity at least comparable to that of acquired antibodies, which might play an important role in the immune response (Magnadottir et al.2009). Compared to other teleost species, Atlantic cod express an exception-ally high number of MH class I genes (Miller et al.2002; Persson et al.1999). However, despite significant efforts, MH class II sequences have not yet been identified in Atlantic cod. Further studies of the genes, proteins, cells, and molecular pathways involved in Atlantic cod immune responses will greatly benefit from large-scale genomics projects that are currently being conducted on this species. By understanding the genes and pathways involved in Atlantic cod responses to pathogens and other stressors, we will gain valuable knowledge to use in the management of Atlantic cod aquaculture and to improve broodstock quality. The Atlantic Cod Genomics and Broodstock Development Project (CGP, www.codgene.ca) aims to provide genomic tools that can be used to increase our understanding of cod biology and to identify molecular markers for the selection of broodstock with favorable commercial phenotypes (such as rapid growth characteristics and resistance to stress and disease). These tools will also be useful in the development of new vaccines and therapeutics against the pathogens that threaten Atlantic cod aquaculture. As part of the CGP, we have previously used suppression subtractive hybridization (SSH) cDNA library construction, and sequencing and quantitative reverse transcription–polymerase chain reaction
(QPCR) analysis of SSH-identified transcripts, to study gene expression responses of Atlantic cod to different stimuli such as heat stress (Hori et al.2010; Pérez-Casanova et al.2008), subclinical high nodavirus carrier state (Rise et al. 2008,
2010), and intraperitoneal (IP) injection of viral mimic polyriboinosinic polyribocytidylic acid [poly(I:C)] (Rise et al. 2008,2010) or formalin-killed, atypical Aeromonas salmonicida (Feng et al. 2009). In total, the CGP created 42 SSH and normalized cDNA libraries and generated over 150,000 expressed sequence tags (ESTs; Bowman et al.2010).
Aquaculture-relevant genomics research has benefitted greatly from the development of microarray platforms for a variety of teleost species (reviewed in Rise et al.2009). For Atlantic cod, only two microarray platforms have been published to date. The small-scale CodStress microarray contains 746 ESTs (Lie et al.2009) that were selected from four cDNA libraries constructed from tissues of Atlantic cod that were exposed to toxicants, and this microarray was designed for use as a diagnostic tool in ecotoxicology studies. The IMR 16K cDNA microarray (Edvardsen et al.
2010) contains 16,384 sequences that were selected from a relatively small set of ~44,000 ESTs from 20 un-normalized cDNA libraries.
Here, we describe the development of a large-scale microarray platform, the Atlantic cod oligonucleotide microarray containing 20,000 elements (20K), based on the EST resources that were generated by the CGP containing over 150,000 ESTs from 42 cDNA libraries, representing multiple tissues, developmental stages, and stimuli (Bowman et al.2010). To test the newly developed microarray platform, we used it in a study of the spleen transcriptome response to IP injection with formalin-killed, atypical A. salmonicida using the same samples as were previously used in our SSH study (Feng et al. 2009). Results from the current microarray study were validated by QPCR assays, by comparing them to results from the SSH study (Feng et al. 2009), and by functional analysis of the resulting informative gene list. This study shows that the Atlantic cod 20K oligonucleotide microarray is a valuable new tool for Atlantic cod functional genomics research.
Materials and Methods
EST Clustering and the Selection of Representative Sequences for Microarray Probe Design
The CGP has generated a database of 158,877 Atlantic cod ESTs from 23 normalized cDNA libraries and 19 SSH cDNA libraries, representing a variety of tissue types, developmental stages, and stimuli (Bowman et al. 2010). The SSH libraries were constructed using tissues from fish
stimulated with IP-injected formalin-killed, atypical A. salmonicida (Feng et al. 2009), IP-injected viral mimic poly(I:C) (Rise et al.2008,2010), or heat stress (Hori et al.
2010). The “All Version 2.0” sequence set consists of all ESTs from the CGP database that passed screening criteria of Paracel Transcript Assembler (PTA; Paracel Inc., Pasadena, CA), and this set of 154,142 ESTs was clustered and assembled using PTA as described by Bowman et al. (2010). Our use of the terms “cluster,” “contig,” “cluster-singleton,” and “singleton” is based on the PTA procedure. During the clustering process, PTA starts by placing each EST in its own unique cluster. Then, a pairwise comparison is performed between each EST and all other ESTs to determine which pairs of sequences are similar. PTA then considers all pairwise comparison hits (i.e., sequences that were found to be similar) and merges the two sequences that generated the hit into one cluster. PTA then continues by iterating through the pairwise comparison hits, each time merging the two clusters that contain the two sequences that generated a hit. By the end of this clustering process, some clusters will contain multiple ESTs, while others will only contain one EST. These latter sequences are no longer called “clusters” but are defined as “singletons,” i.e., ESTs that did not show sequence similarity to any other ESTs. For the subsequent assembly procedure, each cluster is processed separately and PTA assembles the ESTs within each cluster into one or more contiguous sequences (contigs). During this process, it might not be able to assemble all ESTs from a cluster into a contig. The single ESTs that were clustered (i.e., showed sequence similarity to other ESTs) but are not part of a contig are defined as “cluster-singletons.” “Clusters” are thus defined as groups of ESTs that show sequence similarity and that can form one or multiple contigs, or remain as “cluster-singletons.”
Clustering and assembly of the 154,142 ESTs resulted in 51,814 putative transcripts corresponding to 23,838 contigs and 27,976 singletons (Bowman et al. 2010). From this collection of 51,814 putative transcripts, a selection was made of candidate sequences for probe design.
To reduce redundancy, multiple contigs from the same cluster were only selected if they showed <60% identity over their entire length, and cluster-singletons within contig-containing clusters were discarded. For those clus-ters containing only singletons, the longest cluster-singleton within the cluster was selected. This screening step allowed for the selection of one or a few representative contigs or cluster-singletons from each cluster and, along with non-clustered singletons, produced a total number of 39,247 unique candidate sequences. For this microarray, oligonucleotide probes would be designed in sense (5′–3′) orientation, which requires that the orientation of selected sequences is known. For sequences from normalized libraries, which were generated using directional cloning
(Bowman et al. 2010), the orientation could be inferred; however, for sequences from SSH libraries, which were generated using non-directional TA cloning (Feng et al.
2009; Hori et al.2010; Rise et al.2008,2010), this was not possible since the orientation of inserts was unknown. In order to design probes with a proper 5′–3′ orientation, the orientation of all candidate sequences was checked in two steps. In the first step, a BLASTX search was performed against GenBank database release 165.0; all sequences having significant BLASTX hits (E value <10−5) in the
opposite orientation were reversed and complemented. In the second step, sequences lacking significant BLASTX hits were reversed and complemented, when necessary, based on directional cloning information. Candidate sequences were thus divided into two categories: 34,355 “known orientation” candidate sequences with known or inferred orientation (determined by BLASTX alignment and/or directional cloning information) and 4,892 “un-known orientation” candidate sequences (i.e., sequences originating from SSH libraries without significant BLAST hits). Based on homology search in UniRef90 (UniProt), nr (NCBI), Kyoto Encyclopedia of Genes and Genomes, Clusters of Orthologous Groups, Protein Families, Large Subunit Ribosomal RNA, and Small Subunit Ribosomal RNA databases using AutoFACT (Koski et al. 2005), the category of 34,355 “known orientation” candidate sequences was split further into three groups: 11,152 “annotated” sequences showing significant homology (bit score >40) to sequences with functional annotation; 2,861 “unassigned” sequences showing significant homology to sequences with non-informative annotation, i.e., to sequences corresponding to proteins with unknown function; and 20,342 “unclassi-fied” sequences showing no significant homology to any sequences in these databases. A schematic representation of the complete selection process is given in Fig.1.
In addition to the four sequence categories described above (“annotated,” “unassigned,” “unclassified,” and “unknown orientation”), a fifth category of 58 “custom” sequences was chosen based on gene function. These sequences originated from CGP and included hemoglobin genes (Borza et al. 2009), CC chemokines (Borza et al.
2010), and genes involved in immune-relevant signaling pathways such as the RIG-I-like receptor signaling pathway, Toll-like receptor signaling, and interferon stimulation.
Oligonucleotide Probe Design
The design of 50-mer oligonucleotide probes was performed separately on each of the five sequence categories using ArrayDesigner version 4.2 (Premier Biosoft International, Palo Alto, CA) with the following relevant parameters: melting temperature, 72 ± 5°C;
length, 50 nucleotides; position from the 3′ end: anywhere (for “annotated,” “unassigned,” and “custom” sequences) or 500 (for “unclassified” and “non-directed” sequences); hairpin dG, −6.0; dimer dG, −8.0; run/repeat, 5 max; word size, 15; BLASTN-DUST filtering: on; avoid homology: checked. Using these parameters, good probes could be designed for 25,695 “known orientation” and 2,695 “unknown orientation” sequences (Electronic Supplementary Material (ESM) Fig. S1). However, more than 60% of the “known orientation” sequences were represented by “unclassified” sequences, i.e., by sequen-ces for which the homology search failed to reveal any relevant hits in databases. In order to maximize the number of probes designed from “annotated” and “unas-signed” sequences, a second pass of probe design was carried out with sequences from these two categories that were rejected in the first pass; in this second pass, homology was allowed to occur among probes. The second pass produced good probes for 1,956 “annotated” and “unassigned” sequences. Probes from both design steps were checked by reciprocal BLASTN search to remove highly homologous probes. All probes were also checked for the presence of simple sequence repeats using Tandem Repeat Finder (Benson1999) and two online versions of Repeat Masker (http://lucy.ceh.uvic.ca/repeatmasker/ cbr_repeatmasker.py; http://www.repeatmasker.org/cgi-bin/ WEBRepeatMasker); the probes identified as having repeated sequences or harboring low complexity regions were replaced with non-repetitive probes designed from the same transcript where possible. Finally, all probes having homologues in databases were checked for correct 5′ to 3′ orientation by running BLAST searches against GenBank database release 168.0 for confirmation purposes.
For the “annotated,” “unassigned,” and “custom” sequences, the selection process was now complete, resulting in 10,318 probes from the “annotated” sequences, 2,625 from the “unassigned” sequences, and 202 from the “custom” sequences. For the “unclassified” sequences, an additional selection step followed based on the number of ESTs contributing to each contig sequence, resulting in 6,397 probes from the “unclassified” sequences (5,953 with three or more ESTs per contig, 444 with two ESTs per contig). For the “unknown orientation” sequences, an additional selection step followed based on the abundance in SSH libraries and predicted roles in the immune and stress responses, resulting in 458 probes (one sense and one antisense for each of 229 selected sequences) from the “unknown orientation” sequences. Only one probe per candidate sequence was included for all categories of sequences, except for the “custom” sequences where two or more probes per candidate sequence were included. The total number of designed oligonucleotide probes was 20,000.
Oligonucleotide Synthesis and Microarray Production
Oligonucleotide probes were synthesized by the phosphor-amidite method at a 1-nmol scale and desalted (Integrated DNA Technologies, Coralville, IA). Isolated DNA was analyzed by matrix-assisted laser desorption/ionization– time of flight mass spectrometry. DNA of low quality was resynthesized. In addition to the 20,000 specific probes described above, the following positive and negative control features were included: cod actin oligo (192 spots), human actin oligo (192 spots), SpotReport Alien Oligos (nos. 4, 6, 7, and 8; Stratagene, La Jolla, CA; 96 spots
Fig. 1 Sequence selection and probe design. Flowchart of the procedure of selection of representative candidate sequences and probe design. In this flowchart, arrowheads indicate a reduction in the number of sequences. The gray bar indicates the probe design process. Asterisks indicate an additional probe selection procedure
based on the number of ESTs contributing to each contig sequence (for probes from “unclassified” sequences) or on the abundance in SSH libraries and predicted roles in immune and stress responses (for probes from “unknown orientation” sequences). For more details on the probe design process, see “Materials and Methods” and ESM Fig. S1
each), and buffer-only spots (704 spots). Probes were resuspended in sodium phosphate buffer (Schott-Nexterion Spot; Schott, Louisville, KY), to a final concentration of 30 μM, in Genetix X7020 384-well plates (Genetics, Boston, MA) using a Janus liquid-handling robot (PerkinElmer, Waltham, MA) and spotted in duplicate on epoxy microarray slides (Schott-Nexterion Slide E) using an OmniGrid 100 microarrayer (Genomic Solutions, Ann Arbor, MI) equipped with SMT-S50 silicon print pins (Parallel Synthesis Technol-ogies, Santa Clara, CA). The microarray contains 41,472 features (i.e., 20,000 specific probes spotted in duplicate and 1,472 control spots) spotted in 48 blocks of 29 rows and 30 columns each (the last row of each block contains only 24 features). Microarrays were produced at the Atlantic Micro-array Facility of the Atlantic Cancer Research Institute (ACRI, Moncton, NB).
Two microarrays of each print batch were analyzed by salt reflection scan and by hybridization with Cy3 SpotQC Detector Oligo (Integrated DNA Technologies) and subse-quent scanning on an Axon GenePix 4200AL scanner (Molecular Devices, Sunnyvale, CA) for any defects that may have occurred in spotting. Before use, microarrays were stored at room temperature in vacuum-sealed microarray pouches (Corning, Corning, NY).
The microarray platform is available in the NCBI Gene Expression Omnibus (GEO) under accession no. GPL10532. The annotation file for the probes on the microarray is available as ESM Table S1.
Bacterial Antigen Stimulation and Tissue Sample Collection
The spleen tissue samples used for the microarray study were part of a larger study on Atlantic cod immune response to bacterial antigens, and study setup, bacterial antigen preparation, bacterial antigen stimulation, and tissue collection have been described previously (Feng et al.
2009). In short, 150 juvenile, healthy-appearing Atlantic cod from a single family were divided over three tanks corresponding to three treatments. At the pre-injection time point (0 h), eight individuals were sampled from each tank, euthanized, and spleens and brains collected in RNAse-free 1.5-ml tubes and flash-frozen in liquid nitrogen and stored at −80°C until RNA extraction. The remaining individuals received one of three treatments: IP injection of 100 μl sterile phosphate-buffered saline (PBS; PBS group), IP injection of 100 μl formalin-killed, atypical A. salmonicida (referred to as Asal) in PBS (Asal group), or no handling at all (undisturbed control group). At 2, 6, 24, and 72 h post-injection (HPI) and 1 week post-post-injection, eight individuals were sampled from each tank, euthanized, and spleens and brains collected as described for the 0 h individuals. The current study used spleen tissues from PBS and Asal fish
from 0 h and 24 HPI time points for microarray and QPCR; spleen tissues from undisturbed control fish from all time points were used for the microarray common reference sample (ESM Fig. S2). Immune stimulation and sampling of the fish were carried out in accordance with an Animal Care Utilization Protocol issued by Memorial University of Newfoundland’s Animal Care Committee.
Nodavirus Testing
To determine if any individuals were asymptomatic carriers of nodavirus, an RT-PCR test was conducted. For each individual, 1 μg of DNAse-I-treated, column-purified total RNA from brain tissue was reverse-transcribed using the Moloney murine leukemia virus reverse transcriptase and random hexamers (Invitrogen, Burlington, ON) at 37°C for 50 min. PCR reactions contained 1 U of DyNAzyme EXT DNA polymerase (MJ Research, Waltham, MA), 1X DyNAzyme EXT Buffer, 0.2 mM dNTPs, 4 μl of 10x diluted cDNA (corresponding to 20 ng of input total RNA), and 0.2 μM each of nodavirus-specific primers AC2F1 GTGGTTACGTGGCTGGCTTC-3′) and AC2R4 (5′-GTTCTGCTTTCCCACCATTTG-3′). PCR cycling condi-tions consisted of 40 cycles of (94°C for 30 s, 61°C for 30 s, and 72°C for 10 s). For each of the 50 μl PCR reactions, 5.5 μl of 10X Blue juice (Invitrogen) was added, and 15 μl of this mixture was resolved on 1.5% agarose gels using a 100-bp ladder (Invitrogen) as a marker. Gels were photographed under UV light using G:BOX and GeneSnap software (Syngene, Frederick, MD), and the intensities of the bands from the PCR products were quantified as a measure of carrier state using GeneTools (Syngene). Mean pixel intensity back-ground levels, as measured in the lane where the “no template control” PCR product was loaded, were 5,456. Individuals with mean pixel intensities between 5,200 and 7,310 (no band or very low-intensity bands) were classified as “no/low nodavirus carrier” and individuals with pixel intensities above 11,130 (high-intensity, clearly visible bands) were classified as “high nodavirus carrier” as described previously (Rise et al. 2010; ESM Fig. S3).
RNA Extraction
Total RNA extraction was described in detail in Feng et al. (2009). Briefly, total RNA was extracted from spleen tissue samples from individual fish using TRIzol reagent (Invitro-gen) according to the manufacturer’s instructions. Total RNA was treated with DNAse I (RNAse-Free DNAse Set; Qiagen, Valencia, CA) and column-purified using the RNeasy MinElute Cleanup kit (Qiagen) according to the manufacturer’s instructions. Quality and quantity of isolated
total RNA samples were assessed by agarose gel electro-phoresis and NanoDrop spectrophotometry.
Microarray Hybridization
Spleen DNAse-treated and column-purified total RNA samples from six individual fish each from the PBS 0 h, PBS 24 HPI, Asal 0 h, and Asal 24 HPI groups were used for microarray analysis (ESM Fig. S3). Spleen DNAse-treated and column-purified total RNA samples from 31 “undisturbed control” fish from all time points were pooled (with each individual contributing an equal amount of RNA) and used as common reference. For each individual sample, 5 μg of total RNA was labeled with AlexaFluor 647 using the Invitrogen SuperScript Direct cDNA Labeling kit according to the manufacturer’s protocol (Invitrogen). For the pooled common reference, 5 μg of total RNA was labeled with AlexaFluor 555 using the same protocol. Formamide-based hybridization buffer (2x concentrated) and LNA dT blocker (Genisphere, Hatfield, PA) were added to purified, labeled cDNA, and on each microarray, an experimental sample was co-hybridized with the common reference using LifterSlips (Thermo Scientific, Waltham, MA). Hybridizations were performed overnight (~16 h) at 42°C. Detailed protocols for slide pre-hybridization, hybridization, and washing are described in ESM Methods S1.
Microarray Data Acquisition
Tiff images containing fluorescence data were obtained using a ScanArray Gx Plus scanner and ScanExpress v4.0 (Perkin Elmer), and signal intensity data were extracted using Imagene v7.5 (Biodiscovery, El Segundo, CA). Using R and Bioconductor package marray, control spots and flagged spots were removed and data were log2
-transformed and Loess-normalized per subgrid. Raw signal cutoff levels per microarray per channel were calculated as the average of the median background signal + 2 standard deviations, and data were thresholded by replacing normalized log ratios of spots with raw signal values below cutoff with “NA.” Normalized log ratios of flagged spots were also replaced with “NA.” Normalized log ratios from duplicate probes were aver-aged. The final normalized, thresholded, and averaged dataset contains 20,000 probes. Detailed protocols includ-ing the R scripts for these procedures are available in ESM Methods S2. This microarray dataset is described in GEO series GSE22312, and individual sample processed and raw data are available under GEO accession nos. GSM555358–GS555380.
Microarray Data Analysis
Before further data analysis, all probes that were absent in more than 25% of all microarrays were discarded from the dataset, leaving a final dataset of 15,429 probes. Two-class comparison analysis was performed using the Significance Analysis of Microarrays (SAM) algorithm (Tusher et al. 2001) as implemented in the Bioconductor package siggenes (Schwender et al. 2006). First, missing values were imputed using the EM_array method from the LSimpute package (Bø et al. 2004; Celton et al. 2010). After running SAM, a false discovery rate (FDR) cutoff of 0.01 was used to determine significant differentially expressed genes. An additional analysis was performed using a less stringent FDR cutoff of 0.05; results from this analysis are not discussed (they are available as ESM Table S2), but three genes were selected from this list for QPCR analysis (Table1). Detailed protocols including the R scripts for these procedures are available in ESM Methods S3. In Genesis (Sturn et al.2002), the data were clustered using Pearson uncentered correlation and com-plete linkage hierarchical clustering.
A final gene list of 82 probes responsive to Asal was manually annotated by comparing the full sequences that the probes were representing against the nr database from NCBI using BLASTX and by choosing the most significant (bit score >40, E value <10−4) hit with an informative description.
Gene Ontology (GO) annotation was added to the gene list by choosing the most significant (bit score >40) human or mouse hit with a reviewed UniProt entry. That UniProt accession number was used to query QuickGO for the associated GO Biological Process entries.
Quantitative RT-PCR Analysis
Fifteen genes were selected for QPCR analysis. For four genes (HAMP, CAMP, GmSCYA123, and IL8), primers were designed and tested and QPCR analysis was performed previously (Feng et al. 2009). Because the QPCR analysis for these four genes was previously performed on a different real-time instrument and using technical duplicates instead of technical triplicates, these four genes were reanalyzed in the current study using the real-time instrument and protocol described here. For the remaining 11 genes, QPCR primers were designed from the sequences that were used to design the microarray probes (Table 1) using the Primer 3 program (http://frodo.wi.mit. edu). Prior to QPCR analysis, a quality control procedure was performed for all newly designed primer pairs. They were first tested using a no reverse transcription control as template, for which none of the selected primer pairs
showed detectable amplification. Each primer pair was further tested using a five-point 5x dilution series of cDNA from pooled Asal 24 HPI samples as template. Primer pairs showed a single peak in the dissociation curve and had no amplification in no-template controls. Amplification effi-ciencies were determined and are listed in Table 1. Ribosomal RNA 18S was chosen as a normalizer gene, and its amplification efficiency and suitability as a normalizer has been determined previously (Rise et al.
2008). Seven fish each from the PBS 0 h, PBS 24 HPI, and Asal 0 h groups and eight fish from the Asal 24 HPI group were used in the QPCR study (ESM Fig. S3). For each
sample, 1 μg of column-purified, DNAse-treated total RNA was reverse-transcribed as described in Rise et al. (2008). PCR amplification was performed using Power SYBR Green chemistry and a 7500 Fast Real-Time PCR machine (Applied Biosystems, Foster City, CA) in a total reaction volume of 13 μl containing 1 μl of cDNA (corresponding to 10 ng of input total RNA), 50 nM each of forward and reverse primers, and 1x PowerSYBR mastermix (Applied Biosystems). The PCR program consisted of one cycle of 50°C for 2 min, one cycle of 95°C for 10 min, followed by 40 cycles of 95°C for 15 s and 60°C for 1 min, with data collection after each 60°C step. For each sample, the gene of
Table 1 QPCR primers
Gene Probe name Sequence 5′–3′ R2 Efficiency (%) Amplicon size (bp)
CAMPa all_v2.0.1631.C1 Forward ATTGCAATTTCACCCTGAGC 0.999 94 118
Reverse CCAGACCTGCTCCTTCTCAC
GmSCYA123a EX175275_probe3 Forward CTCAAACCTCTGCATCGTCA 0.997 96 188
Reverse CACGGAGAGGTAAGCAGCTC
HAMPa all_v2.0.796.C2 Forward CCACAGGCTCCTCTCAAGTC 0.988 89 146
Reverse CTGCAACTGCAATGCTGAAT
IL8a all_v2.0.37.C2 Forward CCAATCTGACGGCTCTCTGT 0.990 103 116
Reverse ATCGGCTCCCTACTGGTTCT
C1S sb_gmnlsfas_0002o02.t7 Forward TCACTGACCGTTGAGACTCG 0.999 100 134
Reverse CCATTGTTGGAGCCGTAGTT
CEBPB2 all_v2.0.3759.C1 Forward ACTCCGCAACCTGCTCTCT 0.995 99 183
Reverse GGTGATGGCTGTTTTCACCT
CTSL all_v2.0.8187.C1 Forward CTACGAGGCTGAGGATGGAC 0.999 99 109
Reverse GGCCTTCTGTAGGGCTTTCT
SDF1 all_v2.0.9962.C1 Forward GCGCAGACATGGATATGAAA 0.999 95 115
Reverse GAGCGGCAGTAGCATCTCTC
all_v2.0.2958.C1 all_v2.0.2958.C1 Forward CCCAAAAAGGTCTTTGGTCA 0.989 105 140
Reverse CTCCCCAAGCACATTTAACC
all_v2.0.6615.C2 all_v2.0.6615.C2 Forward ACGCTGGGAAAATGAATCAC 0.993 89 176
Reverse TGAAACCTTATTGCCGGTTC
BPI/LBP all_v2.0.992.C2 Forward TCGGATCCCTTAGCAACATC 0.998 100 134
Reverse GATTTGCAGCTGGGTGTTTT
IIGP_b all_v2.0.3462.C1 Forward ACGACACAATGAGTGCCAAG 0.999 97 126
Reverse TTCCTGCTCCACACTCTCCT
CYBB all_v2.0.1278.C1 Forward TTGTGTAGCGTGTCGTTGAA 0.995 94 131
Reverse GGAAACTGAAACGCAAAAGC
GmSCYA104 EX731124_probe1 Forward GATCCGAGGGTCACTGAATG 0.991 90 104
Reverse GCATTGACGCAGGGATAGTT
IIGP_a all_v2.0.13188.C1 Forward TACTGGTGTGGTGGAAACGA 0.998 96 106
Reverse TGAGAATGTGGTGGTTCCAA
18Sb Forward ATGGCCGTTCTTAGTTGGTG 0.990 109 180
Reverse GGACATTTAAGGGCGTCTCA
Genes in bold were shown to be Asal-responsive in SSH analysis (Feng et al.2009). Genes in italics were chosen from the less stringent (FDR cutoff 0.05) gene list (ESM Table S2)
a
Primers for these genes were designed and tested previously (Feng et al.2009) b
interest and the normalizer gene were run on the same plate in triplicate. ABI 7500 software v2.0 (Applied Biosystems) was used to automatically determine baseline and threshold settings, except for 18S and interferon-inducible GTPase_b for which the baseline was set manually. Threshold cycle (Ct) values were averaged over triplicates, and for each gene the relative quantity (RQ) values were calculated using the method described by Pfaffl (2001) using the individual with lowest RQ for that gene as calibrator to avoid RQ values lower than 1. When the standard deviation of triplicates was higher than 0.5, Dixon’s Q test (Rorabacher1991) was used to determine if there was an outlier within the triplicate (at a confidence level of 95%). If an outlier was detected, it was discarded and the average Ct was calculated using the remaining two Ct values. If no outlier was detected, all three Ct values were discarded. For one of the genes (interferon-inducible GTPase_b), Ct values could not be detected in all samples due to extremely low or absent transcript levels in some individuals. To enable statistical analysis of this gene, all samples without detectable Ct values were assigned a Ct value of 39.01, which corre-sponds to the highest detectable Ct value among the remaining samples for that gene.
Gene expression differences between treatments within each time point, and between time points within each treatment, were determined by t tests on RQ values using SYSTAT 12.0 with a p value cutoff of 0.05.
Results
Microarray Design
Sequences to be represented on the microarray were selected from the CGP EST sequence set All Version 2.0, which contains 154,142 ESTs that were assembled into 23,838 contigs and 27,976 singletons for a total of 51,814 putative transcripts (Bowman et al.2010; Fig.1). Since the number of assembled sequences was significantly higher than the 20,000 unique Atlantic cod probes that our microarray layout design was based on, a selection procedure was designed to reduce the number of sequences that exhibit high homology to each other, to maximize the number of sequences that have functional annotation, and to minimize the number of sequences for which homology search in public databases failed to reveal any significant hits (using AutoFACT with a bit score threshold of 40). These latter sequences, indicated as “unclassified” in Fig.1, underwent an additional highly stringent selection proce-dure based on the depth of the contig so that no “unclassified” singletons were included on the microarray. We also aimed to minimize the number of sequences with unknown orientation that show no significant homology to
any known sequences (as determined by BLASTX search using an E value threshold of 10−5). However, these
sequences all originated from SSH libraries that were enriched for transcripts responsive to pathogens or other stressors and so could potentially represent genes that play an important role in stress and/or immune responses. Therefore, we chose to include 229 of the most highly abundant sequences from this group and designed probes in both orientations for these sequences. No singletons were included on the microarray unless they had significant sequence homology with an annotated entry in a public database.
Because the majority of sequences (19,798 of 20,000) were selected from the complete CGP EST database, which is based on normalized and SSH cDNA libraries from a variety of tissues, developmental stages, and treatments (Bowman et al. 2010), the microarray provides good coverage of genes from many pathways including those involved in stress and immune responses. To ensure the usefulness of the microarray for specific research areas, 58 Atlantic cod sequences were manually selected to represent genes of special interest to CGP research. These include 9 hemoglobin genes, 18 CC chemokines, and 31 genes from three immune-relevant functional groups: interferon-stimulated genes, genes involved in Toll-like receptor signaling, and genes from the RIG-I-like receptor signaling pathway.
Microarray-Based Gene Expression Analysis
Global gene expression profiles were analyzed using spleen RNA samples from four treatment groups: PBS pre-injection (PBS 0 h), PBS 24 h post-pre-injection (PBS 24 HPI), formalin-killed, atypical A. salmonicida pre-injection (Asal 0 h), and formalin-killed, atypical A. salmonicida 24 h post-injection (Asal 24 HPI; ESM Fig. S2). Fish from the PBS groups and Asal groups were kept in separate tanks. For each treatment group, spleen RNA samples from six fish were analyzed, except from the PBS 0 h group where one of the six samples failed due to consistent low signal intensities on the microarray. RT-PCR with brain RNA templates and nodavirus-specific primers showed that some fish involved in this study were asymptomatic carriers of nodavirus (ESM Fig. S3). Com-parison of global gene expression profiles of asymptomatic nodavirus “high carrier” and “no/low carrier” pre-injection (0 h) spleen samples using SAM, with an FDR cutoff of 0.05, showed no significant differences in gene expression (data not shown).
To determine which transcripts were responsive to Asal, we compared the Asal 24 HPI group to both the Asal 0 h group and the PBS 24 HPI group using SAM with an FDR cutoff of 0.01. Only the genes found to be
responsive in both comparisons were included in the final gene list (Fig.2). This highly stringent analysis was employed to minimize false positives in the final informa-tive gene list.
When comparing the Asal 0 h and Asal 24 HPI groups, there were 104 differentially expressed probes, all upregulated in response to Asal (Fig. 2 and ESM Table S3). Since the fish in the pre-injection group (Asal 0 h) were never handled during the experiment, this list of 104 probes represents genes responding to stimulation with Asal as well as handling, anesthesia, and injection stress. We sought to identify genes responding only to handling and injection stress by comparing PBS 0 h and PBS 24 HPI groups, but no significant differences were found. In conclusion, all 104 probes were responsive to stimulation with Asal when comparing Asal 0 h and Asal 24 HPI groups.
When comparing the two post-injection groups, PBS 24 HPI and Asal 24 HPI, we identified 1,313 differentially expressed probes, of which 1,012 were upregulated and 301 were downregulated in response to Asal (Fig.2 and ESM Table S4). Since the “PBS fish” and “Asal fish” were held in two separate tanks, this list of 1,313 probes represents genes responding to stimulation with Asal and/or differ-ences between tanks. The genes that were associated with differences between tanks were determined by comparing the two pre-injection groups PBS 0 h and Asal 0 h, resulting in 31 informative probes, of which 12 were also present in the list of 1,313 probes from the PBS 24 HPI and Asal 24 HPI comparison (Fig.2and ESM Table S4). These 12 probes that were associated with tank differences were removed from the list of 1,313 probes. In conclusion, 1,301 probes were responsive to stimulation with Asal when
comparing PBS 24 HPI and Asal 24 HPI groups (indicated in bold type in ESM Table S4).
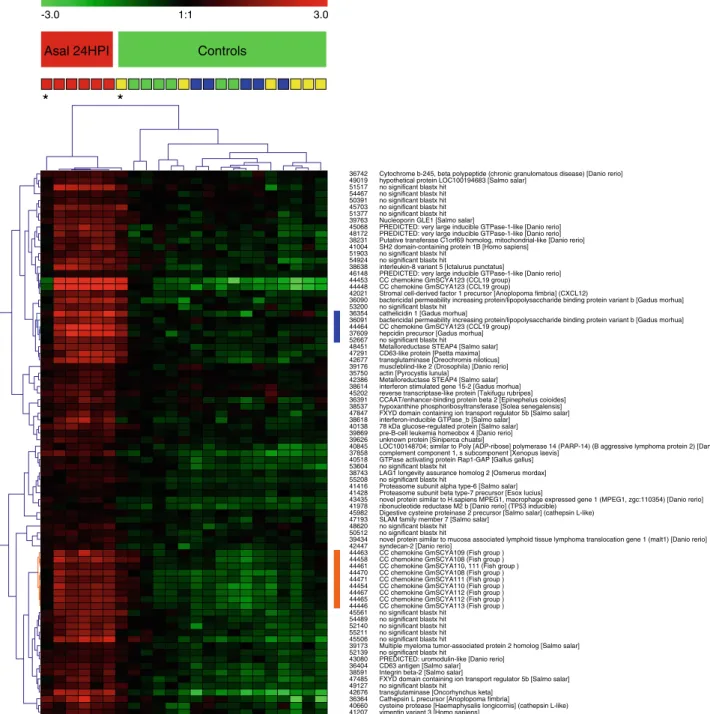
The final list consisted of 82 probes that were all significantly upregulated in response to Asal in both comparisons (Asal 0 h with Asal 24 HPI and PBS 24 HPI with Asal 24 HPI, i.e., present in both lists of 104 and 1,301 probes; Fig. 2). This final list is available as ESM Table S5. The samples and probes were clustered according to the expression of these 82 probes using a hierarchical clustering algorithm (Fig. 3). Clustering shows a clear general distinction between the Asal 24 HPI samples and the control samples (Asal 0 h, PBS 0 h, and PBS 24 HPI), with the exception of one control sample from the PBS 24HPI group that clusters together with the Asal 24 HPI group. Within the Asal 24 HPI group, the leftmost sample clusters away from the other samples in this group and shows a weaker upregulation of gene expression. The list of 82 Asal-responsive probes was manually annotated with gene names and GO Biological Process entries using BLASTX (E value <10−5, bit score >40) and QuickGo
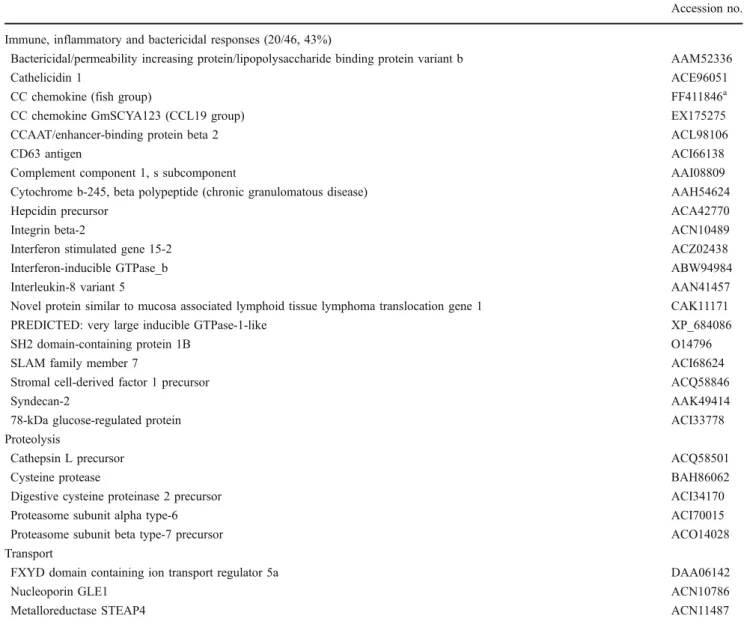
(ESM Table S5A). There is some redundancy in annotation of the list and the 82 probes represent 71 unique genes, of which 51 had a gene name annotation (ESM Table S5B). The other 20 were “unclassified” (i.e., had no significant homology with any sequence in the NCBI nr database). Twenty-seven genes were associated with one or more Biological Process GO entries. The GO entries that were most common (i.e., represented by three or more genes) were “proteolysis,” “transport,” “immune response,” and “oxidation reduction” (ESM Table S6). Because the number of genes with GO annotation was low, a second functional classification was made based on information from literature, GO annotation, UniProt, and Entrez Gene databases. If no functional information specific for cod or other teleosts was available, information for putative human or mouse orthologs was used. The most abundant categories were “immune, inflammatory and bactericidal response,” “proteolysis,” and “transport.” These categories and the genes associated with them are listed in Table2.
QPCR Analysis
To confirm the results of the microarray, 12 genes from the 71 unique genes responsive to Asal were chosen for QPCR analysis (Table 1): cathelicidin (CAMP), CC chemokine “CCL19 group” GmSCYA123, hepcidin (HAMP), comple-ment component 1, s subcomponent (C1S), CCAAT/ enhancer-binding protein beta 2 (CEBPB2), cathepsin L (CTSL), stromal cell-derived factor 1 precursor (SDF1), unclassified gene all_v2.0.2958.C1, unclassified gene all_v2.0.6615.C2, bactericidal permeability increasing pro-tein/lipopolysaccharide binding protein variant b (BPI/ LBP), interferon-inducible GTPase_b (IIGP_b), and
cyto-Fig. 2 Overview of informative probe lists and their intersections. This figure shows how the final list of 82 probes responsive to Asal was constructed (gray area). The 12 probes that were responsive to variability between tanks (from the comparison of PBS 0 h and Asal 0 h, left) were removed from the list of probes resulting from the comparison of PBS 24 HPI with Asal 24 HPI (middle) so that only probes responsive to Asal remained. Then, the final probe list was constructed by taking only the 82 probes that were responsive to Asal in both the comparisons of Asal 0 h with Asal 24 HPI (right) and of PBS 24 HPI with Asal 24 HPI (middle)
chrome b-245 beta polypeptide (CYBB). Three genes that were Asal-responsive in a less stringent analysis (using an FDR cutoff of 0.05 instead of 0.01; ESM Table S2), interleukin 8 (IL8), CC chemokine “fish group” GmSCYA104, and interferon-inducible GTPase_a (IIGP_a), were added to provide further validation of the microarray results. This makes a total of 15
microarray-identified genes that were subjected to QPCR. Thirteen of those were chosen based on their functional annotation suggesting a role in the immune or defense response; the remaining two were selected from the “unclassified” genes (all_v2.0.2958.C1 and all_v2.0.6615.C2). Eight of the 15 genes we selected that were identified by microarray as Asal-responsive were also identified as Asal-responsive in
Asal 24HPI Controls
*
*
36742 49019 51517 54467 50391 45703 51377 39763 45068 48172 38231 41004 51903 54924 38638 46148 44453 44448 42021 36090 53200 36354 36091 44464 37609 52667 48451 47291 42677 39176 35750 42386 38614 45202 36391 38537 47847 38618 40138 39869 39626 40845 37858 40518 53604 38743 55208 41416 41428 43435 41978 45982 47193 48620 50512 39434 42447 44463 44458 44461 44470 44471 44454 44467 44465 44446 45561 54489 52140 55211 45506 39173 52139 43080 36404 38591 47485 49127 42676 36364 40660 41207Cytochrome b-245, beta polypeptide (chronic granulomatous disease) [Danio rerio] hypothetical protein LOC100194683 [Salmo salar]
no significant blastx hit no significant blastx hit no significant blastx hit no significant blastx hit no significant blastx hit Nucleoporin GLE1 [Salmo salar]
PREDICTED: very large inducible GTPase-1-like [Danio rerio] PREDICTED: very large inducible GTPase-1-like [Danio rerio] Putative transferase C1orf69 homolog, mitochondrial-like [Danio rerio] SH2 domain-containing protein 1B [Homo sapiens]
no significant blastx hit no significant blastx hit
interleukin-8 variant 5 [Ictalurus punctatus]
PREDICTED: very large inducible GTPase-1-like [Danio rerio] CC chemokine GmSCYA123 (CCL19 group)
CC chemokine GmSCYA123 (CCL19 group)
Stromal cell-derived factor 1 precursor [Anoplopoma fimbria] (CXCL12)
bactericidal permeability increasing protein/lipopolysaccharide binding protein variant b [Gadus morhua] no significant blastx hit
cathelicidin 1 [Gadus morhua]
bactericidal permeability increasing protein/lipopolysaccharide binding protein variant b [Gadus morhua] CC chemokine GmSCYA123 (CCL19 group)
hepcidin precursor [Gadus morhua] no significant blastx hit
Metalloreductase STEAP4 [Salmo salar] CD63-like protein [Psetta maxima] transglutaminase [Oreochromis niloticus] muscleblind-like 2 (Drosophila) [Danio rerio] actin [Pyrocystis lunula]
Metalloreductase STEAP4 [Salmo salar] interferon stimulated gene 15-2 [Gadus morhua] reverse transcriptase-like protein [Takifugu rubripes] CCAAT/enhancer-binding protein beta 2 [Epinephelus coioides] hypoxanthine phosphoribosyltransferase [Solea senegalensis] FXYD domain containing ion transport regulator 5b [Salmo salar] interferon-inducible GTPase_b [Salmo salar]
78 kDa glucose-regulated protein [Salmo salar] pre-B-cell leukemia homeobox 4 [Danio rerio] unknown protein [Siniperca chuatsi]
LOC100148704; similar to Poly [ADP-ribose] polymerase 14 (PARP-14) (B aggressive lymphoma protein 2) [Danio rerio] complement component 1, s subcomponent [Xenopus laevis]
GTPase activating protein Rap1-GAP [Gallus gallus] no significant blastx hit
LAG1 longevity assurance homolog 2 [Osmerus mordax] no significant blastx hit
Proteasome subunit alpha type-6 [Salmo salar] Proteasome subunit beta type-7 precursor [Esox lucius]
novel protein similar to H.sapiens MPEG1, macrophage expressed gene 1 (MPEG1, zgc:110354) [Danio rerio] ribonucleotide reductase M2 b [Danio rerio] (TP53 inducible)
Digestive cysteine proteinase 2 precursor [Salmo salar] (cathepsin L-like) SLAM family member 7 [Salmo salar]
no significant blastx hit no significant blastx hit
novel protein similar to mucosa associated lymphoid tissue lymphoma translocation gene 1 (malt1) [Danio rerio] syndecan-2 [Danio rerio]
CC chemokine GmSCYA109 (Fish group ) CC chemokine GmSCYA108 (Fish group ) CC chemokine GmSCYA110, 111 (Fish group ) CC chemokine GmSCYA108 (Fish group ) CC chemokine GmSCYA111 (Fish group ) CC chemokine GmSCYA110 (Fish group ) CC chemokine GmSCYA112 (Fish group ) CC chemokine GmSCYA112 (Fish group ) CC chemokine GmSCYA113 (Fish group ) no significant blastx hit
no significant blastx hit no significant blastx hit no significant blastx hit no significant blastx hit
Multiple myeloma tumor-associated protein 2 homolog [Salmo salar] no significant blastx hit
PREDICTED: uromodulin-like [Danio rerio] CD63 antigen [Salmo salar] Integrin beta-2 [Salmo salar]
FXYD domain containing ion transport regulator 5b [Salmo salar] no significant blastx hit
transglutaminase [Oncorhynchus keta] Cathepsin L precursor [Anoplopoma fimbria]
cysteine protease [Haemaphysalis longicornis] (cathepsin L-like) vimentin variant 3 [Homo sapiens]
-3.0 1:1 3.0
Fig. 3 Hierarchical clustering of 82 probes that are responsive to stimulation with formalin-killed, atypical A. salmonicida. Sample groups are indicated at the top. Asal 24 HPI (red); Asal 0 h (green); PBS 0 h (blue); PBS 24 HPI (yellow). Two outlier individuals are
indicated with an asterisk. Probe ID and description are indicated on the right side. Two gene clusters have been highlighted (see “Discussion”): antimicrobial genes (blue); CC chemokines (orange). A larger version of this image is available as ESM Fig. S5
SSH analysis (Feng et al.2009). Results from the QPCR analysis of spleen tissue for these eight genes are shown in Fig.4. Of these genes, CAMP, GmSCYA123, HAMP, and IL8 were analyzed previously by QPCR using the same spleen samples but with a different QPCR instrument and using technical duplicates instead of technical triplicates (Feng et al.2009). QPCR for these genes was repeated for the current study to ensure that all genes were analyzed using the same protocol. Seven of the 15 genes we selected were newly identified as Asal-responsive by microarray analysis, and results from QPCR analysis for these genes are shown in Fig. 5. Of 15 genes tested, 12 showed a
significant difference in gene expression levels (p < 0.05) between Asal 0 h and Asal 24 HPI samples and/or between PBS 24 HPI and Asal 24 HPI samples, as expected from the microarray results. For three genes (CYBB, C1S, and all_v2.0.2958.C1), QPCR could not confirm a significant transcript expression response to Asal.
As was found with SAM analysis of the microarray data, QPCR data did not show significant differences in spleen transcript expression levels between asymptomatic nodavirus “high carrier” and “no/low carrier” pre-injection samples (data not shown). QPCR data for individual samples are included as ESM Table S7.
Table 2 Selection of genes that show increased expression upon stimulation with formalin-killed, atypical A. salmonicida
Accession no. Immune, inflammatory and bactericidal responses (20/46, 43%)
Bactericidal/permeability increasing protein/lipopolysaccharide binding protein variant b AAM52336
Cathelicidin 1 ACE96051
CC chemokine (fish group) FF411846a
CC chemokine GmSCYA123 (CCL19 group) EX175275
CCAAT/enhancer-binding protein beta 2 ACL98106
CD63 antigen ACI66138
Complement component 1, s subcomponent AAI08809
Cytochrome b-245, beta polypeptide (chronic granulomatous disease) AAH54624
Hepcidin precursor ACA42770
Integrin beta-2 ACN10489
Interferon stimulated gene 15-2 ACZ02438
Interferon-inducible GTPase_b ABW94984
Interleukin-8 variant 5 AAN41457
Novel protein similar to mucosa associated lymphoid tissue lymphoma translocation gene 1 CAK11171
PREDICTED: very large inducible GTPase-1-like XP_684086
SH2 domain-containing protein 1B O14796
SLAM family member 7 ACI68624
Stromal cell-derived factor 1 precursor ACQ58846
Syndecan-2 AAK49414
78-kDa glucose-regulated protein ACI33778
Proteolysis
Cathepsin L precursor ACQ58501
Cysteine protease BAH86062
Digestive cysteine proteinase 2 precursor ACI34170
Proteasome subunit alpha type-6 ACI70015
Proteasome subunit beta type-7 precursor ACO14028
Transport
FXYD domain containing ion transport regulator 5a DAA06142
Nucleoporin GLE1 ACN10786
Metalloreductase STEAP4 ACN11487
These genes were all responsive to Asal using an FDR cutoff of 0.01
a
“CC chemokine (fish group)” represents multiple related sequences with accession nos. FF411846, FF411294, AY614590, AY614592, ES779792, AY614591, FF415129
Discussion
Highly Stringent Analysis of Microarray Data Identifies 82 Probes That Were Responsive to Stimulation with
Formalin-Killed, Atypical A. salmonicida
Because this study was set up to test the newly developed Atlantic cod 20K microarray platform, we chose to use a stringent selection of the final Asal-responsive gene list. Therefore, all gene lists were based on an FDR cutoff of 0.01 and the final responsive gene list contained only the 82 probes that were responsive to Asal when compared to both unstimulated and PBS-stimulated fish.
The list of Asal-responsive probes from the comparison between Asal 24 HPI and Asal 0 h was considerably smaller (104 probes) than the list of Asal-responsive probes from the comparison between Asal 24 HPI and PBS 24 HPI (1,313 probes; Fig.2 and ESM Tables S3 and S4). Closer investigation by hierarchical clustering of the samples using these gene lists gives a possible explanation for this (ESM Fig. S4). When clustering the Asal 24 HPI and PBS 24 HPI samples using the 1,313 probes that were differentially expressed, the results showed that overall within-group variation between individuals was comparable between these two groups, apart from one outlier sample in the Asal 24 HPI group. However, when clustering the Asal 0 h and Asal 24 HPI samples using the 104 probes that were differentially expressed, within-group variation in the Asal 0 h group was much larger than within-group variation in the Asal 24 HPI group. Because the SAM algorithm is based on a modified t test, large variability within a group could negatively impact the statistical power to detect significant gene expression differences, which could ex-plain the shorter list of Asal-responsive genes found when comparing the Asal 0 h and Asal 24 HPI groups. Despite this, we have chosen to restrict the final Asal-responsive gene list to the overlap of both comparisons to minimize the possibility of false positives, which is preferable to
minimizing false negatives for validation of the new 20K microarray platform.
The final list of 82 Asal-responsive probes represents 71 unique genes. The list includes nine probes for six related CC chemokines, which belong to a phylogenetic clade of teleost CC chemokines with no equivalent in mammals, and are therefore designated “fish group” CC chemokines (Borza et al. 2010). Because these genes are related (see Supplementary data 2 in Borza et al. 2010) and the probes share different levels of homology with each other, the mRNA expression levels of individual “fish group” CC chemokines as measured by the microarray are probably affected by the presence of mRNA from related “fish group” CC chemokines. Therefore, expression levels of individual “fish group” CC chemokines have to be interpreted with care. In Table 2, all “fish group” CC chemokine genes have been grouped under one entry.
QPCR Analysis and Comparison with SSH Analysis Confirm Validity of Microarray Results
For 12 of the 15 genes (80%) that were chosen for QPCR validation, the QPCR analysis confirmed that they were significantly upregulated (p<0.05) in response to Asal stimulation (indicated in ESM Table S5B). There are several possible explanations why QPCR and microarray results were different for the other three genes, such as different location of microarray probe and QPCR amplicon, possible misassembly of contigs, and differences in specificity between the QPCR assay and the corresponding informative 50-mer microarray probe.
The spleen tissue samples used in the microarray experiments were previously used for SSH analysis (Feng et al. 2009). When comparing the 71 unique Asal-responsive genes to the 820 assembled contigs and single-tons from the spleen forward SSH library (i.e., enriched for transcripts that were upregulated in response to Asal; Supplementary Table S1A in Feng et al. 2009), there was an overlap of 13 genes (indicated in ESM Table S5B). The SSH libraries were constructed from samples from multiple sampling times (2, 6, 24, and 72 HPI), and so it is expected that a large number of SSH sequences will not be found in the current microarray analysis which is limited to one sampling time point (24 HPI).
The three deepest contigs reported in the spleen forward SSH library were small inducible cytokine SCYA (which is GmSCYA123, a CC chemokine of the “CCL19 group”; Borza et al. 2010), cathelicidin, and hemoglobin subunit beta 1 (Feng et al. 2009). Both GmSCYA123 and cathelicidin were found in the list of Asal-responsive genes as determined by microarray and showed some of the highest transcript level changes (respectively 17 and 6 times higher in the Asal 24 HPI group than in the Asal 0 h
Fig. 4 QPCR results for genes identified as Asal-responsive by microarray and SSH. Average relative quantity (RQ) values with SEM error bars. Gene expression differences were determined by t tests on RQ values with a p value cutoff of 0.05. Statistically significant differences between treatments within time points are indicated with an asterisk. Statistically significant differences between time points within treatments are indicated with letters (lowercase for PBS, uppercase for A. salmonicida; different letters indicate significant difference). Fold upregulation was calculated as (average RQ 24 HPI)/ (average RQ 0 h) for both PBS and Asal groups. Fold downregulation was calculated as 1/(fold upregulation). CAMP, GmSCYA123, HAMP, and IL8 were analyzed previously by QPCR using the same spleen samples but with a different QPCR instrument and using technical duplicates instead of technical triplicates (Feng et al.2009). QPCR for these genes was repeated for the current study to ensure that all genes were analyzed using the same instrument and protocol
group). Hemoglobin subunit beta 1 was not found to be responsive to Asal in the current microarray study, but this is not surprising since hemoglobin subunit beta 1 was also represented by two deep contigs (of 15 and 7 ESTs) in the reverse (i.e., enriched for transcripts that were downregu-lated by Asal) spleen SSH library (Supplementary Table S1B in Feng et al. 2009). These data suggest that hemoglobin subunit beta 1 transcripts were highly abundant in both tester and driver RNA pools involved in SSH library construction rather than up- or downregulated in response to Asal stimulation.
Functional Analysis Shows a Large Number
of Formalin-Killed, Atypical A. salmonicida-Responsive Genes are Immune-Related
Analysis of GO annotations and manual functional annota-tions both showed that a large number of genes were involved in immune response or associated functions such as inflam-matory response and bactericidal response. In the hierarchical clustering procedure, a large number of these genes clustered together. In Fig. 3, two colored bars indicate two such clusters; the blue cluster contains genes with antimicrobial functions such as cathelicidin, hepcidin, and bactericidal/ permeability-increasing protein (BPI)/lipopolysaccharide-binding protein (LBP), and the orange cluster contains most of the CC chemokine “fish group” probes. Previously, SSH analysis of these samples also showed that “immune response” and “proteolysis” were the most abundant GO categories in the spleen forward library (i.e., genes that were upregulated by stimulation with Asal; Feng et al.2009).
The current microarray study has identified some additional Asal-responsive genes that were not found in SSH analysis, such as BPI/LBP, several “fish group” CC chemokines, syndecan-2, and a novel protein similar to MALT1. BPI/LBP and the “fish group” CC chemokine GmSCYA104 were also confirmed to be Asal-responsive by QPCR. Atlantic cod BPI/LBP is a probable descendant of the ancestral gene that gave rise to mammalian BPI and LBP genes (Stenvik et al.2004), like its putative ortholog identified in rainbow trout (Inagawa et al.2002). Based on mRNA expression, protein charge, and amino acid
se-quence, Stenvik et al. (2004) suggest that Atlantic cod BPI/ LBP might have a function that is more similar to that of mammalian BPI than LBP. Mammalian BPI has strong antimicrobial activity against Gram-negative bacteria and can neutralize endotoxins (reviewed in Schultz and Weiss
2007). Stenvik et al. (2004) also showed that BPI/LBP mRNA expression is upregulated in cod spleen after stimulation with formalin-killed Vibrio anguillarum, similar to the response we have shown to stimulation with Asal. The “fish group” CC chemokines have both a homeostatic and an inflammatory function and have been shown previously to be upregulated by stimulation with Asal (Borza et al. 2010). Syndecan-2 is a cell surface heparan sulfate proteoglycan that is a co-receptor for IL8, thought to immobilize IL8 on the cell surface to mediate communica-tion between endothelial cells and neutrophils in humans (Halden et al. 2004). The human Malt1 protein, when in complex with Bcl10, can activate NFκB (Lucas et al.2001,
2004). Interestingly, Martin et al. (2009) found that the CBM complex, containing Carma3, Bcl10, and Malt1, was a key component of the activation of NFκB by IL8.
There are some well-known genes involved in the antibacterial response, such as g-type lysozyme, transferrin, ferritin, and MH class I, which are missing from our stringent list of 82 Asal-responsive probes. However, these genes are present in the less stringent list of 1,313 Asal-responsive probes that are informative when comparing Asal 24HPI to PBS 24HPI (ESM Table S4). As mentioned earlier, hierar-chical clustering revealed that the Asal 0 h samples’ transcript expression profiles were more heterogeneous than those of the other groups. This may be the cause of the relatively short Asal-responsive probe list when comparing Asal 24 HPI to Asal 0 h (ESM Table S3), and of the absence of a number of “expected” genes from this list, which therefore are also missing from our stringent final gene list. Recently, Caipang et al. (2010) reported on gene expression changes in Atlantic cod gill tissue in response to A. salmonicida using semiquantitative RT-PCR. They showed an increase in expression of several antibacterial and cytokine genes. Our microarray study corroborated these results and identified a large number of additional genes involved in antimicrobial, inflammatory, and immune responses that are responsive to Asal. Some of the genes that were Asal-responsive in our study were also found to be responsive to A. salmonicida in other species such as Atlantic salmon (Salmo salar; Ewart et al. 2005; Fast et al. 2007; Martin et al. 2006), rainbow trout (Oncorhynchus mykiss; Mulder et al. 2007), and Atlantic halibut (Hippoglossus hippoglossus; Park et al.2005).
Overall, our analysis shows that in response to stimula-tion with Asal, a large number of genes involved in the innate immune response are upregulated. Since Atlantic cod is known to mount at best a weak specific antibody
Fig. 5 QPCR results for genes identified as Asal-responsive by microarray only. Average relative quantity (RQ) values with SEM error bars. Gene expression differences were determined by t tests on RQ values with a p value cutoff of 0.05. Statistically significant differences between treatments within time points are indicated with an asterisk. Statistically significant differences between time points within treatments are indicated with letters (lowercase for PBS, uppercase for A. salmonicida; different letters indicate significant difference). Fold upregulation was calculated as (average RQ 24 HPI)/ (average RQ 0 h) for both PBS and Asal groups. Fold downregulation was calculated as 1/(fold upregulation)
response to pathogens, this strong innate immune response might be an alternative mechanism in the defense of Atlantic cod against bacterial pathogens.
The Atlantic cod 20K Oligonucleotide Microarray is a Valuable New Tool for Genomics Research
Our newly developed Atlantic cod 20K oligonucleotide microarray platform is a large-scale microarray that contains genes from a large variety of tissues and involved in many pathways. There are only two other Atlantic cod microarray platforms currently published: the IMR Atlantic cod 16K cDNA microarray (Edvardsen et al.2010) and the small-scale CodStress microarray with genes involved in stress and immune responses (Lie et al. 2009). The IMR EST database used by Edvardsen et al. (2010) is relatively small (it consists of ~44,000 ESTs from 20 un-normalized cDNA libraries), and sequences for the IMR 16K cDNA microarray were only selected from ten of those cDNA libraries, representing ~27,000 ESTs. In addition, 3,967 of the 16,000 sequences selected were singletons without annotation. In contrast, our Atlantic cod 20K oligonucleo-tide array contains sequences selected from a much larger collection of 154,142 ESTs from 42 normalized and SSH cDNA libraries, representing a diverse set of tissues, developmental stages, and stimuli, and no un-annotated singletons were included on the array. Therefore, we anticipate our Atlantic cod 20K oligonucleotide micro-array to be an excellent representation of the Atlantic cod transcriptome in a broad range of conditions and thus a valuable tool for Atlantic cod functional genomics research. The CodStress microarray contains genes that originated from tissues of Atlantic cod exposed to toxicants (Lie et al. 2009), a treatment that is not represented in the collection of CGP cDNA libraries. Therefore, the CodStress microarray and the newly developed Atlantic cod 20K oligonucleotide microarray could supplement each other in toxicology and other research. Together with the recently constructed SNP platform and linkage map (Hubert et al. 2010), and an ongoing effort to sequence the full Atlantic cod genome (Johansen et al.2009), they form an important set of tools for marker-assisted selection to improve Atlantic cod aquaculture.
In summary, we developed and validated the CGP Atlantic cod 20K oligonucleotide microarray. The selec-tion of sequences from a diverse collecselec-tion of ESTs ensures that the microarray can be applied in a broad spectrum of Atlantic cod functional genomics studies. The incorporation of sequences selected from SSH libraries, which were enriched for defense-related genes, makes this microarray platform particularly useful for studies of Atlantic cod global gene expression responses
to immune stimuli and other stressors. We demonstrated this by using the 20K microarray to analyze the Atlantic cod spleen response to IP injection with formalin-killed, atypical A. salmonicida, resulting in a gene expression profile that indicates strong antimicrobial and innate immune responses.
Acknowledgments We would like to thank the fish husbandry staff at the Dr. Joe Brown Aquatic Research Building (Ocean Sciences Centre, MUN) as well as everyone involved in tissue sampling. We also thank Yves Daigle at the Atlantic Microarray Facility at ACRI (www.atlanticcancer.ca/amf) for coordinating the production of the microarrays. This research was supported in part by Genome Canada, Genome Atlantic, and the Atlantic Canada Opportunities Agency through the Atlantic Cod Genomics and Broodstock Development Project. A complete list of supporting partners can be found atwww. codgene.ca/partners.php. Funding was also provided by a Natural Sciences and Engineering Research Council of Canada (NSERC) Discovery Grant and a Canada Research Chair to MLR, and through a NSERC Major Facilities Grant to the Ocean Sciences Centre (Memorial University of Newfoundland, MUN).
Open Access This article is distributed under the terms of the Creative Commons Attribution Noncommercial License which permits any noncommercial use, distribution, and reproduction in any medium, provided the original author(s) and source are credited.
References
Benson G (1999) Tandem repeats finder: a program to analyze DNA sequences. Nucleic Acids Res 27:573–580
Borza T, Stone C, Gamperl AK, Bowman S (2009) Atlantic cod (Gadus morhua) hemoglobin genes: multiplicity and polymorphism. BMC Genet 10:51
Borza T, Stone C, Rise ML, Bowman S, Johnson SC (2010) Atlantic cod (Gadus morhua) CC chemokines: diversity and expression analysis. Dev Comp Immunol 34:904–913
Bowman S, Hubert S, Higgins B, Stone C, Kimball J, Borza T, Bussey JT, Simpson G, Kozera C, Curtis BA, Hall JR, Hori TS, Feng CY, Rise M, Booman M, Gamperl AK, Trippel E, Symonds J, Johnson SC, Rise ML (2010) An integrated approach to gene discovery and marker development in Atlantic cod (Gadus morhua). Mar Biotechnol (NY). doi:10.1007/s10126-010-9285-z
Bø TH, Dysvik B, Jonassen I (2004) LSimpute: accurate estimation of missing values in microarray data with least squares methods. Nucleic Acids Research 32:e34
Brown JA, Minkoff G, Puvanendran V (2003) Larviculture of Atlantic cod (Gadus morhua): progress, protocols and problems. Aquaculture 227:357–372
Caipang CM, Lazado CC, Brinchmann MF, Kiron V (2010) Infection-induced changes in expression of antibacterial and cytokine genes in the gill epithelial cells of Atlantic cod, Gadus morhua during incubation with bacterial pathogens. Comp Biochem Physiol B Biochem Mol Biol 156:319–325
Celton M, Malpertuy A, Lelandais G, de Brevern AG (2010) Comparative analysis of missing value imputation methods to improve clustering and interpretation of microarray experiments. BMC Genomics 11:15
Edvardsen RB, Malde K, Mittelholzer C, Taranger GL, Nilsen F (2010) EST resources and establishment and validation of a 16k