Comparative carbon cycle dynamics of the present and last interglacial
Texte intégral
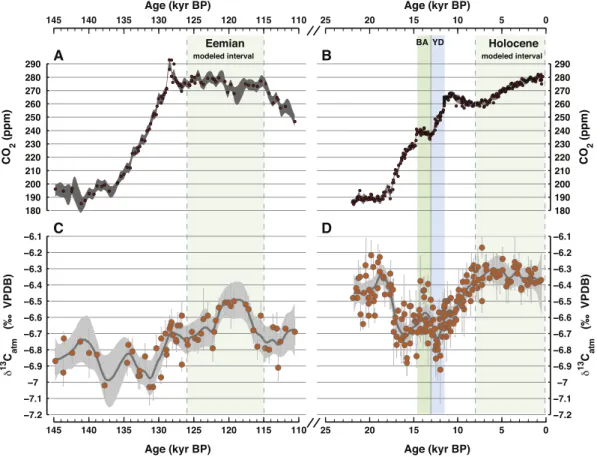
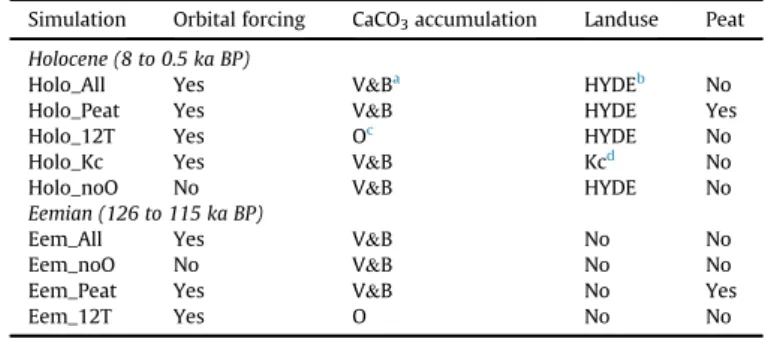
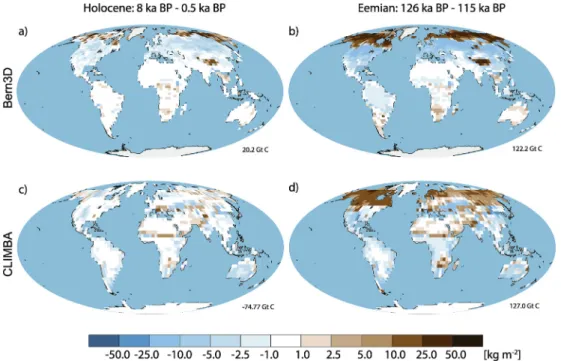
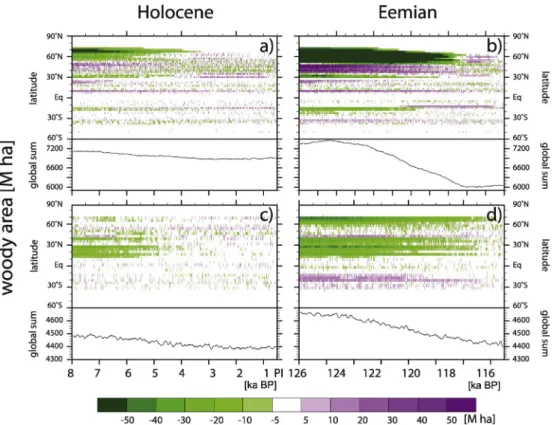
Figure
Documents relatifs
therefore involved in the formation of the new isotopic species of ammonia. We suggested that water contaminants present on the surface, such as HDO, D 2 O, may react with
Distribution d’un horizon à forte cohésion au sein d’une couverture de sol aride du Nord-Cameroun : apport d’une prospection électrique (Distribution of hardpan in soil cover of
Il ne nous reste plus qu’à sélectionner notre disque dur virtuel sur lequel installer Windows et à cliquer sur « Suivant » pour démarrer l’installation. Figure 20 : Choix
The trend is to use pixel- based features, because in high density crowds the local motion features such as point trajectories can be obtained more easily.. The generalized KLT
La promotion du mieux disant soulève des craintes dans la mesure où elle peut faciliter la confection d'ententes de répartition des marchés tout en rendant plus difficile leur
1) In the framework of knowledge management, retrieval of information can be guided by ontologies or knowledge models: corporate document models, domain ontologies,
calibration gas; PR, pressure regulator; MFC, mass flow controller; RDT, Russian doll trap; SR, Schatze reactor;.. COT, collection trap; H, heater; DP, diaphragm pump;
For each case several of the numerical codes were compared in order to identify the forces and weaknesses of the models, to quantify the errors that these models may induce, to
