HAL Id: hal-03117189
https://hal.archives-ouvertes.fr/hal-03117189
Submitted on 8 Feb 2021
HAL is a multi-disciplinary open access
archive for the deposit and dissemination of
sci-entific research documents, whether they are
pub-lished or not. The documents may come from
teaching and research institutions in France or
abroad, or from public or private research centers.
L’archive ouverte pluridisciplinaire HAL, est
destinée au dépôt et à la diffusion de documents
scientifiques de niveau recherche, publiés ou non,
émanant des établissements d’enseignement et de
recherche français ou étrangers, des laboratoires
publics ou privés.
Absolute measurement of the abundance of atmospheric
carbon monoxide
C. Brenninkmeijer, C. Koeppel, T. Röckmann, D. Scharffe, Maya Bräunlich,
Valerie Gros
To cite this version:
C. Brenninkmeijer, C. Koeppel, T. Röckmann, D. Scharffe, Maya Bräunlich, et al.. Absolute
mea-surement of the abundance of atmospheric carbon monoxide. Journal of Geophysical Research:
At-mospheres, American Geophysical Union, 2001, 106 (D9), pp.10003-10010. �10.1029/2000JD900342�.
�hal-03117189�
JOURNAL OF GEOPHYSICAL RESEARCH, VOL. 106, NO. D9, PAGES 10,003-10,010, MAY 16, 2001
Absolute measurement of the abundance of atmospheric
carbon monoxide
C. A.M. Brenninkmeijer,
C. Koeppel, T. R6ckmann,
D. S. Scharffe,
Maya Br•iunlich,
and Valerie Gros
Atmospheric Chemistry Division, Max Planck Institute for Chemistry, Mainz, Germany
Abstract.
The main aspects
of an absolute
method
for measurement
of the mixing
ratio of atmos-
pheric
carbon
monoxide
(CO) are presented.
The method
is based
on cryogenic
extraction
of CO
from air after oxidation
to CO2 followed
by accurate
volumetric
determination.
Gravimetric
meas-
urement
is used
to determine
the quantity
of sample
air processed.
In routine
operation
the overall
error
can
be kept below 1%. Furthermore,
the results
of a laboratory
intercomparison
are analyzed.
It is shown
how offsets
in the commonly
applied
analytical
methods
can occur
and how these
can
seriously
affect results
obtained
at the low concentration
end (<100 nmole/mole).
1. Introduction Chartography (SCIAMACHY)). Validation of data obtained by
such remote sensing instruments is important.
The need to better know the budget of CO is reflected by the Relevant is also the question whether there have been gradual scale of international efforts in measuring and modeling the distri- changes in OH [Crutzen and Zimmermann, 1991; Krol et al.,
bution and interactions of this ubiquitous chemically active trace
gas [Novelli, 1999; Sanhueza et al., 1997; Moxley and Srnit, 1998;
Reichle et al., 1999; Connors et al., 1999; Bakwin et al., 1994;
Novelli et al., 1998b, and the special issue of Chemosphere: Global Change Science, September 1999, 28 further papers]. Be- ing the main reaction partner of hydroxyl (OH), changes in CO af-
fect OH and vice versa. Because of the central role of OH in the
chemistry of the atmosphere, CO is an important trace gas.
Closely
related
to the cycle
of CO is that of lnCO,
which
1998; Prinn et al., 1995]. For establishing the causes, knowledge about changes in CO and also CH4 of similar precision is neces-
sary.
The same
applies
to lnCO,
for which
it may be particularly
important to have accurate observations because of its unique po-
tential as a long term diagnostic for changes the oxidative capacity
of the atmosphere. Although one may never be able to model at-
mospheric
CO (or laCO
for that
matter)
with such
a high
degree
of
confidence that changes of the order of 1% would matter, there is
no doubt that it would be unwise not to have accurate information
shares
the
same
sinks,
namely
OH and
soils.
Given
that
the
major at present.
Even
though
it seems
that
an accuracy
of 1% is feasi-
origin
of the
inc
in laCO
is cosmogenic,
and
therefore
independent
ble,
there
have
been
serious
problems.
of the
sources
of CO
itself,
lnCO
is of interest,
even
though
it pre-
Most
of the
techniques
for measuring
CO are
described
by
sents
only a very small
fraction
of tropospheric
CO ranging
be- Novelli
[1999].
The analysis
of CO is almost
exclusively
based
on
tween
10
'•l and
10
-12.
This
is equivalent
to only
about
5 to 20 relative
methods,
that
is the
comparison
with
standard
mixtures
of
molecules
per
cm
3 air STP.
Nonetheless,
lnCO
is a unique
useful
CO,
and
the
procuring
and
maintaining
of traceable
standards
is
tracer
for diagnosing
OH distribution,
large-scale
hemispheric
cir- difficult
at times.
Since
the discovery
of large
differences
between
culation,
and fluxes
from the stratosphere
into the troposphere
CO calibration
scales
used
by different
laboratories
[Novelli
et al.,
[Volz
et al., 1981;
Brenninkrneijer,
1993;
Brenninkrneijer
and 1991],
good
progress
in standardization
has
been
made
[Novelli
et
ROckmann,
1998;
Brenninkrneijer
et al., 1992;
Mak and
Southon,
al., 1994;
1998a].
Primary
gravimetric
standard
mixtures
have
1998;
JOckel
et al.; 2000,
Quay
et al., 2000].
Because
determina-
been
prepared
and
standards
were
prepared
for laboratory
inter-
tion
of the
abundance
of •4CO
is based
on
that
of CO,
the
ability
to comparison.
[Novelli
et al., 1994].
Two
intercomparions
have
make
accurate
and
precise
observation
of CO is of direct
relevance
been
organized
by National
Oceanic
and Atmospheric
Admini-
for
lnCO
applications.
stration/Climate
Monitoring
and Diagnostics
Laboratory
Of importance
is how
frequently,
how
precisely,
and
how
ac- (NOAA/CMDL),
in 1994
and 1999.
These
"ring
tests"
enable
di-
curately
atmospheric
CO should
be measured.
The question
of rect
comparison
and
allow
the various
laboratories
to systemati-
frequency
and
precision
is linked
to the
variability
of CO which
is cally
follow
and
diagnose
drifts
in CO standards.
This
paper
dis-
dominated by its lifetime and influenced by localized sources. Generally the requirements are not as high as for CO2, CH4, and N20, and a 1% precision is considered adequate. The accuracy with which one has to know the mixing ratio of CO is rather fun- damental because of the long term atmospheric changes. Besides
cusses an absolute method for the determination of CO. Its results
differ significantly from those of several other laboratories in the
50 to 100 nmole/mole range, and the possible reasons will be dis-
cussed.
the analysis of samples of air on site or in the laboratory, remote
sensing
via
satellite
borne
optical
detectors
is rapidly
gaining
im- 2. Experimental
Methods
portance (e.g. Measurement of Air Pollution from Space (MAPS),Measurement
of Pollution
in the Troposphere
(MOPITT),
and 2.1. Extraction
System
Scanning Imaging Absorption Spectrometer for Atmospheric
The technique of Stevens [Stevens and Krout, 1972] for the
Copyright
2001
by
the
American
Geophysical
Union.
isotopic
analysis
of CO
is used.
In essence,
CO2
is removed
from
air, after which the CO content is oxidized and subsequently col-
Paper number 2000JD900342. lected as CO2. The mixing ratio of CO is obtained by determining
0148-0227/01/2000JD900342509.00 the mole fraction of CO2. The system (Figure 1) is an improved
10,004 BRENNINKMEIJER ET AL.: ABSOLUTE CO MEASUREMENT Lab air PMST CAG RDT1 RDT2 PIR DF MAN SB VENT DP TV
Figure 1. The CO extraction system. The following abbreviations were used: ZAG, zero gas generator; CAG,
calibration gas; PR, pressure regulator; MFC, mass flow controller; RDT, Russian doll trap; SR, Schatze reactor;
COT, collection trap; H, heater; DP, diaphragm pump; PMST, purge molecular sieve trap; DF, drying finger;
MAN, manometer; PT, pressure transducer; SB, sample bottle; PIR, Pirani vacuum gauge; HV, high vacuum pump
stand; BV, buffer volume; TV, throttle valve; BGM, bellows gas meter.
version of a predecessor [Brenninkmeo'er, 1993]. The main prop-
erties of the CO extraction procedure are as follows: (1) It is an
absolute method in which the CO is quantitatively extracted; (2) it
is an integrating method, which implies that by increasing the
sample size through processing more air, the signal-to-noise ratio improves; and (3) the method has a low detection limit in the sub-
nmole/mole range.
The flow of sample
air (5 L min
-• STP) is regulated
with a
thermal mass flow controller (Hastings type HFC-202F). Con- densable compounds are removed by two ultra efficient Russian Doll traps submerged in liquid nitrogen [Brenninkmeijer, 1991]. Such traps consist of stainless steel cylinders incorporating three concentric borosilicate glass fiber thimbles. Cooling at the outlet of these traps is prevented by sheathed thermocouples heater ele- ments [Brenninkmeijer and Hemmingsen, 1988]. After removal of
all CO2, N20, and hydrocarbons (C3 and higher), CO is oxidized
to CO2 in a reactor
(kept at 35øC)
filled with 0.8 I of Schatze's
reagent [Smiley, 1965], which consists of acidified I2Os on sili-
cagel. The reagent does not induce isotopic exchange and is very
efficient in oxidizing CO.
The small quantity of CO2 from the oxidation of CO is trapped
at liquid nitrogen temperature in a glass Russian Doll trap
[Brenninkmeo'er and ROckmann, 1996]. Measurement of the
quantity of CO2 produced is volumetric. The respective manome-
ter consists of a volume isolated with a 5 mm bore O-ring glass
valve [Brenninkmeo'er, 1981] and is fitted with a piezo-resistive
absolute pressure transducer (Institute of Geological and Nuclear
Sciences
(IGNS),
model
9401).
The volume
being
only
0.816
cm
3
increases the pressure obtained and therefore the resolution.
2.2. Extraction Procedure
When not in use, the system is back-flushed with laboratory
air cleaned using a 10 L reactor with 13X synthetic zeolite. The
Schatze reagent is kept sealed off. Air samples are processed as
follows. Back-flushing is terminated, and the two Russian Doll
traps are submerged one after the other in liquid nitrogen. Sample
air is admitted via the mass flow controller, and pumped away
using the diaphragm pump (Vacubrand, type MZ4, O-ring set for
improved
sealing
was
used).
At an initial
flow rate
of 1.5 L min
't
the system pressure reaches 50 hPa. The system is flushed for 10
min after which the air is shunted through the Schiitze reactor. The
system is flushed for 10 min and the collection trap cooled. After
1 min, the glass fiber thimbles have reached liquid nitrogen tem-
perature, and sample collection of CO2 commences. The integrator
of the flow controller is initialized, and the gas meter readings are
recorded.
Subsequently,
the flow is increased
to 5 L min
'• upon
which the pressure increases to 180 hPa. This is the highest possi- ble pressure for optimizing the residence time of CO molecules in the Schiitze reactor without freezing out oxygen in the traps.
After processing 350 to 400 1 of air the flow is throttled to 1.5
L min
4 and
terminated
after
1 min.
The bypass
is opened,
and
the
Schiitze reactor is isolated. The inlet valve of the collection trap is
closed. The process pump valve is closed at 5 hPa, and the valve
to high vacuum pumping stage (Pfeiffer molecular drag pump) is opened to evacuate the collection trap. Subsequently, the U tube is
submerged in liquid nitrogen, its outlet valve is closed, and the
large dewar surrounding the collection trap is removed. During 5
min the sample CO2 is distilled into the U tube. After further
evacuation, the inlet valve of the U tube is closed, and the sample CO2 is distilled into a small finger containing P205 for removing traces of water. Next the CO2 is transferred into a manometer by
cryogenic distillation. After measuring pressure (typically 20 to 60
hPa) and the temperature, the sample CO2 is distilled into a sample bottle for transfer to the mass spectrometer. The manual procedure can be automated by using methods developed before
[Brenninkmeo'er, 1983].
2.3. Determination of the Quantity of Air
Calculation of the mixing ratio is based on the volume of CO-
derived CO2 and the quantity of dry air processed. The quantity of
air is determined using the electronic mass flow controller. This
device is calibrated using a gas burette. Furthermore, a bellows
type gas meter integrates the amount of air at the exhaust of the
system. A buffer volume between the diaphragm pump and the meter reduces pressure pulses and improves the accuracy of the
reading.
To ensure precise and accurate measurement of the amount of
air, the cylinder containing the air to be processed is at times
placed on an electronic balance. With a resolution and stability of
BRENNINKMEIJER ET AL.' ABSOLUTE CO MEASUREMENT 10,005
can be measured to better than 0.1%. There are three devices me-
tering the amount of air processed (the correction for the amount
of air CO2
extracted
by the Russian
Doll cleaning
traps
is too
small
to be significant),
namely
the integrating
mass
flow con-
troller, the bellows gas meter, and the electronic balance. The
most accurate and precise measurement is by the electronic bal-
ance.
2.4. Volumetric Determinations of CO2
The determination of the small amount of CO2 recovered is critical. The volume of the manometer, the pressure, and the tem-
perature
have to be known
accurately.
The electronic
pressure
transducer has in the range 0 to 200 hPa a resolution of 0.01 hPa.
The zero readings of this gauge over a period of I year ranged
without adjustment around 0.1 hPa, with a standard deviation of
less than 0.1 hPa. The day to day variability is typically 0.02 hPa, and before each measurement a zero reading is made for correc- tion. The atmospheric pressure reading of the gauge is compared every day with that of a precise atmospheric pressure gauge (Paro- scientific, Digiquartz 740). This instrument is extremely stable, has a resolution of 0.001 hPa, and is calibrated against the read- ings from the weather service. Furthermore, the linearity of the
pressure sensor is better than 0.1%. Note that the linearity in the
actual volumetric measurement also assumes a constancy of the
volume. To ensure reproducibility and minimal volume variations, a 5 mm Vacutap [Brenninkmeijer and Louwers, 1985] is used. Tests performed by repeated sealing of the manometer volume
show that the error made is less than 0.1%.
The volume of the manometer is established using a calibrated volume. This consists of a valve sealing off a short section of stainless steel tubing cut from a longer section. By several times filling this longer section with water and accurately weighing, the volume of the short section (0.2442 cm 3) was determined with high accuracy. By filling this calibration volume with dry CO2 at a well-defined pressure (mostly near 1000 hPa) and temperature,
and transferring this CO2 into the manometer accurate calibrations
are made. To exclude measurement errors or mistakes, several ap-
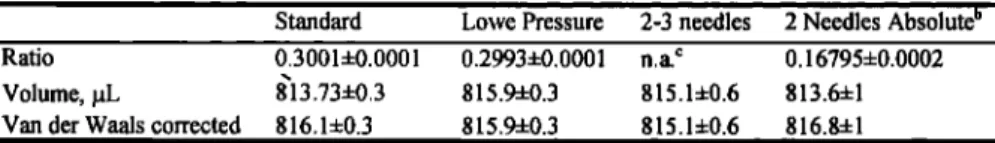
proaches were used, which lead to the values in Table 1. In the
first series of tests the calibration volume was filled with CO2 at
near atmospheric pressure, cross-checked with the Digiquartz in- strument. This CO2 was distilled into the manometer volume, and a pressure reduction of 0.3001 occurred, leading to the manometer
volume given in the table. This value is subsequently corrected
using the van der Waals equation. The end result is 816.1 gL. In the next series of tests the calibration volume was filled to lower
starting pressures. In this instance the van der Waals correction
becomes negligible; however, the starting pressure is not known as well as in the preceding case (no direct comparison at near atmos-
pheric pressure is possible). The end result is 815.9 gL. This also
confirms the high degree of linearity of the pressure transducers used.
The problem intrinsic to determining the manometer volume
accurately is that internal volume measurement is difficult. Inde-
pendent confirmation of the volume calibration was therefore car-
ried out using external volume determinations. Three identical cy- lindrical stainless steel needles, with a diameter of 1.5 mm, were
accurately measured using a micrometer. By doing tests as de- scribed above using two or three needles inserted into the calibra- tion volume (thus reducing its volume), a value of 815.1 gL was
obtained for the manometer. (In this determination the volume of
the needles, provided they are identical, does not play a role.) Fi-
nally, by also using the calculated volume of the needles, a value
of 816.8 gL was obtained. The averaged value is 816.0 +1 gL.
2.5. Verification by Calibration Runs
Regular calibration runs are performed injecting isotopically defined CO into a flow of air devoid of CO (zero air). A main rea-
son for calibration is to establish the effect of the oxidation step on
the oxygen isotopic composition of the CO2 produced. As the
careful work by Stevens has shown, this oxidation solely adds an
oxygen atom to the CO molecule, and there is no isotopic ex- change with the CO2 produced [Brenninkrneijer, 1993;
Brenninkrneijer and ROckmann, 1997]. In addition to the isotopic
information, the calibration runs give a diagnostic of how well the
system produces quantitative conversion and recovery of CO as is
discussed below.
A certain quantity of CO is injected and exactly this should be recovered as CO2. The quantity of air processed during a calibra- tion run is not of primary importance provided the zero air is de-
void of CO. The flow rates of both the zero air and CO injected
can be varied thus providing different concentrations of CO. The
zero air is produced using heated reactors that contain I L of Hop-
calite, or a Pt on aluminum-oxide catalyst (Merck). Temperatures
of 100
to 200øC
are
applied.
After
oxidation
of the CO content,
the
air is passed through a bed of 13X synthetic zeolite. This strips out
water, CO2, and other impurities. With the zero air generators air
without CO can be produced (less then 0.5 nmole/mole) at flow
rates
of up to 20 L rain
4. It is assumed
that at 5 L min
4 the zero
air contains less than 0.1 nmole/mole CO. Tests in which the mo-lecular sieve of the zero air generator is replaced by Drierite (Hammond, Ohio), which does not remove CO2, do not show any
difference in yield or isotopic composition. This is proof of the
extreme efficiency of the two Russian Doll traps (combined
>99.99997% CO2 removal). The small quantity of condensables (CO2 and SO2) that is recovered in a zero run is subtracted from
the quantity obtained for a sample.
Experience shows that the zero yield of the system increases when not in use. After one run the zero yield returns to a low level between 0.1 and 0.2 hPa. This is equivalent to approxi- mately 0.25 to 0.5 nmole/mole for a 350 L air sample. A correc-
tion for this is applied, and the remaining uncertainty is less than
0.1 nmole/mole. Thus, for air samples containing 50 to 200
nmole/mole CO, the uncertainty in the blank correction introduces
an error of 0.2 to 0.05%.
For calibration, CO is not injected as pure CO gas, but as a mixture of 269 ñ 3 [tmole/mole CO in nitrogen gas. This mixture is metered using a thermal mass flow controller (Hastings HFC- 202A) which is occasionally calibrated with a gas burette. Ac-
cording to the supplier of the mixture (NZIG, Lower Hutt), it
contained 271 ppm by volume CO; according to a bulk analysis
carried out in the laboratory in New Zealand it contained 269 ñ 3
Table 1. Determination of the Volume of the Manometer a
• " Stan'dard- - Lø• ve 'i•ressure ' 2.:3-needles' 2Needles AbS01u•e •
Ratio 0.3001+0.0001 0.29934-0.0001 n.a. c 0.167954-0.0002
Volume, gL 813.734-0.3 815.94-0.3 815.14-0.6 813.64-1
Van der Waals corrected 816.14-0.3 815.94-0.3 815.14-0.6 816.84-1
a
The
last
row
lists
the
final
value
after
correction
for
the
non-ideal
gas
behavior
of CO•.
b In this determination the volume of the needles is irrelevant.10,006 BRENNINKMEIJER ET AL.' ABSOLUTE CO MEASUREMENT 18- 14 m 10 m 8 o '- 6 E ::3 4 Z 2 0 97.5 98.0 98.5 99.0 99.5 100.0 100.5 101.0 101.5 Yield [%]
Figure 2. Frequency distribution for 67 calibration runs performed
over 1 year.
I•mole/mole. On the basis of calibrations using this mixture, the
yield of the extraction system is 99.8%, with a standard deviation
for an individual run of 0.7%. These numbers are based on 67 de-
terminations for September 1998 to October 1999. No calibration
result has been omitted. Two persons have operated the system
without this causing systematic differences. The frequency distri-
bution obtained is symmetrical (Figure 2). The near 100% yield
and 0.7% standard deviation prove independently that the CO can
be determined with a precision and accuracy of about 1%. This
overall test involves conversion, trapping, releasing, and transfer-
ring.
2.6. Tests of the Overall Efficiency
In total efficiency the conversion of CO to CO2 is also critical.
If this step is not quantitative, inserting a second Schiitze reactor
into the system and thus doubling the reaction time for CO will in-
crease the yield. If, for instance, the yield is only 90%, the addi-
tion of a second reactor boosts it to 99%. A less cumbersome and
effective alternative is the reduction of the pressure in the Schiitze
reactor during sample processing. Accordingly, by using two
processing pumps in parallel the system pressure was reduced
from the standard 180 hPa to 50 hPa. This reduces the residence time of a CO molecule in the reactor from about 2 s to 0.5 s. It can
be shown that when the yield during the normal 180 hPa condi-
tions is 99%, the yield should drop substantially to a mere 70%. In contrast, during these experiments a drop in efficiency of less than
1% was observed from which it is calculated that the efficiency is
over 99.9999%. During these tests the pressure in the entire sys-
tem was lowered, from which it is inferred that also the trapping of CO2 in the collection trap is nearly 100 % efficient. That the
yield would drop in the Schiitze reactor, and that this would coin-
cidentally be compensated by a concurrent increase in trapping ef-
ficiency of the collection trap, is unlikely. No change in isotopic
composition was observed. Independently, the effect of lower lev-
els of liquid nitrogen around the sample collection Russian doll
trap has been investigated earlier [Brenninkmeijer and ROckmann,
1996]. Altogether these tests corroborate that the values of the
main operating parameters are not in a critical range.
Despite the a priori linearity of the system, evidence for a
small systematic deviation was obtained by analysis of data for
duplicates. For a total of 22 cylinders with air samples collected at
Spitsbergen [R6ckmann and Brenninkmeijer, 1997], two sub-
samples of nominally 400 and 700 L were processed. It turns out
that the mixing ratios established for the 700 L samples are sys-
tematically lower by 1.3%. This is a puzzling effect because there
is no obvious mechanism by which less CO2 would result for
larger samples, or an error in the amount of air processed would
be made. The cause of the effect is traced back to the efficiency of the Russian doll collection trap. Apparently, when the trap is cooled for a longer period of time, its efficiency drops. Because
nearly all samples and calibrations are over a period of less than
80 min, during which 350 to 400 L is processed, this effect had
escaped observation during normal operating conditions. To de-
termine the effect, normal calibrations were followed by delayed
calibrations during which no calibration mixture was injected into
the zero-air flow during the first hour. Under these conditions there was a drop of 2 + 0.5% in efficiency. These tests confirm the
existence of a loss of efficiency when samples are processed over
a longer period of time. The value of 2 _+0.5% will not be used to
correct for the loss of efficiency. The 22 sample pairs of 400 and
700 L give the more accurate value of 1.3%.
The cause for the abstruse loss in efficiency when sample air
is processed over longer periods is not fully understood. The
amount of CO2 seems too small to affect the properties of the large
surface area of glass available for trapping it. Analysis of the
composition of the air passing through the system did not show
unexpected delays in one of the main components. A recent im-
provement to the procedure is to heat the collection trap to about
50øC
during
back
flushing.
After
correcting
the results
for the 700
L samples for loss in efficiency, the duplicates can be used to as-
sess the reproducibility of the system. A standard deviation for a
single determination of only 0.5% is obtained. Thus, for routine
operation, a random error of 0.5% can be guaranteed. This error is
even smaller than that obtained for the calibration runs.
2.7. Linearity Tests
Deviations in linearity are investigated using two different linearity tests. Test one is based on injecting the calibration gas mixture at different rates. With the range of the mass flow con-
troller
being
0 to 10 mL min
-• there
is a practical
lower
limit of
about
1 mL min
'•. Below
this
the uncertainty
in the injected
quan-
tity becomes too large. The results are shown in Table 2. For each
Table
2,. Linearity,,.Test
1
Run
a
Injection
Flow,
mL
Mixing'Ratio
b
min -• 1600 1.0510 58 1601 1.0510 58 1602 2.0441 113 1609 2.0448 113 1603 3.0409 169 1608 3.0280 169 1599 3.9974 223 1604 4.0205 223 1605 6.3471 349 1606 8.0916 446 1607 •8738 544 aOctober 1998.
'inj'e•i•h
Quantity,
Recov&red
Quantity,'
Yield,
•tL
pL
%
23.19 23.32 100.56 23.27 23.34 100.30 45.16 45.35 100.42 45.20 45.54 100.75 67.99 68.12 100.19 66.81 66.75 99.91 88.41 88.52 100.12 89.95 89.63 99.64 139.71 139.92 100.15 178.42 178.05 99.79 217.58 215.76 99.16BRENNINKMEIJER ET AL.' ABSOLUTE CO MEASUREMENT 10,007
setting of the calibration gas mass flow controller it was calibrated against a gas burette with a piston sealed by a mercury ring. At a
flow rate of 5 L min 'l STP zero air, and a total of 400 L air, the
equivalent
mixing
ratio
varied
from
about
60 to 550 nmole/mole.
The yield obtained was 100.1% with a standard deviation for an individual measurement over the entire range of 0.45%. The four duplicate determinations agree well within 0.4%. A linear least squares fit to the data give for the recovered quantity gives y =
0.9927x
+0.52 nmole/mole
(r • = 0.99996).
The data suggest
a
small drop in efficiency. At 544 nmole/mole the yield is 1% below
that obtained for the lower concentrations. Furthermore the yield
is higher than that obtained for the calibration runs (99.8%). The calibration runs are performed at nominally 200 nmole/mole, for which the linear regression gives 99.5%. There are no significant
discrepancies between the results.
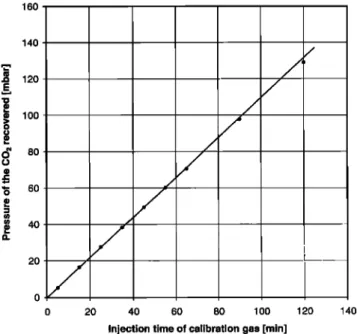
Linearity test 2 is based solely on the duration of the injection
period
at a constant
setting
of 2.0 mL min
-l. This test
checks
the
linearity in the low nmole/mole range up to 300 nmole/mole. Calibration gas was passed through a three- way valve into the zero-air flow allowing a rapid switching between waste and injec-
tion
position.
Injections
at a flow of 2.0 cm
3 min
-I were
performed
for 5 min (with increments of 10 min) to a maximum period of 120 min. The minimum equivalent effective concentration was therefore only approximately 6.5 nmole/mole for the equivalent of 400 L of air processed. Figure 3 shows a good linearity for up to about 60 hPa, and a very small random error. Applying a linear regression, excluding the upper two data points gives y = 1.087 lx + 0.2214 hPa. The standard deviation for a single determination is 0.4%. Using this formula, the deviations for the two highest con-
centrations are 0.4 and 1.4% respectively. The test suggests a
small drop in efficiency when air is processed over long periods of time. This is equivalent to the effect noted for the processing of the 400 and 700 L subsamples of the air cylinders and for the ex-
tended calibration run. The effect is not of relevance for the rou-
tine conditions. Test number 2 is not the exact equivalent of the
injection of, for instance, 7 nmole/mole over the full period of sample processing. It does however establish the linearity of the
system in the important low concentration range.
160 140 120 100 80 60 40 2O /
/
-
/
/
-
/
/
/
0 20 40 60 80 1 O0 120 140Injection time of calibration gas [rain]
Figure 3. Linearity test 2 showing the pressure recorded in the manometer against the duration of the calibration gas injection at a
flow rate of 2 cm
3 min
'l. The nominal
equivalent
concentration
range is approximately 7 to 260 nmole/mole.
Because Russian doll traps are efficient to a degree that can
cause a gas chromatographic delay for CO passing through
[Brenninkmeo'er and ROckmann, 1996], and because the 1 L
Schatze reactor itself in effect is a gas chromatography column,
the speed with which a pulse of CO passes through the system was
measured.
CO at 8 cm
3 min
'l was
injected
only
during
the very
last
5 min of a run. The corresponding yield was 99% which assures
that there is no significant delay or retention of CO. The tests con-
sistently confirm the high linearity, quantitative yields, and high
reproducibility. One remaining question is whether it is pure CO2
that is collected. Mass spectra recorded at high amplification con-
firm purity of the sample collected.
A source of interference could be the oxidation of trace gases
other than CO to CO2 in the Schatze reactor. This was tested by
Stevens and Krout [1972] and is a negligible source of interference
for normal air samples. Generally for the lower CO mixing ratios
in remote air, concurrent nonmethane hydrocarbon mixing ratios
are also lower. Tests based on the injection of C2H4 into calibra- tion or zero air has no effect. Injection of 100 gmole/mole CH4 does not change the amount of CO• recovered, or its isotopic
composition. Higher hydrocarbons (>C3) are effectively trapped
by the Russian doll traps and are present at very low concentra- tions only.
2.8. Accuracy and Precision
Estimated and measured random errors for the 50 nmole/mole
level and processing 350 L of air are as follows: blank correction
0.2%, pressure reading 0.3%, temperature of CO: sample in the
manometer 0.3%, and quantity of air 0.1%.
The combined random error therefore is approximately 0.5%. This can be compared with the independently determined value for the
measured standard deviation of 0.5% which is based on dupli- cates. The precision obtained therefore is 0.5%. For 200
nmole/mole this value improves to about 0.4%.
Estimated values for the maximum systematic error are as
follows: Quantity of air 0.2% and quantity of sample CO: 0.3%. The maximum deviation is thus 0.5%. This can be compared with the independently determined value using the calibration runs of
0.2 +1% deviation.
3. Laboratory Intercomparison Tests
3.1. Analysis and Evaluation of the 1993-1995 Laboratory Intercomparison
Over more than 10 years thorough work has been carried out to continuously improve the quality of CO measurements [Novelli et al., 1994]. Ring tests which are laboratory intercomparisons in which laboratories analyze subsamples of air from the same suite of cylinders help to compare data [Novelli et al., 1998a]. It is im-
portant not only to compare scales but also to understand the dif-
ferences. A predecessor of the present system [Brenninkmeijer, 1993] was used in the 1994-1995 ring test [Novelli et al., 1998a]. Four cylinders with nominally 50, 100, 150 and 200 nmole/mole
were analyzed at the National Institute of Water and Atmospheric
Research (NIWA), New Zealand in 1994. Because it was consid- ered that by withdrawing as much as 350 L of air from the cylin- ders the CO concentration might be somehow affected, thus possi- bly spoiling the results of other laboratories later in the test se-
quence, it was decided to use the NIWA gas chromatograph (GC)
system equipped with a reducing gas analyzer. Therefore the re- sults could not be as precise as they would have been with direct
analysis by extraction.
The GC was calibrated using the extraction system and a set of 10 cylinders with CO values from 50 to over 200 nmole/mole. The response of the GC system with reducing gas analyzer was not
10,008 BRENN1NKMEIJER ET AL.: ABSOLUTE CO MEASUREMENT 300 - 250 200 150 lOO 50 o 0 50 100 150 200 250 absolute (nmolelmole)
Figure 4. The calibration with quadratic least squares fit of the
NIWA CO gas chromatograph in 1994 using 10 cylinders assayed
by the absolute method.
linear. Furthermore, an air sample with a CO mixing ratio of 3.7 nmole/mole did not give a chromatography peak that could be in- tegrated. The response of the GC systems with reducing gas ana- lyzers is not always linear and may vary depending on the operat- ing conditions. The results are shown in Figure 4. The scatter of the individual data points relative to the quadratic least squares fit
is less than 1%.
Table 3 shows the ring test results [Novelli et al., 1998a]. The mixing ratios relative to the NOAA-CMDL scale differ by 3% at the high end to 8% at the 50 nmole/mole level. In Figure 5 all re- sults except those from INPE and HKP which showed rather large deviations (for acronyms, see Novelli et al. [1998a]) are plotted against the NIWA data as percentage deviation.
Several inferences that may improve the understanding of the
differences will be made. CMDL, the Common Wealth Scientific
and Industrial Research Organization (CSIRO), and NASA used the GC technique and the CMDL scale. NASA agrees fairly well
with the NIWA values, but CMDL and CSIRO do not. The latter
two are mutually consistent, and their results suggest that the NIWA values have an increasingly positive bias with decreasing concentration, for brevity referred to here as "the trend". IFU and CSIR, both using a mutual scale, and the GC technique, closely
confirm the trend. Therefore one almost cannot escape but one
conclusion. The NIWA values must be wrong, and this explains
the trend. But is this correct? Not necessarily, because this also
depends on whether the IFU scale used was independent of the
CMDL scale. Both scales have a history of intercomparisons.
Consequently, there may be no independent proof that the NIWA
values are wrong.
What seems to cast some doubt on the NIWA data is that AL
using the gas filter correlation technique (GFC) and National In- stitute of Standards and Technology (NIST) standards, seems to
confirm the trend. Indeed, if the AL values are based on an inde-
pendent scale and technique, the trend is confirmed independently,
and the NIWA values must be in error. However, the UMD re-
sults, which also used GFC and NIST standards contradict the ex-
istence of the trend. Actually, both NASA and UMD do have very similar results, despite the use of different techniques and different standards. Admittedly their agreement at the 50 nmole/mole level
is not as close as for the other three values, but with the GFC
technique larger errors occur in the lower reaches, and these are
also given. However, because UMD and NASA use independent scales and independent techniques, their results give support for the NIWA data showing an opposing trend.
From the available information it is not possible to retrospec-
tively assess which values are correct. The results of the absolute
method do not necessarily appear more correct. For better under-
standing the causes for the observed deviations a model based on
the applied metrology is used. The NIWA data are used as refer-
ence; this is a working hypothesis. Consider the GC and GFC
techniques. The GC technique suffers from two deficiencies. One is that the detector response is not always linear. This effect will
not be considered here. The second problem is that the detection
limit is not zero. When air containing only a few nmole/mole is injected, there may be no chromatography peak that can be inte- grated for determining a signal. The gas filter correlation (GFC) technique is intrinsically linear, but suffers from a worse signal- to- noise ratio. Several laboratories have improved these instru- ments, yet even then, air containing a few nmole/mole CO cannot
be assayed accurately. Thus both techniques cannot directly de-
termine whether an air sample is free from CO at the nmole/mole level. The other problem is the familiar one that both techniques are indirect, and depend on the comparison of the system response
with that for standards.
The errors introduced by offset and calibration errors in sys-
tems based on standards can be calculated. It is assumed for the
present discussion that the assumed or measured mixing ratio "a"
is related to true or real value "r" and the offset of the detector "z"
via a = cr + z. The relative error is A = a/r-1 = (c - 1) + z/r. In
the next case the effect of errors in standards is addressed. Stan-
dards can be produced with great accuracy, based on gravimetric procedures. In these, uncertainties in the degree of dilution can be minimal. Another option is dynamic dilution, where the dilution errors may be larger, but often still acceptable. For reaching the low mixing ratios dilution with zero air or gas is applied. The point is that a large amount of air is added to lower the mixing ra- tio. Therefore the CO content of the dilution gas must be in the sub-nmole/mole range. If a high degree of dilution is needed, a re- sidual CO level of 0.5 nmole/mole will lead to approximately the same bias of the diluted concentration produced. At the 50
nmole/mole level this would induce an error of 1%. It is assumed
for the present discussion that a standard is available with an ac-
tual mixing ratio "s". The assumed mixing ratio is, however, cs
Table
3. Results
for Two
Laboratop,
Intercomparisons
a
1993-1995 Rin• Test
NIWA gas ½hromato- NOAA-CMDL MPI-C absolute
graphy/absolute 1998-1999 Rinlg Test 56.1 51.5 51.8 102.7 97.6 98.8 154.1 147.7 151.4 204.5 198.0 183.4 350.7 Units are nmole/mole.
b p. •Novelli
(personal
communication,
1999).
Uncertainty. 52.1 (0.5) c 45.0 (0.9) c 98.9 (1) 91.6 (0.9) 149.5 (1.5) 147.1 (1.4) 182.3 (2) 183.6 (1.8) 351.4 (7) 355.7 (6)
MPI-C gas NOAA-CMDL
BRENNINKMEIJER ET AL.' ABSOLUTE CO MEASUREMENT 10,009 2 -10 -12 UMD
NASA
NIWA AL CSIR IFU CMDL CSIRO JMAmodel
J
i ! ! i 0 50 100 150 200 250 nmole/moleFigure 5. The results of the 1994-1995 ring test, plotted as the percent deviation relative to the NIWA data. The curve shown is based on c = 0.989 and z = - 2.2 nmole/mole (see text). For the laboratory identifiers, see Novelli et al., 1998a.
nmole/mole. Further, it is assumed that the air for dilution is as- sumed to have 0 nmole/mole although it actually contains "z" nmole/mole. This leads, for the standard made by dilution of a
factor 'f ", to the assumption a = fcs. The real mixing ratio is, however, r =j• + (1-J)z. The resulting error is A = a/r-1 =(c - 1)
+ z/r. This error in the standards causes the same error for sample
values. A third possibility for introducing systematic errors is that CO is gradually produced in a set of standards stored in cylinders. This is a common problem, and in the simplest case CO would grow at constant and identical rates in all cylinders irrespective of
the CO concentration. This leads to a similar expression as for the
two cases considered.
What becomes apparent from inspection of Figure 5 is that nearly all curves exhibit the hyperbolic characteristic of the ex- pression derived above. The differences between the laboratories can be expressed in terms of offsets and calibration differences. At
low values the offset becomes a dominant source of error. These
deviations between the laboratories can also be gleaned from the
tabulation by Novelli et al., [1998a] based on quadratic equations comparing all institutes to the NOAA scale. In Figure 5, NASA
and UMD have curves that show an increasing positive deviation. CMDL, CSIRO, AL, JMA, and IFU together with CSIR show an
increasing negative relative deviation towards the low concentra- tions. The curves most probably represent either the effect of bias
in calibration and the existence of an offset, or the use of a
nonzero dilution gas and a deviating value for the gas that was di- luted, or the growth of CO in cylinders with standard mixtures.
The results from NIWA will now be compared with the aver-
age values of the other laboratories. At the nominal value of 200
nmole/mole the deviation between NIWA and the average is 4.4
nmole/mole, or 2.2%. For calculating the averages, the values in Table 3 [Novelli et al., 1998a] are used without weighting the in- dividual errors. Only the last CMDL value and one of the values submitted by CSIRO were used. HKP and INPE results were
omitted. Because some scales are linked, this average is biased.
Despite this, the most probable conclusion would be that the
NIWA data at nominally 200 nmole/mole were 2.2% too high. At
the lowest mixing ratio near 50 nmole/mole, the average value is
53.3 nmole/mole, which is 5.0% below the NIWA value. For cal-
culating the average value, the second value submitted by CSIRO
has been used, otherwise the same criteria apply as before. Using
the equations derived above gives z = - 2.2 nmole/mole and c =
0.989 as offset and calibration error, respectively, for the average
compared to NIWA.
Without further information no further conclusions can be
drawn. On the basis of the previous sections on the absolute method, it would seem that a plausible scenario is that NIWA had an error in the 200 nmole/mole range of about 2%. This for in- stance could be the result of a wrong calibration of the gas meter. If this applies, it still does not explain the higher values in the 50 nmole/mole range. In view of the low detection limit of the abso- lute method, and the high linearity, a conclusion would be that the average of the other laboratories is too low by a several nmole/mole. For a direct comparison between NIWA and the
NOAA scale, this would mean that in the 50 nmole/mole range,
the NOAA value was 3.5 nmole/mole too low in 1995.
3.2. The 1998-1999 Laboratory Intercomparison
The second ring test involved two circuits of laboratories and
two sets of cylinders. One set of cylinders with nominal values
from 50 to 350 nmole/mole was made available to the Max Planck
Institute for Chemistry. This time, in contrast to the first compari-
son in New Zealand, the mixing ratio for each cylinder was di-
rectly determined by processing 400 L of air from each cylinder
with the system described. This volume of air was less than 10%
of the cylinder' s content.
It was also decided to additionally perform gas chroma-
tographic determinations with a reducing gas analyzer (type RGA 3). The gas chromatograph was calibrated independently from the
extraction system results by using a single cylinder that was cali-
brated by NOAA-CMDL in 1996 to have 172 + 3 nmole/mole,
and applying dynamic dilution downward using zero air. During this calibration by dynamic dilution, two further cylinders with air
were fixed in their mixing ratio relative to the dilution line. The
three cylinders were then used to assay the five unknown NOAA- CMDL test standards. Extrapolation was used for the higher con- centrations. The results listed in Table 3 show good agreement. There is a discrepancy with the values of NOAA/CMDL obtained
10,010 BRENNINKMEIJER ET AL.: ABSOLUTE CO MEASUREMENT
in 1999, which indicates a problem with the standards. Such
problems were acknowledged (P. Novelli personal communica- tion, 1999) and are treated in a paper in press (K.A. Masarie et al.,
The NOAA/CSIRO Flask Air Intercomparison Experiment: A
strategy for directly assessing consistency among atmospheric
measurements derived from independent laboratories, submitted to
Journal of Geophysical Research, 2000).
4. Conclusions
1. The extraction system has well defined characteristics. The
linearity (better than 1%), the low detection limit (< 0.2
nmole/mole), and the quantitative conversion and trapping of the CO2 formed, even in the smallest quantities equivalent to 7
Brenninkmeijer, C.A.M., and T. R0ckmann, Using isotope analysis to im- prove atmospheric CO budget calculations, inlnternational Symposium on Isotope Techniques in the Study of Past and Current Environmental Changes in the Hydrosphere and the Atmosphere, edited by P. Murphy, pp. 69-77, Int. Atomic Energy Agency, Vienna, Austria, 1998.
Brenninkmeijer, C.A.M., M.R. Manning, D.C. Lowe, R.J. Sparks, G. Wallace, and A. Volz-Thomas, Interhemispheric asymmetry in OH abundance inferred from measurements of atmospheric 14CO, Nature,
356, 50-54, 1992.
Connors, V.S., B.B. Gormsen, S. Nolf, and H.G. Reichle, Spaceborne ob- servations of the global distribution of carbon monoxide in the middle troposphere during April and October 1994, at. Geophys. Res., 104,
21,455-21,470, 1999.
Crutzen, P.J., and P.H. Zimmermann, The changing photochemistry in the troposphere, Tellus, Ser. AB, 43,136-151,1991.
nmole/mole,
support
the
contention
that
CO mixing
ratios
can
be J0ckel,
P.,
C.A.M.
Brenninkmeijer,
and
M.G.
Lawrence,
Atmospheric
re-
determined with an error of less than 1%. sponse time of cosmogenic lsCO to changes in solar activity, d. Geo-
2. The gas chromatography results provide independent evi- phys. Res., 105, 6737-6744, 2000.
dence for conclusion 1, assuming that the standard once assayed Krol, M., P.J. van Leeuwen, and J. Lelieveld, Global OH trends inferred
by
NOAA
as
having
172
nmole/mole
indeed
had
this
value
at the from
methylchloroform
measurements,
d. Geophys.
Res.,
103,
10,697-
moment
of the
test.
This
assumption
is not
unreasonable,
but
the 10,711,
Mak, J.E., and J.R. Southon,1998.
Assessment of tropical OH seasonality usingagreement
is possibly
coincidental
because
the
standard
is a few atmospheric
14CO
measurements
from
Barbados,
Geophys.
Res.
Lett.,
years old and may have drifted. 25, 2801-2814, 1998.
3. The intercomparison results for the 1993-1995 ring test Moxley, J.M., and K.A. Smit, Factors affecting utilisation of atmospheric systematically reflect the effect of offsets at low mixing ratios. CO by soils, Soil Biol. Blochem., 30, 65-79, 1998.
The results from the different laboratories do not allow a conclu- Novel!i, P.C., CO in the atmosphere: measurements techniques and related
sion to be made as to which values were correct. There is no inde- issues, Chemosphere Global Change Sc., 1 (1-3), 115-126, 1999.
pendent
evidence
that
the
absolute
method
as
used
in 1994
pro- Novelli,
tion of a gravimetricP.C.,
J.W.
Elkins,
referenceand
L.P.
scale for measurementsSteele,
The
development
of atmosphericand
evalua-
duced
better
results.
However,
the
results
of the
1998-1999
ring carbon
monoxide,
d.
Geophys.
Res,
96,
13,109-13,121,
1991.
test
show
an even
stronger
trend
effect.
With
the
refinement
in the Novelli,
P.C.,
J.E.
Collins
Jr.,
R.C.
Myers,
G.W.
Sachse,
and
H.E.
Scheel,
absolute method, the test for linearity, and the confirmation by Reevaluation of the NOAA/CMDL carbon monoxide reference scala
means of gas chromatography, this strongly suggests that the and comparisons with CO reference gases at NASA Langley and the lower end of the NOAA scale has dropped. Fraunhofer Institut, d. Geophys. Res, 99, 12,833-12,839, 1994.
4. The results from the absolute method in 1994 and 1999 to- Novelli, P.C. et al., An internally consistent set of globally distributed at-
gether suggest that the lowest range NOAA standards actually
were already low in 1994 by about 5%.
5. It is recommended that in publications of laboratory inter-
comparisons of CO standardization the laboratories involved sup- ply information about zero gas, offsets, standards, and linearity. Acknowledgments. The authors thank Wolfgang Hanewacker for
careful processing and Peter Pohl and Inn Hemmingsen for IGNS, New
Zealand for developing the pressure gauges. The GC development at NIWA (New Zealand) were carried out by D.C. Lowe and G. Brailsford.
mospheric carbon monoxide mixing ratios developed using results from an intercomparison of measurements, d. Geophys. Res., 103, 19,258- 19,293, 1998a.
Novelli, P.C., K.A. Masarie, and P.M. Lang, Distribution and recent trends in carbon monoxide in the lower troposphere, J Geophys. Res., 103,
19,015-19,033, 1998b.
Prinn, R.G., R.F. Weiss, B.R. Miller, J. Huang, F.N. Alyea, D.M. Cunnold,
P.J. Fraser, D.E. Hartley, and P.G. Simmonds, Atmospheric trends and
lifetime of CH3CCI 3 and global OH concentrations, Science, 269, 187- 192, 1995.
We thank Eckehart Scheel for discussions. We particularly thank Paul Quay, P., S. King, D. White, M. Brockington, B. Plotkin, R. Gammon, S.
Novelli for organizing the extensive ring tests, and for critical remarks and Gerst, and J. Stutsman, Atmospheric (CO)-C-14: A tracer of OH con-
discussions. Mark Perri checked the grammar. centration and mixing rates, at. Geophys. Res. 105, 15,147-15,166, 2000.
Reichle, H.G. et al., Space shuttle based global CO measurements during
References April and October 1994, MAPS instrument, data reduction, and data
validation, d. Geophys. Res., 104, 21,443-21,454, 1999.
Bakwin, P.S., P.P. Tans, and P.C. Novelli, Carbon monoxide budget in the R0ckmann, T., and C.A.M. Brenninkmeijer, CO and CO2 isotopic compo-
Northern Hemisphere, Geophys. Res. Lett., 21, 433-436, 1994.
Brenninkmeijer, C.A.M., A pneumatically operated high vacuum glass tap, Int. d. Appl. Radiat. Isotop., 32, 679-681, 1981.
Brenninkmeijer, C.A.M., Deuterium, carbon-13 and oxygen-18 in tree and peat deposits in relation to climate, Ph.D. thesis, Univ.of Groningen, Groningen, the Netherlands, 146 pp., 1983.
Brenninkmeijer, C.A.M., Robust, high efficiency, high-capacity cryogenic trap, Anal. Chem., 63, 1182-1184, 1991.
Brenninkmeijer, C.A.M., Measurement of the abundance of l4co in the atmosphere and the 13C/12C and 180/160 ratio of atmospheric CO, with application in New-Zealand and Antarctica, d. Geophys. Res., 98,
10,595-10,614, 1993.
Brenninkmeijer, C.A.M., and I. Hemmingsen, Sheathed thermocouples used as heater elements,,/. Phys. E, Sci. Instrum., 21,502-503, 1988. Brenninkmeijer, C.A.M., and M.C. Louwers, Vacuum actuated high-
vacuum glass valve, Anal. Chem., 57, 960-962, 1985.
Brenninkmeijer, C.A.M., and T. R0ckmann, Russian doll type cryogenic traps: Improved design and isotope separation effects,Anal. Chem., 68,
sition in Spitsbergen during the 1995 ARCTOC campaign,Tellus Ser. B,
49, 455-465, 1997.
Sanhueza, E., Y. Dong, D. Scharffe, J.M. Lobert, and P.J. Crutzen, Carbon monoxide uptake by temperate forest soils: The effects of leaves and
humus layers, Tellus, Ser. B, 50, 51-58, !997.
Smiley, W.G., Note on a reagent for oxidation of carbon monoxide,Nucl. Sci. A bstr., 3, 391, 1965.
Stevens, C.M., and L. Krout, Method for the determination of the concen-
tration and of the carbon and oxygen isotopic composition of atmos-
pheric carbon monoxide, lnt. d. Mass Spectrom. Ion Phys., 8, 265-275, 1972.
Volz, A., D.H. Ehhalt, and R.G. Derwent, Seasonal and latitudinal varia-
tion of 14CO, and the tropospheric concentration of OH radicals,J Geo-
phys. Res., 86, 5163-5171, 1981.
M. Brltunlich, C.A.M. Brenninkmeijer,V. Gros, C. Koeppel, T. R0ckmann, and D.S. Scharffe, Atmospheric Chemistry Division, Max Planck Institute for Chemistry, D-55020 Mainz, Germany. (carlb•mpch-
3050-3053, 1996.
Brenninkmeijer,
C.A.M.,
and
T. R0ckmann,
Principal
factors
determining
mainz.mpg.de)
the lgo/160 ratio of atmospheric CO as derived from observations in the
southern hemispheric troposphere and lowermost stratosphere, a[ Geo- (Received February 4, 2000; revised May 9, 2000;


![Table 3 shows the ring test results [Novelli et al., 1998a]. The mixing ratios relative to the NOAA-CMDL scale differ by 3% at the high end to 8% at the 50 nmole/mole level](https://thumb-eu.123doks.com/thumbv2/123doknet/13038981.382289/7.910.152.767.970.1092/table-shows-results-novelli-mixing-ratios-relative-differ.webp)

