HAL Id: hal-02982177
https://hal.archives-ouvertes.fr/hal-02982177
Preprint submitted on 28 Oct 2020
HAL is a multi-disciplinary open access
archive for the deposit and dissemination of
sci-entific research documents, whether they are
pub-lished or not. The documents may come from
teaching and research institutions in France or
abroad, or from public or private research centers.
L’archive ouverte pluridisciplinaire HAL, est
destinée au dépôt et à la diffusion de documents
scientifiques de niveau recherche, publiés ou non,
émanant des établissements d’enseignement et de
recherche français ou étrangers, des laboratoires
publics ou privés.
Deuteration of ammonia with D atoms on oxidized
partly ASW covered graphite surface
Henda Chaabouni, Marco Minissale, Saoud Baouche, Francois Dulieu
To cite this version:
Henda Chaabouni, Marco Minissale, Saoud Baouche, Francois Dulieu. Deuteration of ammonia with
D atoms on oxidized partly ASW covered graphite surface. 2017. �hal-02982177�
Deuteration of ammonia with D atoms on oxidized partly ASW covered graphite surface
Henda Chaabouni1,∗, Marco Minissale2,∗∗, Saoud Baouche1, François Dulieu1
1Université de Cergy Pontoise, 5 mail Gay Lussac, 95031 Cergy Pontoise Cedex, France.
LERMA, UMR 8112 CNRS, Observatoire de Paris, Sorbonne Université, UPMC Univ. Paris 6, PSL Research University.
2Aix Marseille Université, CNRS, PIIM UMR 7345, 13397 Marseille, France.
Aix-Marseille Université, CNRS, Centrale Marseille, Institut Fresnel UMR 7249, 13013 Marseille, France.
Abstract
The deuteration of ammonia by D atoms has been investigated experimentally in the sub-monolayer regime on realistic ana-logues of interstellar dust grain surfaces. About 0.8 monolayer of solid NH3was deposited on top of an oxidized graphite surface
held at 10 K, partly covered with ASW ice. Ammonia ice is subsequently exposed to D atoms for different exposure times using a differentially pumped beam-line. The deuteration experiments of ammonia were carried out by mass spectroscopy and temperature programmed desorption (TPD) technique. The experimental results showed the formation of three isotopologue am-monia species by direct exothermic H-D substitution surface reactions: NH3+ D → NH2D + H, NH2D + D → NHD2+ H, and
NHD2+ D→ ND3+ H. The formation of the deuterated isotopologues NH2D, NHD2, and ND3at low surface temperature (10 K)
is likely to occur through quantum tunneling process on the oxidized graphite surface. A kinetic model taking into account the diffusion of D atoms on the surface is developed to estimate the width and the hight of the activation energy barriers for the suc-cessive deuteration reactions of ammonia species by D atoms. Identical control experiments were performed using CH3OH and
D atoms. The deuteration process of solid methanol is ruled by H abstraction and D addition mechanism, and is almost five orders of magnitude faster than ammonia deuteration process.
1. Introduction
Ammonia molecules are detected in the gas phase of molecu-lar clouds: Taurus Molecumolecu-lar Cloud-1 (TMC1-N) [1], with rel-atively high abundances 10−7-10−8respective to H2molecules
[2]. Solid NH3has been detected through infrared absorption
in different astrophysical environments: high-mass protostars [3], low-mass protostars [4], comets [5], and in dense molecu-lar clouds [6]. The interstelmolecu-lar grain mantles in dense molecumolecu-lar clouds are predominantly composed of H2O ice, combined with
other molecules such as (CO, CO2, NH3, H2CO, and CH3OH)
[7, 4]. The abundance of ammonia (NH3) in the icy mantles
is 1 to 15 % with respect to water (H2O) ice [8, 3], while in
the cold dust envelopes of young stellar objects, the ammonia ice fraction is 5 % or less [6]. In comets, ammonia is present at the 1 % level relative to water ice [5]. Deuterated ammo-nia NH2D was first detected by Rodriguez Kuiper et al [9]
in high temperature molecular clouds such as Orion-KL Neb-ula region (T=50-150 K). NH2D molecules have been also
ob-served in many sources towards dark molecular clouds [10], galactic protostellar cores [11], and interstellar dense cores (L134N) [12]. The [NH2D]/[NH3] ratio in gas phase varies
from 0.02 to 0.1. These abundance ratios are larger than the cosmic abundance of elemental deuterium relative to hydrogen
∗Henda Chaabouni; henda.chaabouni@u-cergy.fr ∗∗Marco Minissale; marco.minissale@univ-amu.fr
1Université de Cergy Pontoise, 5 mail Gay Lussac, 95031 Cergy Pontoise. 2Aix Marseille Université, CNRS, PIIM UMR 7345, 13397 Marseille.
(D/H), which is expected from the Big-Bang nucleosynthesis to be 1.5×10⁻⁵[13]. Observations in low mass protostellar cores showed the highest [NH2D]/[NH3] ratios (0.3), indicating that
deuterium fractionation of ammonia increases towards proto-stellar regions [14]. Chemical models explained this high frac-tionation ratio by the gas-phase ion-molecule chemistry with depletion of C, O and CO from the gas phase [12, 14]. Doubly deuterated ND2H ammonia has been also detected for the first
time in cold, 10 K, dense cores L134N by Roueff et al. [15]. The expected fractionation ratio [ND2H]/[NH3] from models is
0.03 [14]. The Caltech Submillimeter Observatory (CSO) has detected the triply deuterated ammonia, ND3, through its JK
emission transition near 310 GHz [16] in cold clouds (10 K). The observed [ND3]/[NH3] ratio in very cold clouds of gas and
dust is found to be closer to 0.001. Such a high isotopic ratio between ND3and NH3suggested that the deuteration of NH3
is likely to occur by ion-molecule reactions in the gas phase, in which deuteron transfer reactions are much faster than proton transfer [16, 17]. Theoretical models of pure gas-phase chem-istry [18, 10, 19] explained relatively well the abundances of simply and multiply deuterated ammonia molecules in dense cores. According to Tielens et al. [20], grain surface chemistry would also build deuterated molecules by deuteration process on grain mantles with D atoms. The trapped deuterated species on grains are eventually released into the gas phase due to the heating of a close star in the formation stage. Recent chemical models of cold dark clouds [21] have shown that desorption of species into the gas phase via thermal evaporation is negligible
for dark clouds with temperatures of 10 K.
The deuteration experiments of solid ammonia by D atoms has been already performed by two astrophysical groups; the Watanabe group (Nagaoka et al. [22]), and the Leiden group (Fedoseev et al. [23] using mainly infrared spectroscopy. The experimental studies of Nagaoka et al. [22] have shown an effi-cient deuteration of CH3OH ice by D atoms addition at low
sur-face temperature. The deuterated methanol species are formed by direct H-D exchange and the combination of abstraction and addition reactions, through tunneling quantum process. These authors have reported that no deuterated species of ammonia are observed in the exposure of pre-deposited NH3ice to D atoms
at temperatures below 15 K. Even the experimental results of Fedoseev et al. [23] have also shown that the deuteration of solid NH3by D atoms did not take place at temperature lower
than 15 K, by depositing D atoms on ammonia ice, or by per-forming co-deposition experiments of NH3 molecules with D
atoms on gold cold surface.
Based on the previous experimental results of Fedoseev et al. [23] and Nagaoka et al. [22], someone wonders about the dramatic difference observed in the deuteration of ammonia and methanol by D atoms in the solid phase. If these authors [23, 22] did not observe the deuteration of the NH3by D atoms
in their experiments, this is probably because of the very high activation energy barrier of the reaction NH3+D in the solid
phase in comparison to that of CH3OH+D. The value of the
ac-tivation energy barrier of the reaction (NH3+ D→ NH2D + H)
has been estimated from earlier experimental [24] and theo-retical [25] works in the gas phase to be 11 kcal· mol−1 or 46 kJ· mol−1. While the activation energy barrier of the ab-straction reaction (CH3OH + D−→ CH2OH + HD), has been
reported from gas phase estimations to be lower than that of ammonia (27 kJ· mol−1) [2]. But up to now, there is no labora-tory studies providing activation energy barriers for the reaction CH3OH + D and that of NH3+ D in the solid phase.
It is obvious that laboratory experiments are important for understanding the deuteration reactions occurring on the cold grain surfaces between condensed molecules and the imping-ing D atoms. However, some factors related to the gas flux of the deuterium atoms, the thickness of the ices on the grains, and the fluences of the atomic species on the surface, may affect the progress and the evolution of these reactions. In the case of the the previous works of Nagaoka et al. [22], and Fedoseev et al. [23], the authors have performed experiments in the multi-layer regime by covering the aluminium surface with 10 ML of solid NH3[22], and the the gold surface by 50 ML of
ammo-nia ice [23], and irradiating the corresponding ices with D-flux of 1-4×10¹³ atoms· cm−2· s−1, and×1014 atoms· cm−2· s−1,
respectively (see Table 1). First of all, the use of a high flux of D atoms in their experiments favors the recombination reac-tions D+D on the surface or in the bulk of the ices, and reduces therefore the reaction efficiency of D atoms with the adsorbed CH3OH and NH3species. However, in the experiments of
Na-gaoka et al. [22], the deuteration reaction (CH3OH + D) seems
to be not affected by the high flux of D atoms. This is probably because the activation energy barrier of H-D exchange reaction between D and CH3OH is lower that that between D and NH3.
On the other hand, as reported by Fedoseev et al. [23], the use of a thick layer of ammonia ice favors the formation of hy-drogen bonds (N-H), that can strength the interaction NH3-NH3
molecules, and prevent the D-H exchange between D atoms and adsorbed NH3molecules.
In this work, we performed deuteration experiments of solid NH3by D atoms in the sub-monolayer regime, and with low
D-flux, on an oxidized highly oriented pyrolytic graphite (HOPG) surface, partly covered with an amorphous solid water (ASW) ice held at 10 K of less than 0.5 ML of thickness, simulat-ing water ice contaminations. We deposited only a fraction of one monolayer of solid ammonia (0.8 ML) on the substrate to study the effect of the grain surface on the efficiency of the deuteration reaction between D atoms and the adsorbed NH3
molecules. In this work, we considered that the physisorp-tion of species on the oxidized HOPG surface dominates the chemisorption process. We also used low D-flux in comparison to the previous works [23, 22] to reduce the recombination ef-ficiency of D atoms on the surface, and increase the probability of the H-D substitution reaction. As shown in the Table 1, at our experimental conditions, even by reducing the D atoms Fluence by factors 100 and 10, with respect to those of Nagaoka et al. [22] and Fedoseev et al. [23], respectively, the total amount of D atoms (53.5 ML) sent on the surface seems to be sufficient for the D-fractionation of solid ammonia, and the formation of the deuterated species NH2D, NHD2, and ND3.
For comparison, similar D atoms addition experiments have been performed with CH3OH molecules to corroborate the
find-ings of Nagaoka et al. [26], and validate the deuteration method governed by the abstraction-addition mechanism. D atom ad-dition and H atom abstraction may not be the only mechanism to deuterate molecules on ices. Direct H-D substitution reac-tions could also proceed at low temperatures to fractionate the astrophysical molecules.
The paper is organized as follows: in section 2, we describe the experimental setup and explain the procedures of the deuter-ation experiments; section 3 presents the experimental results for NH3 + D and CH3OH + D reactions, and in the section 4,
we propose a kinetic model to estimate the activation energy barriers of the successive H-D substitution reactions. We make some concluding remarks in the final section.
2. Experimental
The experiments were performed with the FORMOLISM (FORmation of MOLecules in the InterStellar Medium) appara-tus. The set-up is dedicated to studying the reactivity of atoms and molecules on surfaces of astrophysical interest, under the conditions of temperatures and pressures similar to those en-countered in the ISM. The experimental setup is briefly de-scribed here and more details are given in a previous work [27]. The apparatus is composed of an ultra-high vacuum (UHV) stainless steel chamber with a base pressure of about 10−11 mbar. The sample holder is located in the center of the main chamber. It is thermally connected to a cold finger of a closed-cycle Helium cryostat. The temperature of the sample is mea-sured in the range of 6 K-350 K by a calibrated silicon diode
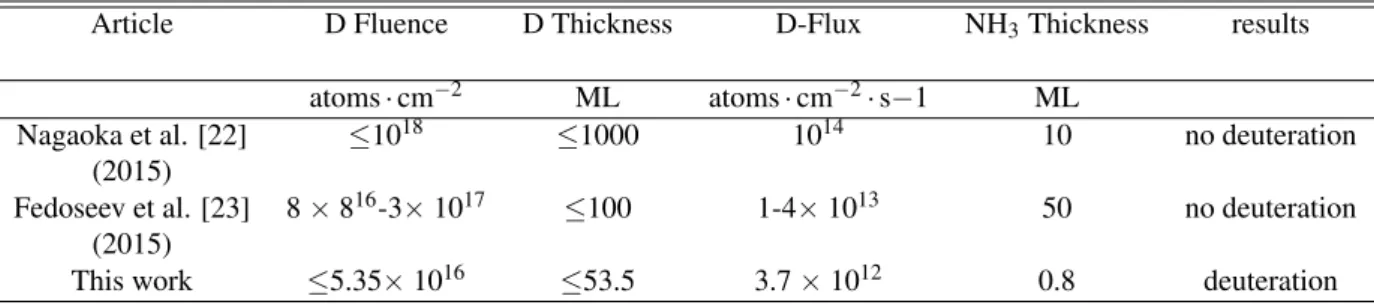
Table 1: Comparison between the experimental conditions and the results of the system (NH3+ D) for different works and references.
Article D Fluence D Thickness D-Flux NH3Thickness results
atoms· cm−2 ML atoms· cm−2· s−1 ML
Nagaoka et al. [22] ≤1018 ≤1000 1014 10 no deuteration
(2015)
Fedoseev et al. [23] 8× 816-3× 10¹⁷ ≤100 1-4× 10¹³ 50 no deuteration (2015)
This work ≤5.35× 10¹⁶ ≤53.5 3.7× 10¹² 0.8 deuteration
clamped to the sample holder. This one is made of a 1 cm di-ameter copper block which is covered with a highly oriented pyrolytic graphite (HOPG, ZYA-grade) substrate. The HOPG is a model of an ordered carbonaceous material mimicking in-terstellar dust grains analogues in astrophysical environments. It is characterized by an arrangement of carbon atoms in a hexagonal lattice. The HOPG grade (10 mm diameter× 2 mm thickness) was firstly dried in an oven at about 100 ◦C dur-ing two hours, and then cleaved several times usdur-ing "Scotch tape" method at room temperature to yield several large ter-races (micron scale) that contain limited defects and step edges. The HOPG was cleaved in air immediately prior to being in-serted into the vacuum chamber. It was mounted directly onto the copper finger by means of a glue (ARMECO Product INC CERAMA BOND 571-P). In chamber, the HOPG sample was annealed to 300 K under UHV to remove any contaminants. In this work, we used an oxidized HOPG sample, which has been preliminary exposed to oxygen atomic beam under UHV for several exposure doses, and then warmed-up from 10 K to 300 K to desorb oxygen and other species from the substrate, mainly water molecules. The oxidation phase was achieved after the saturation bonds of the surface, the defects and the step edges of the sample. This behavior was deduced when there is no modification in the Thermally Programmed Desorp-tion profiles of the adsorbates. Prior oxidaDesorp-tion of the HOPG is expected to give stable surface, where the structure cannot be modified by other adsorbates. However, defects and/or some functional groups may be created on the surface during the oxi-dation phase. These active sites have not been identified by our diagnostics using mass spectrometry and infrared spectroscopy. FORMOLISM is equipped with a quadrupole mass spec-trometer (QMS) which allows routinely the simultaneous de-tection of several species in the gas phase by their masses. The QMS can be placed either in front of the surface for the detec-tion of species desorbed into the gas phase during the warming-up of the sample, or in front of the beam-line for the char-acterization and the calibration of the NH3, CH3OH, and D
atoms beams. The experimental setup is also equipped with a Fourier transform infrared spectrometer (FTIR) for the in-situ solid phase measurements by reflection absorption infrared spectroscopy (RAIRS) in the spectral range 4000-700 (cm−1 [28].
The D atomic jet is prepared in a triply differentially pumped beam-line aimed at the sample holder. Its is composed of three vacuum chambers connected togethers by tight diaphragms of
3 mm diameters. The beam-line is equipped with a quartz tube with inner diameter of 4 mm, which is surrounded by a mi-crowave source cavity for the dissociation of D2 molecules.
When the microwave source (Sairem) is turned on, the cavity is cooled down with a pressurized air jet, and D atoms are pro-duced from the D2molecular plasma. The D2plasma is
gener-ated by a microwave power supply coupled into a Surfatron cav-ity operating at 2.45 GHz and producing up to 300 W. The warm D atoms undergo several collisions with the inner walls of the tube, and finally thermalize at the room temperature of about 350 K before they reach the surface . However, the charged par-ticles composed of exited atoms, ions and electrons, produced in the plasma quickly recombine within the tight quartz tube [29, 30]. Because of the high micro-wave frequency, the hot energetic particles cannot leave the discharge pipe, as reported in some astrophysical laboratory works [29].. With our direct beam-line configuration, even if some residual photons can be sent on the surface during the exposure of the D-beam, the frac-tion of these particles is negligible, and they cannot affect the adsorbed species.
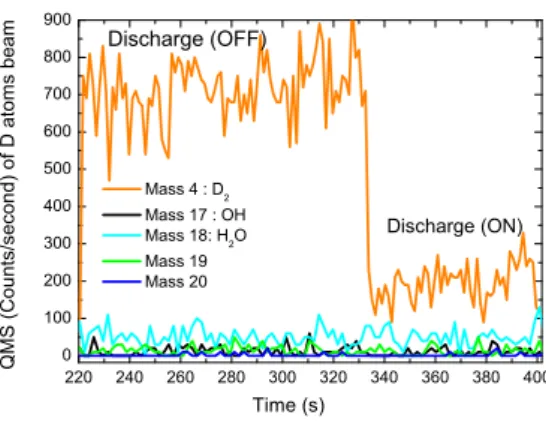
The deuterium beam dissociation rate, measured with the quadrupole mass spectrometer from the D2signals (m/z=4)
dur-ing the discharge (ON) and the discharge (OFF) of the mi-crowave source is calculated from the following relationship
τ=D2(OFF)−D2(ON)
D2(OFF) . In this work, the dissociation rateτof D2
beam reaches a high value of 85 % with an effective microwave power of 50 W.
The flux of the dissociated D atoms coming from the gas phase and hitting the surface is ΦD,ON = (3.7± 0.5) ×1012
atom· cm−2· s−1. It is defined as ΦD,ON = 2τΦD2,Off, where
ΦD2,Off= (2.2± 0.4) ×10
12molecule· cm−2· s−1is the flux of
D2beam before running the microwave discharge. The flux of
D2molecules coming from the beam-line is determined by the
so-called the King and Wells method [31], which is generally used to evaluate the sticking coefficient of particles incident on a cold surface. This method consists to measure with the mass spectrometry the indirect D2signal in the vacuum chamber in
the real time during the exposure of D2on the oxidized HOPG
surface. ΦD2 is calculated from the ratio between the
expo-sure dose of D2 molecules that saturate the graphitic surface,
expressed in (molecule· cm−2) by the corresponding exposure time of D2 on the surface, expressed in (second). According
to the estimation made by Amiaud et al. [27], a compact ice layer begins to saturate after an exposure to 0.45 ML of D2(i.e.
er-220 240 260 280 300 320 340 360 380 400 0 100 200 300 400 500 600 700 800 900 Q M S ( C o u n t s / s e c o n d ) o f D a t o m s b e a m Tim e (s) Mass 4 : D 2 Mass 17 : OH Mass 18: H 2 O Mass 19 Mass 20 Discharge (ON) Discharge (OFF)
Figure 1: The QMS signals (in counts/seconds) as a function of the time (s) of m/z=2 (D), m/z=4 (D2), m/z=17 (NH3), m/z=18 (NH2D, ND2H), m/z=19
(ND2H), and m/z=20 (ND3), given by the QMS, placed in front of the the D
beam after the deposition of the NH3molecules on the oxidized HOPG surface
using the same beamline.
rors about the estimation of D-flux are given in the reference [27].
In this study, we have deposited all species (NH3, CH3OH,
H2O molecules, and D atoms) by using only one beam-line,
oriented at 45◦ relatively to the surface of the sample. That guarantees a quasi-perfect match between the effective areas on which particles are deposited.
In our NH3+D experiments, the beam-line is pumped off to
evacuate the residual gas of ammonia species, after the deposi-tion phase of NH3ice on the cold surface. Then the D atoms
are generated in the same beam-line by the microwave dissoci-ation of D2molecules. We have checked with the QMS, placed
in front of the beam-line, that no deuterated species (NH2D,
ND2H, HDO, ND3, D2O) and radicals (ND2, OD, OH)
contam-inants are coming from the D beam. Figure 1 shows the signal of (m/z=4) before the dissociation of deuterium molecules (dis-charge OFF) and during the dissociation phase (dis(dis-charge ON). We notice that there is no increase in the signal of mass 18 during the discharge ON, which may correspond to NH2D and
ND2species formed from NH3and D atoms within the
beam-line. The small signal of mass 18 is the background signal of H2O molecules contaminants in the main chamber. Moreover,
the absence of the signals (m/z=19) and (m/z=20) excludes any possible formation of NHD2and ND3species in the D beam.
Ammonia and methanol ice films, with a thickness of 0.8 ML were grown on the oxidized HOPG surface held at 10 K by beam-line vapor deposition of NH3 molecules (from
Euriso-top bottle with 99.9 % purity) and CH3OH molecules (from
liquid methanol with 99.5 % purity). The monolayer surface coverage corresponds to the number density of molecules that populate 1015 sites on the surface. It is defined as 1 ML = 1015 molecules· cm−2. In this work, the fluxes of ammonia and methanol species that hit the surface, are defined as the amounts of these species that saturate the surface per unit time (Φ =exposure dose for 1 MLexposure time for 1 ML). The values of the fluxes are found to be ΦNH3 = 2.1× 10
12 molecules· cm−2· s−1 and Φ CH3OH
= 1.7× 10¹²molecules· cm−2· s−1.
Because water is always present as contaminant in the ultra-high vacuum chamber, and can be condensed on the cold sur-face at 10 K, we have performed experiments to study the effect of the water ice on the deuteration of solid ammonia. In order to simulate the small amount of the water ice that can be con-densed on the surface during the exposure phase of the reactants at 10 K, we have deposited a very thin film of porous amorphous solid water (ASW) ice with∼0.5 ML of thickness on the oxi-dized graphite surface at 10 K, by H2O vapor deposition during
5 minutes, using the same beam-line as that for ammonia and D atoms. The water vapor was obtained from deionized wa-ter which had been purified by several pumping cycles under cryogenic vacuum. We have estimated the thickness in ML of the amorphous water ice film grown on the surface at 10 K by beam-line vapor (H2O) deposition using the reflection
absorp-tion infrared spectroscopy (RAIRS). We have deposited water ice on the surface at 10 K, for different exposure times, then we have recorded the RAIR spectra, and measured the integrated areas∫νdν in (cm−1) below the IR absorption bands of wa-ter ice at about 3200 cm−1. Using the formulae S =Ln10
∫
νdν N
[32], where N is the column density of water ice in (molecule
· cm−2), and S is the strength band of H
2O at 3200 cm−1 in
(cm · molecule−1), we have estimated the exposure time re-quired to form 1 ML surface coverage of ASW ice at 10 K. The first monolayer of amorphous water ice covering the surface at 10 K is reached after about 10 minutes of water deposition time with a flux of 1012molecules· cm−2· s−1. The absorbance value of the corresponding H2O infrared band at 3200 cm−1is
very low (AB=0.0005). Because of the low surface coverage of solid NH3(0.8 ML) on oxidized graphite, and the low
ab-sorbance (AB=0.0002) of the infrared band of ammonia at 1106 cm−2for the vibrational modeν2, the deuteration experiments
of ammonia by D atoms on the oxidized graphite surface has been analyzed in this work only by TPD-QMS spectroscopic method.
For the deuteration experiments of solid NH3(or CH3OH),
we firstly deposited 0.8 ML of NH3 (or CH3OH) ices on the
oxidized HOPG surface held at 10 K, and then we exposed the films of ammonia (or methanol) to D atomic beam at the same surface temperature. After the exposure phases, we used TPD technique by warming-up the sample from 10 K to 210 K with a linear heating rate of 0.17 K· s−1, until the sublimation of the ices from the surface. The species desorbed into the gas phase are then detected and identified through mass spectrometry.
3. Results
3.1. Co-deposition of H2O-NH3
In order to study the effect of the water on the adsorption-desorption of ammonia molecules, two kinds of experiments have been performed on the graphite surface held at 10 K us-ing H2O and NH3molecules. In the first experiment, we grow
(∼ 0.5 ML) of amorphous solid water (ASW) ice on the
oxi-dized graphite surface by exposing the sample held at 10 K to H2O water beam during 5 minutes. In the second experiment,
we deposited 0.8 ML of solid NH3on top of 0.5 ML surface
coverage of water (H2O) ice grown on the oxidized graphite
surface at 10 K.
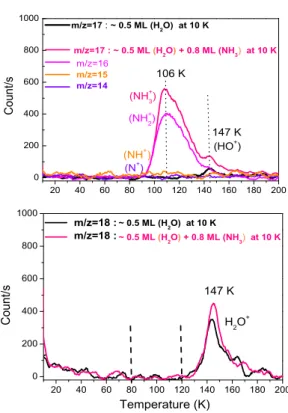
Figure 2, top panel shows the TPD signals of masses ( m/z=17) for pure H2O and mixed ( H2O− NH3) films. These
signals are compared to the masses (m/z=16), (m/z=15), and (m/z=14) of the film ( H2O− NH3). Figure 2, bottom panel
shows the TPD signals of masses ( m/z=18) for both H2O and
( H2O− NH3) films.
The TPD peak of the cracking pattern (OH+) (m/z=17) by the electron impact of the ionized H2O molecules is centered
at 147 K (Figure 2, top panel) , and the maximum of the TPD peak of pure H2O (m/z=18) appears at 147 K (Figure 2, top
panel). For the film ( H2O− NH3), Figure 2, top panel shows
a strong TPD peak (m/z=17) at 106 K, which corresponds to the desorption of pure ionized NH3molecules from the surface,
and a small TPD peak at 147 K (m/z=17), which is attributed to the cracking pattern OH+of the ionized H
2O molecules by
the electron impact. For the same mixed film, the TPD peak at 147 K displayed in the Figure 2, bottom panel is that of ionized H2O molecules (m/z=18). We have checked that no cracking
pattern NH+2 (m/z=16), NH+(m/z=15) and N+(m/z=14) of the ionized NH3molecules desorb at 147 K (Figure 2, top panel).
For the two H2O and ( H2O− NH3) ices, the Figure 2,
bot-tom panel shows only one desorption peak at around 147 K, which is slightly more intense for H2O− NH3ice (in magenta
line) than pure H2O ice (in black line). The small increase in
the area below the desorption curve of m/z=18 at 147 K for the H2O− NH3ice results from the instability of the H2O flux.
3.2. Exposure of NH3and D atoms on graphite surface
In the first experiment, we prepared a film 1 (15.5 ML (D) + 0.8 ML (NH3)), by exposing firstly the
oxidized HOPG surface at 10 K, to D beam for 15.5ML surface coverage, and then to 0.8 ML of NH3ice at the same surface
temperature 10 K. In the second experiment, the film 2 (0.8 ML (NH3) + 15.5 ML (D)), is prepared by exposing 15.5 ML of
D atoms on top of 0.8 ML of NH3 ice pre-deposited on the
oxidized HOPG surface at 10 K. Two TPD control experiments were also performed in addition to the previous ones, by depositing separately 0.8 ML of solid NH3, and 15.5 ML of
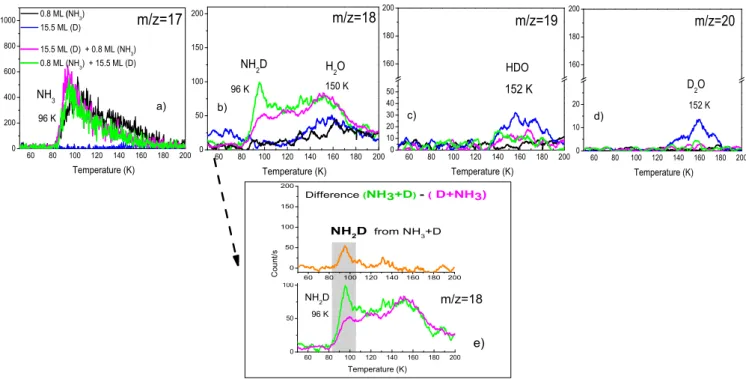
D atoms on the oxidized HOPG surface. The TPD curves of all the experiments are displayed in the Figure 4 for the masses 17, 18, 19 and 20. The TPD curves of the two films of NH3 (0.8 ML) and that of D atoms (15.5 ML) deposited
separately on the surface, showed small peaks at around 152 K, for masses 18, 19 and 20 (see panels (b), (c) and (d) of Figure 3). These peaks correspond to the desorption of water contaminations, such as H2O (m/z=18), HDO (m/z=19), and
D2O (m/z=20). These water impurities came either from the
beam-line during the exposure phases of NH3 and D atoms,
or from the ultra-high vacuum chamber. In the case of the film 1, where D atoms are deposited before NH3on the surface,
the TPD curve of mass 18 in the Figure 3b shows a small desorption peak at around 96 K overlapping a large peak at 130 K-150 K. While in the panels (c) and (d) of the Figure 3, we observe only the desorption peaks at 152 K for the masses
20 40 60 80 100 120 140 160 180 200 0 200 400 600 800 1000 m /z=16 m/z=15 m/z=14 (N + ) (NH + ) (NH + 2 ) (HO + ) 106 K 147 K C o u n t / s m/z=17 : ~ 0.5 ML (H 2 O) at 10 K m/z=17 : ~ 0.5 ML (H 2 O) + 0.8 ML (NH 3 ) at 10 K (NH + 3 ) 20 40 60 80 100 120 140 160 180 200 0 200 400 600 800 1000 m/z=18 : m/z=18 : ~ 0.5 ML (H 2 O) at 10 K ~ 0.5 ML (H 2 O) + 0.8 ML (NH 3 ) at 10 K H 2 O + C o u n t / s Temperature (K) 147 K
Figure 2: TPD signals of mass m/z=17 (Top panel) and mass m/z=18 (bottom panel) between 10 K and 200 K. Black curve: (∼ 0.5) ML of pure porous amorphous water (H2O) ice deposited on the oxidized graphite surface at 10 K.
Magenta curve: 0.8 ML of NH3ice deposited on top of (∼ 0.5) ML of H2O
ice pre-deposited on the oxidized graphite surface at 10 K.
19 and 20, respectively. The desorption peaks at the higher temperatures 150 K and 152 K for the masses 18, 19 and 20 are likely to be originated from water impurities H2O, HDO
and D2O, respectively. Based on the computational results of
Burke et al. [33], the sticking coefficients of the impinging D atoms coming from the gas phase at room temperature onto graphite and ASW ice (held at 10 K) is 90 % and 60 %, respectively. However, the experimental studies of Matar et al. [34] for the sticking coefficient of D atoms on the non-porous ASW ice is estimated to be 30 %. Since our substrate is constituted of an oxidized HOPG, partly coved with ASW ice contaminants (H2O, HDO and D2O), most of the D atoms
exposed on the substrate for the (film 1), will stick both on the oxidized graphite and on the water surface adsorption sites. These atoms promptly form D2 molecules by D + D surface
recombination, either by Langmuir-Hinshelwood mechanism based on the diffusion of two adsorbed D atoms on the surface, or via Eley-Rideal abstraction reactions between adsorbed D atoms and incoming D atoms from the gas phase [35, 36]. Moreover, the experimental and the theoretical studies of Horneker et al. [37] have revealed a possible route for D2
formation on the HOPG surface through D adsorbate clusters. The D2molecules formed on the graphitic surface cannot react
with the NH3molecules adsorbed on the surface, and cannot be
therefore involved in the formation of the new isotopic species of ammonia. We suggested that water contaminants present on the surface, such as HDO, D2O, may react with the deposited
60 80 100 120 140 160 180 200 0 200 400 600 800 1000 96 K NH 3 C o u n t / s Temperature (K) 0.8 ML (NH 3 ) 15.5 ML (D) 15.5 ML (D) + 0.8 ML (NH 3 ) 0.8 ML (NH 3 ) + 15.5 ML (D) m/z=17 60 80 100 120 140 160 180 200 0 50 100 150 200 C o u n t / s Temperature (K) 96 K NH 2 D m/z=18 60 80 100 120 140 160 180 200 0 50 100 150 200 Difference (NH 3 +D) - ( D+NH 3 ) NH 2 D from NH 3 +D 60 80 100 120 140 160 180 200 0 50 100 150 200 H 2 O 150 K Temperature (K) 96 K NH 2 D m/z=18 60 80 100 120 140 160 180 200 0 10 20 160 180 200 D 2 O 152 K Temperature (K) m/z=20 60 80 100 120 140 160 180 200 0 10 20 30 40 50 160 180 200 HDO 152 K Temperature (K) m/z=19 e) a) b) c) d)
Figure 3: TPD signals between 50 K and 200 K of masses: a) m/z=17, b) m/z=18, c) m/z=19, and d) m/z=20. Black curve: deposition of 0.8 ML of NH3ice,
blue curve: deposition of 15.5 ML of D atoms, magenta curve: deposition of the film 1 (15.5 ML D atoms + 0.8 ML NH3), green curve: deposition of the film
2 (0.8 ML NH3+ 15.5 ML D atoms). The deposition of the species is performed on an oxidized HOPG surface held at 10 K. The Figure e) gives the difference
between the green curve (Film 2) and the magenta curve (Film 1) for mass 18. It illustrates the desorption peak of NH2D (m/z=18) at around 96 K, really formed
by the surface reaction NH3+ D.
NH3molecules and form NH2D species (m/z=18) through the
following exothermic reactions (1) and (2), provided by Nist web-book [38].
NH3+ HDO → NH2D + H2O, (1)
NH3+ D2O → NH2D + HDO, (2)
The presence of a very small desorption peak (m/z=20) for the deuterated water at 150 K following exposure to ammonia (magenta traces in Figure 3d) may support our suggestion. The NH2D molecules that can be formed by isotopic exchange
re-action between NH3molecules and HDO and D2O species on
the oxidized graphite surface may desorb between 50 K and 120 K. Moreover, the exposure of D atoms on the oxidized graphite surface may create new functional groups or interme-diates, such as (-OD). These reactive intermediate species may interact with NH3 and form NH2D following the exothermic
reaction (3.2), provided by Nist web-book [38].
NH3 + OD → NH2D + OH, (3)
All these suggestions for the formation of NH2D by heavy
water contaminants or by -OD intermediates, could explain the observed small desorption peak (in magenta), for mass 18, in the Figure 3b, at around 96 K (film 1), where NH3molecules
are deposited on top of D atoms on the oxidized graphite sur-face. In the case of the film 2 (0.8 ML NH3+15.5ML of D),
where D atoms are deposited on top of the solid NH3film, the
desorption peak (in green) at 96 K for mass 18 becomes larger than previously (see Figure 3b). The increase in the TPD area of the peak at 96 K for mass 18 is likely to result from the reac-tion of D atoms with NH3molecules on the surface. The TPD
peak at 96 K of the NH2D molecules produced by the reaction
(NH3+ D) is shown in the Figure 3e. The desorption curve (in
orange) is the difference (film 2-film 1), between the TPD sig-nal of NH2D (m/z=18), expected to be formed from the reaction
(NH3+ D), and the TPD signal of NH2D (m/z=18), produced
from the reaction of NH3with -OD, HDO and/or D2O
contam-inants on the surface.
3.3. Kinetics of NH3+D reaction
The kinetic reaction NH3+ D has been studied by
expos-ing 0.8 ML of solid NH3 to different doses of D atoms (0
ML, 1.0 ML, 6.6 ML, 15.5 ML, 31.0 ML and 53.2 ML). TPD curves of species for masses 17, 18, 19 and 20 are shown in Figure 4 between 50 K and 210 K, for each film of NH3and D
atoms. As shown in the Figure 4a, the maximum of the TPD peak of NH3shifts slightly toward lower temperatures with the
D-exposure time from 104 K to 96 K, and in parallel we observe the disappearance of a second desorption peak, as a shoulder at about 150 K. These desorption temperatures differences can be explained in terms of reaction sites and/or surface contamina-tion, such as water molecules. In these experiments the amount of water ices contaminants on the surface is negligible.
60 90 120 150 180 210 0 10 20 30 40 360 450 ND 3 ND 3 0.8 ML (NH 3 ) 0.8 ML (NH 3 ) + 6.6 ML (D) 0.8 ML (NH 3 ) + 15.5 ML (D) 0.8 ML (NH 3 ) + 26.6 ML (D) 0.8 ML (NH 3 ) + 31.0 ML (D) 0.8 ML (NH 3 ) + 53.2 ML (D) d) m/z=20 150 K Temperature (K) 96 K 60 90 120 150 180 210 0 150 300 450 NHD 2 NHD 2 c) 150 K 96 K m/z=19 Temperature (K) 60 90 120 150 180 210 0 150 300 450 NH 2 D NH 2 D b) m/z=18 150 K Temperature (K) 96 K 60 90 120 150 180 210 0 150 300 450 a) 104 K 97 K 150 K NH 3 -surface NH 3 -NH 3 C o u n t s / s Temperature(K) m/z=17
Figure 4: TPD desorption curves of ammonia species between 60 K and 220 K as a function of D-atoms exposure doses (0 ML, 6.6 ML, 15.5 ML, 26.6 ML 31.0 ML and 53.2 ML) on 0.8 ML of solid NH3ice grown on the oxidized HOPG surface held at 10 K with amorphous water ice contaminants: a) m/z=17 (NH3), b) m/z=18
(NH2D), c) m/z=19 (NHD2), and d) m/z=20 (ND3).
In addition, panels (b), (c) and (d) of Figure 4 show the growth of three double desorption peaks at 96 K and 150 K, for masses 18, 19 and 20, respectively. The desorption peak at about 96 K in Figure 4b is likely to be attributed to NH2D
(m/z=18) species, mainly produced from the reaction between NH3and D atoms. Similarly, the desorption peaks observed at
96 K in Figure 4c, and d are attributed to the doubly deuter-ated species NHD2 (m/z=19), and triply deuterated
ammo-nia ND3(m/z=20), formed mainly by the reaction NH2D+D,
and NHD2+D, respectively. We neglected the contribution of
NH2D, NHD2ND3formed from the contaminants on the
sur-face, mainly water ices in these experiments.
Furthermore, the cracking pattern of the ionized ammo-nia molecules ND+3 (m/z=20), NHD+2 (m/z=19), NH2D+
(m/z=18), and NH+3 (m/z=17) by electron impact, in the ion source of the QMS, are ND+2, NHD+, NH+2, ND+, NH+, D+2, H+2, D+, H+, and N+. The ion fragments NHD+(m/z=17) and ND+2 (m/z=18) provided by the QMS in the vacuum chamber during the warming-up phase, can be added to the TPD signals of ionized NH+3 (m/z=17) and NH2D+(m/z=18) molecules,
re-spectively. This means that the TPD curves in the Figure 4a (m/z=17) peaking at 96 K and 150 K are the mixture of the ionized NH+3, and the cracking pattern NHD+ of the ionized NHD+2 (m/z=19) and NH2D+ (m/z=18). Similarly, the TPD
curves in the Figure 4b (m/z=18), peaking at 96 K and 150 K are the mixture of the ionized NH2D+molecules, and the cracking
pattern ND+2 of ionized NHD+2 (m/z=19) and ND+3 (m/z=20) of the deuterated molecules.
In our experimental conditions, the electron’s energy of the QMS ion source is 32 eV. With this energy, only 30 % of molecules desorbing from the surface are ionized in the head of the QMS. So we can not determine the precise contribution of species having the same mass m/z to the QMS data, but we can assume that most of ammonia molecules desorbing from the surface are not fragmented in the QMS head but only ion-ized.
As previously discussed in section 3.2, TPD peaks observed at 150 K in figure 4, panels b), c) and d) match well with the desorption of water impurities H2O, HDO, and D2O,
respec-tively. The observed deuterated ammonia species in the TPD spectra are likely to be formed by H-D substitution reaction be-tween the impinging D atoms and the ammonia adsorbed on the oxidized graphite surface. We excluded any energetic particles (photons, electrons and ions) in the formation of the deuterated ammonia species. Previous control experiments realized in the laboratory exclude any possible interaction of the electrons with the surface. The energetic particles produced in the microwave plasma of D atoms inside the beam-line can not reach the cold surface of the sample during the D exposure phase, and dis-sociate therefore the adsorbed NH3molecules and cause their
deuteration.
In Figure 4a, the strong TPD peak at 96 K (in black line) has the behavior of multilayer desorption of NH3ice, where NH3
is probably bound to adsorbed NH3molecules. While the TPD
peak (in black line) at 150 K corresponds to NH3 molecules
physisorbed on the sites of the oxidized HOPG surface and contaminants (OD, CD...). In Figure 4b (m/z=18), the TPD peaks at 96 K that increase with the increase of the exposure dose of D atoms, are likely to be attributed to NH2D molecules
(m/z=18), formed from the reaction (NH3+ D) on ammonia ice
deposited on the surface. In the same Figure 4b, the growth of the TPD peaks at 150 K with D exposure doses seems to be coherent with the decrease of the TPD peaks at 150 K in the Figure 4a. The desorption peaks at 150 K Figure 4b are likely to be attributed to NH2D formed from the reaction (NH3+ D)
on the surface of the oxidized HOPG. The maximum of these TPD peaks shifts toward lower temperatures with the increase of the peak height, and the NH2D coverage on the surface. This
means that the interaction of the clusters of NH3molecules with
D atoms leads to the formation of deuterated species NHD2,
NHD2, and ND3, desorbing into the gas phase at 96 K, as seen
in the TPD curves of Figure 4b, c, and d, respectively. While the successive deuteration of adsorbed NH3 on the oxidized
graphite surface, produces deuterated ammonia molecules des-orbing from the stronger binding sites of the surface at 150 K (see Figure 4b, c, and d).
The astrophysical group of Watanabe et al. [22] have demon-strated experimentally the efficient formation of the deuterated
isotopologue species of methanol at low surface temperature (10 K) by the D atoms exposure on CH3OH ice. The isotopic
species were observed and detected by infrared spectroscopy during the exposure of the adsorbates at 10 K. Similarly to methanol molecules, we believed that the deuteration reaction NH3+ D proceeds during the exposure phase of NH3 and D
atoms on the oxidized HOPG substrate at 10 K, thanks to the tunneling process. At 10 K, D atoms are mobile [39] and can diffuse on the surface to react with solid ammonia molecules. However, since in our experiments the deuterated species of ammonia are detected by TPD measurements from 10 K to 200 K, it is possible that the formation of the deuterated species of ammonia proceeds during the warming-up phase of the sam-ple, rather than during the exposure of the reactants on the sur-face at 10 K. This assumption for the deuteration of ammonia by D atoms at higher surface temperatures is not taken into ac-count in our experiments.
3.4. Kinetics of CH3OH+D reaction
In this section, we would like to compare the kinetic re-action NH3+ D to that of CH3OH + D molecules in the
sub-monolayer regime. We investigated similar deuteration experi-ments of solid CH3OH by D atoms as for ammonia molecules.
The experiments were performed under the same conditions: same low surface coverage (∼ 0.8 ML), same D atomic fluxϕ(D) = 3.7× 10¹²molecules· cm−2· s−1, and same surface
temperature (10 K). Firstly, we deposited 0.8 ML of solid CH3OH on the oxidized HOPG surface at 10 K, and then we
added 6.6 ML of D atoms for the first experiment, and 15.5 ML of D atoms for the second one. After the D-addition phase, each film of CH3OH + D was heated linearly from 10 K to
210 K using the same heating rate of 0.17 K·s−1. Figure 5 shows the TPD desorption curves of CH3OH (m/z=32), and the
newly formed isotopic species CH2DOH (m/z=33), CHD2OH
(m/z=34) and CD3OH (m/z=35) between 100 K and 200 K.
According to Nagaoka et al. [26] and Hiraoka et al. [40], the H-abstraction of CH3OH by D atoms is likely to occur in
the methyl −CH3group rather than the hydroxyl−OH group
of the CH3OH (m/z=32) molecules. We have thus attributed
the TPD signals of masses m/z=33, m/z=34 and m/z=35 in the Figure 5 to the newly formed deuterated species CH2DOH,
CHD2OH, and CD3OH, respectively, which are deuterated in
the methyl group. The formation of the deuterated species in the hydroxyl group, such as CH3OD (m/z=33), CH2DOD
(m/z=34), and CHD2OD (m/z=35), by the reaction system
(CH3OH + D) is expected to be negligible in this work.
How-ever, these deuterated methanol species in the hydroxyl group can be formed by D-H isotopic exchange between the species (CH3OH, CH2DOH, and CHD2OH) with the deuterated D2O
water ice contaminants, during the transition phase from the amorphous to the crystalline state of the water ice at 120 K [41].
4. Analysis
4.1. Rate equations of NH3+D system reactions
We suggested that the reaction between NH3and D atoms on
the oxidized graphite surface held at 10 K, proceeds through di-rect Hydrogen-Deuterium substitution process by H-abstraction and D-addition mechanism, as proposed by Nagaoka et al. [22, 42] for H2CO + D and CH3OH + D reactions. In fact, the
direct H-D substitution reaction (4) leading to the formation of NH2D species is slightly exothermic with a formation enthalpy
∆H0= -781.8 K.
NH3 + D−→ NH2D + H, (4)
In the case of the H-abstraction and D-addition mechanism of NH3, the indirect H-D substitution process is described by the
following reactions (5) and (6).
NH3 + D−→ NH2 + HD, (5)
NH2 + D−→ NH2D, (6)
The first H-atom abstraction reaction (5) of NH3 molecule
by D atom leads to the formation of HD molecule and the NH2
radical. This reaction is endothermic with a reaction enthalpy of∆H0=+1527.5 K, and needs an excess thermal energy to be produced. While the second D-addition reaction (6) leading to the formation of the first isotopologue NH2D is exothermic with
higher heat of formation∆H0= −54480 K. All the standard reaction enthalpies involving ammonia species and D atoms are provided by NIST database [38] .
The same endothermic behavior takes place in the H-abstraction reactions (7) and (9) of NH2D and NHD2species
by D atoms, respectively. NH2D + D−→ NHD + HD (∆H0= +1455.3 K) (7) NHD + D−→ NH2D (8) and NHD2+ D−→ ND2+ HD (∆H0= +1527.5 K) (9) ND2+ D−→ ND3 (10)
In order to fit the TPD experimental data of NH3, NH2D,
NHD2and ND3species, given in the Figure 7, we used a kinetic
model described by the following exothermic system reactions (11-13) for the three direct H-D substitution reactions.
NH3+ D p2 −→ NH2D + H (∆H0=−781.8 K) (11) NH2D + D p3 −→ NHD2+ H (∆H0=−938.1 K) (12) NHD2+ D p4 −→ −→ND3+ H (∆H0=−1131 K) (13)
These reactions are in competition with the exothermic D+D surface reaction leading to the formation of D2molecules.
100 120 140 160 180 200 0.8 ML CH 3 OH 0.8 ML CH 3 OH+6.6 ML (D) 0.8 ML CH 3 OH+15.5 ML (D) m/z=35 CD 3 OH Temperature (K) 100 120 140 160 180 200 0.8 ML CH 3 OH 0.8 ML CH 3 OH+6.6 ML (D) 0.8 ML CH 3 OH+15.5 ML(D) m/z=34 CHD 2 OH Temperature (K) 100 120 140 160 180 200 0 10 20 30 40 50 60 70 80 0.8 ML CH 3 OH 0.8 ML CH 3 OH+6.6 ML (D) 0.8 ML CH 3 OH+15.5 ML(D) Temperature (K) m/z=32 CH 3 OH C o u n t / s ) 100 120 140 160 180 200 0.8 ML CH 3 OH 0.8 ML CH 3 OH+6.6 ML (D) 0.8 ML CH 3 OH+15.5 ML(D) m/z=33 CH 2 DOH Temperature (K)
Figure 5: TPD curves of CH3OH (m/z=32), CH2DOH (m/z=33), CHD2OH (m/z=34) and CD3OH (m/z=35) between 100 K and 200 K. Black curve: 0.8 ML of
CH3OH ice pre-deposited on the oxidized graphite surface held at 10 K; Red curve: after the exposure of 6.6 ML of D atoms at 10 K on 0.8 ML of CH3OH ice;
Blue curve: after the exposure of 15.5 ML of D atoms at 10 K on 0.8 ML of CH3OH ice.
Our model includes both Eley-Rideal (ER) and Langmuir-Hinshelwood (LH) mechanisms for the reactions of D atom either with another D atom on the surface or with an ammo-nia species already adsorbed on the surface at 10 K. The Eley-Rideal mechanism occurs when one of the species already ad-sorbed on the surface promptly reacts with a particle coming from the gas phase, before being adsorbed on the surface. The Langmuir-Hinshelwood mechanism describes the formation of molecules on the surface when two adsorbed reaction-partners diffuse on the surface. D atoms are thermalized with the surface and they react with ammonia molecules thanks to surface diffu-sion. The ER mechanism is independent of the temperature of the surface Ts, while LH mechanism is very sensitive to Tssince
it depends on diffusion coefficients. Moreover, LH is more ef-ficient than ER mechanism at low surface coverage [43]. In our experiment, a D atom coming from the gas phase can hit an am-monia species already adsorbed on the surface, react and form a newly isotopic species of ammonia through ER mechanism. If the adsorbed D atom does not react through ER mechanism, it can diffuse on the surface from one site to a neighboring one. The diffused D atom can react either with another D atom on the surface to form D2molecule, or with an adsorbed NH3, NH2D
or NHD2molecules to form NHD2, NH2D, or ND3species,
re-spectively, through the LH mechanism. All species, except D atoms, are not mobile on the surface at 10 K.
4.1.1. Kinetic model
The model used to fit our experimental data is very similar to the one described by Minissale et al. [43, 44]. It is com-posed of six differential equations, one for each of the species considered: D atoms, coming exclusively from the beam; NH3
molecules, deposited on the surface; NH2D, NHD2, and ND3,
formed on the surface; and finally D2, coming both from the
beam and formed on the surface. Each differential equation is composed of positive and negative terms, indicating respec-tively an increase (i.e. species arriving from the gas phase or formed on the surface), or a decrease (i.e. species reacting on the surface) in the surface coverage of the species. The terms involving the ER and LH mechanisms are independent
of one another, thus we are able to determine the amount of a species formed (or consumed) via ER or LH mechanism. Be-low, we present the list of differential equations governing the NH3deuteration: d[D] dt =ϕD ( 1− 2p1ER[D]− p2ER[NH3]− p3ER[NH2D]− p4ER[NHD2] ) − kdiff ( 4p1LH[D][D] + p2LH[D][NH3]+ p3LH[D][NH2D] + p4LH[D][NHD2] ) (15) d[D2] dt =ϕD2+ 2ϕD(1− e1)p1ER[D]+ 2(1− e1)kdiff· p1LH[D][D] (16) d[NH3] dt =−ϕDp2ER[NH3]− kdiff· p2LH[D][NH3] (17) d[NH2D] dt =ϕD ( p2ER[NH3]− p3ER[NH2D] ) + kdiff ( p2LH[D][NH3]− p3LH[D][NH2D] ) (18) d[NHD2] dt =ϕD ( p3ER[NH2D]− p4ER[NHD2] ) + kdiff ( p3LH[D][NH2D]− p4LH[D][NHD2] ) (19) d[ND3] dt =ϕD· p4ER[NHD2] + kdiff· p4LH[D][NHD2] (20)
The [D], [D2], [NH3], [NH2D], [NHD2], and [ND3]
quan-tities are the surface coverages of species. [X] is dimension-less and represents the percentage of surface covered with the X species. For each species [X] ranging between 0 and 1. This condition is true for all species except for D2, whose
surface coverage can be bigger than one. We stress that it does not represent a problem to evaluate activation barrier, since D2 is an inert species and does not have any effect on
kinetics of reactions. The initial reaction conditions at t=0 simulate the experimental conditions: [NH3](t = 0)= 0.8 and
[NH2D] = [NHD2] = [ND3] = 0 for t=0. Furthermore, we
im-pose that at any time:
[NH3](t) + [NH2D](t) + [NHD2](t) + [ND3](t)
= [NH3](t = 0) (21)
Dimensionless surface coverage is then converted in ML (or molecule· cm−2) by multiplying [X] for the amount of adsorp-tion sites of our surface (1015sites· cm−2) and compared with experimental results. ϕXrepresents the part of surface covered
per second by the X species coming from the gas phase. We know that in our experimental conditions the total number den-sity of the impinging D-atoms coming from the gas phase and hitting the surface is given by the flux of D atoms in the beam-line: ϕD= 3.7× 10¹²atoms· cm−2· s−1. If we consider again
that a surface contains 1015 sites· cm−2, the flux of D atoms landing the surface isϕD=3.7× 10⁻³s−1.
The terms concerning the chemical desorption of ammonia species NH2D, NHD2, and ND3 (formed by the reaction with
D atoms) are not considered in the model, since the thermal desorption of these considered species is negligible at 10 K. Despite the various heats of formation of NH3 isotopologues
(∆H less than 1100 K), no desorption of the newly formed am-monia species has been observed experimentally at 10 K from the graphite surface. This is because the local heats of forma-tion of these species through the exothermic reacforma-tions (11-13) do not exceed the desorption energy of these ammonia species (Edes=2300 K) [45]. So once the isotopologue ammonia species
are formed, they stay in the solid phase on the graphite sur-face at 10 K, because their binding energy of about 2300 K is higher than the excess energies of formation. The non chemi-cal desorption of the corresponding molecules at 10 K is also confirmed experimentally by using the DED (During Exposure Desorption) method [46], which consists of monitoring with the QMS placed in front of the sample, the signal of the deuter-ated molecules released into the gas phase during the deposition phase. However, the parameter e1 characterizing the prompt
desorption of some D2molecules, upon formation on the
sur-face at 10 K, through the very exothermic reaction (14), is ex-pected to be non negligible. We point out that this term e1does
not influence ammonia species surface coverage. In fact, as we have already said D2is a non-reactive species and it cannot
consume neither D atoms nor NHxDyspecies on the surface.
However, it has been demonstrated by Amiaud et al. [27] that the presence of D2molecules already adsorbed on the water ice
increases the recombination efficiency of D atoms through the barrierless D + D−→D2reaction, by increasing the sticking
co-efficient of the deuterium atoms on the surface. This behaviour may have an important impact in the deuteration experiments, since the presence of condensed inert D2species may separate
D and NH3, resulting in the decrease of the recombination
effi-ciency of D atoms with adsorbed NH3, and the reduction of the
H-D substitution reaction.
p1ERand p1LH parameters are the reaction probabilities
(di-mensionless) of the D+D surface reaction (14), and we fixed to one their values. Similarly, p2ER, p3ER, p4ER, and p2LH, p3LH
and p4LHparameters represent the probabilities of the reactions
(11-13) to be occurred via ER and LH mechanisms, respec-tively. Ammonia and D atoms species can react together by overcoming the activation barrier (Arrhenius term), or by cross-ing the barrier (tunnelcross-ing term) as expressed by the followcross-ing equations (22) and (23):
piER= e−Eai/(kB×Teff)+ e−2 Zr×
√ 2µ×Eai×kB/h (22) and piLH= e−Eai/(kB×Ts)+ e−2 Zr× √ 2µ×Eai×kB/h (23)
Where kB is the Boltzmann constant, h the Planck constant,
Eai (i=2-4) are the activation energy barriers of the reactions
(11-13), Zris the width of the (rectangular) activation barrier,
andµis the tunneling mass which is described by the reduced mass of the system involved in bi-molecular atom transfer reac-tion. This tunneling mass is defined as:
µ=mNHxDy× mD mNHxDy+ mD
, with x,y=0-3 and x+y=3 (24)
Teff is the effective temperature of the reaction between NH3,
NH2D, NHD2and D atoms given by:
Teff=µ( Tsolid mNH3 +Tgas mD ) = 314 K (25) Ts(=10 K) is the surface temperature. The parameter kdiffis the
diffusion coefficient of D atoms between sites on the surface. It represents the amount of surface sites scanned in one second by D atoms. It is defined by the following equation (26)
kdiff=ν ( e−Ediff/kB×Ts+ e−2 Zd× √ 2µ×Edi f f×kB/h ) (26)
Whereν= 1012s−1is the attempt frequency for overcoming the diffusion barrier of D atoms and Ediffis the energy barrier
for the diffusion of D atoms on cold surfaces held at 10 K. Bon-fant et al. [47] have reported an extremely low diffusion barriers of 4 meV for hydrogen atoms on graphite surface, meaning that hydrogen atoms physisorbed on graphite is highly mobile at low surface temperatures. However, for irregular surfaces such as ASW, the diffusion energy barrier of D atoms does not have a single value but follows a distribution, because there are several potential sites of different depths. Since our substrate used in our experiments is composed of an oxidized HOPG mixed with ASW ice deposits, the diffusion energy value of D atoms used in this model is that estimated on ASW ice for low surface cov-erage, Ediff= (22± 2) meV or (255 ± 22) K [39]. Even if this
diffusion energy is different from that calculated on graphite surface, its high value does not affect the modeling results. The parameter Zdis the width of the (rectangular) diffusion barrier.
We have fixed the width of the diffusion barrier of D atoms (Zd) to 1 Å, a value commonly used to describe H or D atoms
diffusion on the surface. In our kinetic model, the term of the tunneling probability e−2 Zr
√
2µ EaikB/h for crossing the
rect-angular activation barrier depends on the tunneling mass of the reaction. This tunneling mass is described by the reduced mass
µof the system involving ammonia species NHxDyand D atom
with x,y=0-3 and x+y=3. The value ofµfor each reaction sys-tem is equal to 1.8 amu, and is close to the mass of the deu-terium particle D (m/z=2 amu). This means that for direct D-H exchange reaction between D atom and ND-H3molecules, the
D atom is considered to be the tunneling particle that conduct the system NH3+ D to across the rectangular barrier through
quantum tunneling. According to Hidaka et al. [48], the tunnel-ing mass significantly depends on the reaction mechanism. For the addition reaction (AX + B → AXB), the tunneling mass in the reaction coordinate is simply described by the reduced mass of the two-body system. However, for the abstraction re-action (AX + B → A + BX), which involves three free parti-cles in the reaction system, the tunneling mass is described by the effective mass, defined in the papers of Hidaka et al. [48]. For the direct H-D exchange reaction (11) between NH3and D
atoms, the description of the tunneling mass is not straightfor-ward according to the reference [48]. However, if we assume that the H-D substitution reaction (11) occurs via an interme-diate NH3D, having a tetrahedral geometry as demonstrated by
ab-initio calculations [25], we can thus apply the reduced mass
µto describe the tunneling mass of the addition (27) reaction.
NH3+ D−→NH3D, (27)
4.1.2. Activation energy barriers of the reactions
In our kinetic model, we have four free parameters: the acti-vation barriers (Ea2, Ea3, Ea4) for reaction (reaction barrier) and
the width of the reaction barrier Zr. This last can be constrained
between 0.7 and 0.9 Å. Actually, solid-state chemistry at low temperatures should be dominated by quantum tunneling, ac-cording to Harmony [49] and Goldanskii [50]. In particular, H-abstraction and D-substitution should be ruled by tunneling, as shown by Goumans et al. [51] in the case of CH3OH
deuter-ation. The reaction NH3+ D has been studied experimentally
very long time ago in the gas phase by Kurylo et al. [24] over the temperature range 423-741 K. These authors found that the H-D exchange between NH3and D may proceed through an
in-termediate NH3D following the reaction NH3+ D→ [NH3D]
→ NH2D + H. As mentioned previously, the NH3+ D system
reaction has been also studied theoretically [25] using ab-initio interpolated potential energy surface calculations. In both pa-pers [25, 24], the activation barrier of the H-D exchange reac-tion (11) is reported to be Ea= 11 kcal/mol or 5540 K.
How-ever, some works (i.e. Bell [52] and references therein, Chapter 6: Tunneling in molecular spectra, the inversion of ammonia and related processes, page 153) argue that in the case of ammo-nia inversion, tunneling should be the dominant process, with
a typical width of the reaction barrier (Zr) is 0.7-0.8 Å. This
reaction is considered the prototype of processes involving tun-neling in a symmetrical (or quasi-symmetrical) potential energy curve. To the best of our knowledges no experimental and theo-retical works have deal with the width of ammonia deuteration barrier. Thus we have used a value for width of deuteration sim-ilar to that of ammonia inversion, aware that the two reactions involve not identical chemical processes. For the sake of sim-plicity, we have used a common Zrvalue for the deuteration
re-actions (11-13), instead of a value for each reaction. We suggest that tunneling is necessary for ammonia deuteration (in analogy with methanol deuteration). For this reason we use quantum tunneling in our model but we point out that our simple formu-lation of tunneling is useful only for a qualitative evaluation of our experimental results. Quantum tunneling refers to the quan-tum mechanical phenomenon where a particle tunnels through a barrier that it classically could not surmount. Quantum tunnel-ing is known to be an important process for molecular synthesis on interstellar grains at very low temperatures [53]. A detailed description of tunneling falls outside the scope of this work.
Figure 6 shows the surface densities of NH3, NH2D, NHD2
and ND3 species as a function of D atoms Fluences. These
surface densities, expressed in fraction of monolayer (ML) are the normalized integrated areas below the TPD curves of NH3,
NH2D, NHD2and ND3peaked at 97 K for each D atom
flu-ence, with respect to the TPD integrated area of NH3 for one
monolayer coverage. As previously explained in the section 3.3, we assumed that all the deuterated ammonia species are ionized by electron impact in the ion source of the QMS dur-ing the TPD experiments. However, it has been reported by Rejoub et al. [54] that the ionization cross-section of light NH3molecules is twice larger than that of ND3, meaning that
the cross-sections for formation of ion fragments from heavy deuterated molecules, are much smaller than those from NH3.
Because we neglected the contribution of the cracking patterns in the TPD experiments, we did not considered the different ionization cross-section values of the deuterated species in the measurements of the areas from TPD profiles. As shown in the Figure 6, there is a good correlation between the experi-mental data and the fits obtained by the model for the expo-nential decay of NH3, and the growth of NH2D, NHD2 and
ND3 species on the surface when increasing the amount of D
atoms on the surface. The plots of the Figure 6 show that for the higher D-irradiation time of 240 minutes, and the higher D-fluence of 5.34× 10¹⁶atoms· cm−2, about 20 % of the ad-sorbed NH3molecules are mainly deuterated into NH2D and
NHD2species with traces of ND3. The formation yields of the
single, the double and the triple deuterated ammonia species are approximately (14 %), (5 %), and (1 %), respectively.
Thanks to our model, we have tested different scenario: we used three values (150 K, 250 K, 350 K) for the diffu-sion barrier Ediff of D atoms, and for each value, we have
varied Zr from 0.7 to 0.9 Å (step of 0.01 Å). In the case
of Ediff= 250 K, the activation energy barriers of the
suc-cessive H-D substitution reactions of ammonia species by D atoms are found to be Ea2= (1840± 270) K for the
D-atoms exposure time (min) NH 3 NH 2 D NHD 2 ND 3 m/z=17 m/z=18 m/z=19 m/z=20 S u r f a ce d e n si t y ( M L ) 0 40 80 120 160 200 240 0,00 1,07 2,14 3,21 4,28 5,35 D atoms-Fluence (10 16 atoms cm -2 )
Figure 6: Kinetic evolutions of NH3, NH2D, NHD2, and ND3species present
on the surface as a function of D atoms exposure doses, and D fluences on 0.8 ML coverage of solid ammonia already deposited on the oxidized graphite substrate at 10 K. Black squares, red circles, blue triangles, green diamonds are the TPD experimental data of NH3, NH2D, NHD2, and ND3, respectively.
Solid lines are the fits obtained from the model. The uncertainties are given by the errors bars.
= (1670± 230) K for the reaction (13). In the Table 2, we list the width and the energy activation barrier for the H-D substi-tution reactions of NH2D, NHD2and ND3species. The listed
values of the activation energies Eai minimize theχ2value of
our fit with respect to our experimental data. The statistical pa-rameterχ2is obtained for each set of parameters by using the following formula:
χ2=Σ
ML,mol[St(ML, mol)− Se(ML, mol)]2/Se(ML, mol)
(28) Where St(ML, mol) and Se(ML, mol) are respectively the
theo-retical and experimental surface density for each molecule at a certain D-fluence.
In order to have a good correlation between the model and the experiments, Figure 7 shows how we can minimize theχ2value by setting a couple of activation energies values (Ea2, Ea3) for
the deuteration reactions (11) and (12) and varying only the value of the third energy Ea4 for the reaction (13). Our
acti-vation energy barriers for the direct H-D substitution reactions (11-13) between ammonia species and D atoms (see Table 2) are smaller than the activation energy barrier Ea= 5540 K
re-ported by the two references [24, 25], both in gas and solid phases. The low values of the activation energies obtained in this work can be explained by the catalytic effect of the ASW ice + oxidized HOPG on the deuteration reaction NH3+ D.
This substrate favors the diffusion of D atoms, and increases therefore the reactivity between NH3 molecules and D atoms
on the surface.
As shown in the Table 2, the width Zr and the energy of
the activation barriers Ea depend on the diffusion energy of D
atoms on the surface Ediff. One can note that the higher the
diffusion energy (Ediff) of D atoms, the lower the width (Zr)
of the energy barriers. The diffusion of D atoms on the cold surface increases the probability of the H-D substitution reac-tions of ammonia in the solid phase. Table 2 also shows that for each Ediff, the value of the activation energy barrier is
al-Figure 7: The curves minimizing theχ2value between the kinetic model and the experimental measurements for the reaction between NH3and D atoms, by
setting a couple of activation energies barriers (Ea2, Ea3) for the deuteration
reactions (11) and (12) and varying the value of third one (Ea4) for the
reac-tion (13). Ediffand Zrare respectively 250 K and 0.83 Å.
Table 2: The width Zrand the height of the energy barriers Ea, expressed in (Å) and in kelvin (K), respectively, of the successive H-D substitution reactions of NH3molecules by D atoms on the oxidized, partly ASW covered graphite
sur-face at 10 K, for a fixed value of D-atom diffusion energy Ediff. The minimum
χ2value of the fits is found to vary between 0.3 and 0.1.
Reactions Ediff Zr Ea units K Å K NH3+D p2 −→ NH2D+H 150 0.86 1950± 250 250 0.83 1840± 270 350 0.81 1750± 320 NH2D+D p3 −→ NHD2+H 150 0.86 1820± 220 250 0.83 1690± 245 350 0.81 1610± 290 NHD2+D p4 −→ ND3+H 150 0.86 1800± 210 250 0.83 1670± 230 350 0.81 1600± 250
ways high for the first deuteration reaction NH3+ D, and then
decreases by almost 10 % for the second NH2D + D and the
third NHD2+ D deuteration reactions. Our activation energy
barriers for the deuteration reaction NH3+ D in the solid phase
is much lower than the value (46 kJ· mol−1) given in the gas phase [25, 24]. This large difference can be explained by the catalytic effect of substrate composed of oxidized graphite and ASW ices deposits.
4.2. Rate equations of CH3OH + D system reactions
As has been suggested by Nagaoka et al. [26], the deuteration of CH3OH, CH2DOH and CH2DOH species by D atoms on
cold surfaces, occur through the successive H abstraction and D addition mechanism as follows:
CH3OH + D−→ CH2OH + HD (29)
CH2OH + D−→ CH2DOH (30)
CHDOH + D−→ CHD2OH (32)
CHD2OH + D−→ CD2OH + HD (33)
CD2OH + D−→ CD3OH (34)
Where the H-abstraction reactions (29, 31 and 33) are exothermic with small activation barriers in comparison to the direct H-D substitution reactions. While the D-addition reactions (30, 32 and 34) are exothermic with no barriers. In Hama et all’s review [2], the direct H-D substitution reaction CH3OH + D −→ CH2DOH + H has
a very large activation energy barrier of 169 kJ/mol (or 20330 K), in comparison to the following H-abstraction reac-tion CH3OH + D−→ CH2OH + HD, which has an activation
energy of 34 kJ· mol−1(or 4090 K), estimated from gas phase calculations.
In this work, the successive deuteration reactions of methanol species by D atoms are described by the following simple reac-tions (35-37). CH3OH + D p′2 −→ ...−→CH2DOH (35) CH2DOH + D p′3 −→ ...−→CHD2OH (36) CH2DOH + D p′4 −→ ...−→CD3OH (37)
Where p′2, p′3and p′4 parameters are the reaction probabili-ties of the H-abstraction reactions (29, 31 and 33) of CH3OH,
CH2DOH and CH2DOH by D atoms, respectively. Using the
same kinetic model previously described for NH3+ D system
reactions in solid phase, we have estimated the activation en-ergy barriers of the H-abstraction reactions (29, 31 and 33) for CH3OH + D system reactions. Table 3 summarizes the
val-ues of the width Zr and the activation energy barriers Ea for
each H-D substitution reaction of methanol species. Our kinetic model provides an activation energy barrier Ea=(1080± 180) K
or (8.9 ± 1.5) kJ · mol−1 for the first abstraction reaction (CH3OH + D) given by the equation (29) with Ediff= 250 K.
This value is more than a factor of four smaller than the ac-tivation energy value (34 kJ· mol−1 or 4090 K), reported by [2] from theoretical estimations in the gas phase. Once again the catalytic role of the surface can explain the difference be-tween gas phase and solid phase activation barriers. The ac-tivation energy barriers of the successive deuteration reactions of methanol species decease significantly with the increase of the diffusion energy Ediffof D atoms on the surface. Nerveless,
the values of the activation energy barriers for CH3OH + D
sys-tem reactions (see Table 3) are always smaller than those of the NH3+ D system reactions (see Table 2).
Figure 8 shows the best fit of the data for the exponen-tial decay of CH3OH, and the increase of the surface
densi-ties of CH2DOH, CHD2OH and CD3OH with the increasing
time and fluence of D atoms exposure on 0.8 ML of solid methanol CH3OH pre-deposited on the oxidized HOPG
sur-face. We can note that after 70 minutes of D atoms addi-tion, about 0.44 ML of the adsorbed CH3OH molecules, are
deuterated into three isotopologue species, with the formation yields of (∼ 22 %) for CH2DOH, (∼ 15 %) for CHD2OH,
Table 3: The width Zrand the height of the energy barriers Ea, expressed in (Å) and in kelvin (K), respectively, of the successive H-D substitution reactions of CH3OH molecules by D atoms on the oxidized, partly ASW covered graphite
surface at 10 K, for a fixed value of D-atom diffusion energy Ediff. Theχ2value
of the fit vary between 0.3 and 0.1.
Reactions Ediff Zr Ea units K Å K CH3OH+D p′2 −→ CH2DOH+H 150 0.86 1450± 210 250 0.85 1080± 180 350 0.84 860± 120 CH2DOH+D p′3 −→ CHD2OH+H 150 0.86 1330± 200 250 0.85 990± 180 350 0.84 770± 145 CHD2OH+D p′4 −→ CD3OH+H 150 0.86 1300± 205 250 0.85 980± 170 350 0.84 780± 150
and (∼ 8 %) for CD3OH. The comparison with the
previ-ous kinetic results given in the Figure 7, shows that when 0.8 ML of solid NH3is irradiated with D atoms during the same
exposure time of 70 minutes, only 10 % of NH3 molecules
are deuterated into NH2D (∼ 8 %) with traces of NHD2 (∼
2 %) and NHD3 (< 1 %). This means that during 70
min-utes of D atoms exposure phase, 0.44 ML (or 55 %) of ad-sorbed CH3OH molecules are consumed by D atoms, while
only 0.08 ML (or 10 %) of solid ammonia can be destruc-ted by D atoms. We defined the deuteration rateυX=d[X]dt of
an adsorbed species X by D atoms, as the amount [X] of this species (in molecules·cm−2), consumed per unit time (in min) of D atoms exposed on the surface. The deuteration rate value of CH3OH is estimated toυCH3OH w 0.005 × 10¹⁵ molecules
·cm−2· min−1, while that of NH
3species is found to beυNH3
w 0.001 × 10¹⁵ molecules· cm−2· min−1, and can slightly
de-crease for extended irradiation up to 240 minutes. The relation-ship between the two deuteration rates is υCH3OH
υNH3 ≃ 5, meaning
that the deuteration rate of CH3OH molecules by D atoms on
cold and oxidized graphite HOPG surfaces with ASW ice de-posits, is five times higher than of NH3.
5. Discussion and conclusions
In this work, we demonstrated experimentally the possible deuteration of NH3 molecules by D atoms on cold oxidized
HOPG surface, partly covered with ASW ices. The deuteration experiments of solid ammonia were performed at low surface coverage and low temperature 10 K using mass spectroscopy and temperature programmed desorption (TPD). The isotopo-logue ammonia species NH2D, NHD2and ND3desorbing from
the surface at 96 K and 150 K are likely to be formed by direct exothermic H-D substitution reactions between the adsorbed ammonia species on the surface and the impinging D atoms. A kinetic model taking into account the diffusion of D atoms on the surface provides the activation energy barriers of the deuter-ation reactions (NH3+ D) in the solid phase. We found that