CERN-EP-2017-222 29 August 2017
c
2017 CERN for the benefit of the ALICE Collaboration.
Reproduction of this article or parts of it is allowed as specified in the CC-BY-4.0 license.
The ALICE Transition Radiation Detector:
construction, operation, and performance
ALICE Collaboration∗
Abstract
The Transition Radiation Detector (TRD) was designed and built to enhance the capabilities of the ALICE detector at the Large Hadron Collider (LHC). While aimed at providing electron identifica-tion and triggering, the TRD also contributes significantly to the track reconstrucidentifica-tion and calibraidentifica-tion in the central barrel of ALICE. In this paper the design, construction, operation, and performance of this detector are discussed. A pion rejection factor of up to 410 is achieved at a momentum of 1 GeV/c in p–Pb collisions and the resolution at high transverse momentum improves by about 40% when including the TRD information in track reconstruction. The triggering capability is demon-strated both for jet, light nuclei, and electron selection.
∗See Appendix A for the list of collaboration members
1 Introduction
A Large Ion Collider Experiment (ALICE) [1, 2] is the dedicated heavy-ion experiment at the Large Hadron Collider (LHC) at CERN. In central high energy nucleus–nucleus collisions a high-density de-confined state of strongly interacting matter, known as quark–gluon plasma (QGP), is supposed to be created [3–5]. ALICE is designed to measure a large set of observables in order to study the properties of the QGP. Among the essential probes there are several involving electrons, which originate, e.g. from open heavy-flavour hadron decays, virtual photons, and Drell-Yan production as well as from decays of the ψ and ϒ families. The identification of these rare probes requires excellent electron identification, also in the high multiplicity environment of heavy-ion collisions. In addition, the rare probes need to be enhanced with triggers, in order to accumulate the statistics necessary for differential studies. The latter requirement concerns not only probes involving the production of electrons, but also rare high transverse momentum probes such as jets (collimated sprays of particles) with and without heavy flavour. The ALICE Transition Radiation Detector (TRD) fulfils these two tasks and thus extends the physics reach of ALICE.
Transition radiation (TR), predicted in 1946 by Ginzburg and Frank [6], occurs when a particle crosses the boundary between two media with different dielectric constants. For highly relativistic particles (γ & 1000), the emitted radiation extends into the X-ray domain for a typical choice of radiator [7–9]. The radiation is extremely forward peaked relative to the particle direction [7]. As the TR photon yield per boundary crossing is of the order of the fine structure constant (α= 1/137), many boundaries are needed in detectors to increase the radiation yield [10]. The absorption of the emitted X-ray photons in high-Z gas detectors leads to a large energy deposition compared to the specific energy loss by ionisation of the traversing particle.
Since their development in the 1970s, transition radiation detectors have proven to be powerful devices in cosmic-ray, astroparticle and accelerator experiments [10–20]. The main purpose of the transition ra-diation detectors in these experiments was the discrimination of electrons from hadrons via, e.g. cluster counting or total charge/energy analysis methods. In a few cases they provided charged-particle track-ing. The transition radiation photons are in most cases detected either by straw tubes or by multiwire proportional chambers (MWPC). In some experiments [10, 13, 16, 21] and in test setups [22–25], short drift chambers (usually about 1 cm) were employed for the detection. Detailed reviews on the transition radiation phenomenon, detectors, and their application to particle identification can be found in [10, 26– 28].
The ALICE TRD, which covers the full azimuth and the pseudorapidity range −0.84 < η < 0.84 (see next section), is part of the ALICE central barrel. The TRD consists of 522 chambers arranged in 6 layers at a radial distance from 2.90 m to 3.68 m from the beam axis. Each chamber comprises a foam/fibre radiator followed by a Xe-CO2-filled MWPC preceded by a drift region of 3 cm. The extracted temporal information represents the depth in the drift volume at which the ionisation signal was produced and thus allows the contributions of the TR photon and the specific ionisation energy loss of the charged particle dE/dx to be separated. The former is preferentially absorbed at the entrance of the chamber and the latter distributed uniformly along the track. Electrons can be distinguished from other charged particles by producing TR and having a higher dE/dx due to the relativistic rise of the ionisation energy loss. The usage of the temporal information further enhances the electron-hadron separation power. Due to the fast read-out and online reconstruction of its signals, the TRD has also been successfully used to trigger on electrons with high transverse momenta and jets (3 or more high-pT tracks). Last but not least, the TRD improves the overall momentum resolution of the ALICE central barrel by providing additional space points at large radii for tracking, and tracks anchored by the TRD will be a key element to correct space charge distortions expected in the ALICE TPC in LHC Run 3 [29]. A first version of the correction algorithm is already in use for Run 2.
Fig. 1: Schematic cross-section of the ALICE detector perpendicular to the LHC beam direction (status of the detector since the start of LHC Run 2). The central barrel detectors cover the pseudorapidity range |η|. 0.9 and are located inside the solenoid magnet, which provides a magnetic field with strength B = 0.5 T along the beam direction.
In this article the design, construction, operation, and performance of the ALICE TRD is described. Sec-tion 2 gives an overview of the detector and its construcSec-tion. The gas system is detailed in SecSec-tion 3. The services required for the detector are outlined in Section 4. In Section 5 the read-out of the detector is discussed and the Detector Control System (DCS) used for reliable operation and monitoring of the detector is presented in Section 6. The detector commissioning and its operation are discussed in Sec-tion 7. Tracking, alignment, and calibraSec-tion are described in detail in SecSec-tions 8, 9, and 10, while various methods for charged hadron and electron identification are presented in Section 11. The use of the TRD trigger system for jets, electrons, heavy-nuclei, and cosmic-ray muons is described in Section 12.
2 Detector overview
A cross-section of the central part of the ALICE detector [1, 2], installed at Interaction Point 2 (IP2) of the LHC, is shown in Fig. 1. The central barrel detectors cover the pseudorapidity range |η|. 0.9 and are located inside a solenoid magnet, which produces a magnetic field of B = 0.5 T along the beam direction. The Inner Tracking System (ITS) [30], placed closest to the nominal interaction point, is em-ployed for low momentum tracking, particle identification (PID), and primary and secondary vertexing. The Time Projection Chamber (TPC) [31], which is surrounded by the TRD, is used for tracking and PID. The Time-Of-Flight detector (TOF) [32] is placed outside the TRD and provides charged hadron identification. The ElectroMagnetic Calorimeter (EMCal) [33], the PHOton Spectrometer (PHOS) [34], and the High Momentum Particle Identification Detector (HMPID) [35] are used for electron, jet, pho-ton and hadron identification. Their azimuthal coverage is shown in Fig. 1. Not visible in the figure are the V0 and T0 detectors [36, 37], as well as the Zero Degree Calorimeters (ZDC) [38], which are placed at small angles on both sides of the interaction region. These detectors can be employed, e.g. to define a minimum-bias trigger, to determine the event time, the centrality and event plane of a col-lision [2, 39, 40]. Likewise, the muon spectrometer [41, 42] is outside the view on one side of the experiment, only, covering −4< η < −2.5.
Figure 1 also shows the definition of the global ALICE coordinate system, which is a Cartesian system with its point of origin at the nominal interaction point (xlab, ylab, zlab = 0); the xlab-axis pointing
in-3.8 4 4.2 4.4 4.6 4.8 5 5.2 5.4 5.6 5.8 6 6.2 0.2 0.4 0.6 0.8 1 1.2 1.4 1.6 1.8 2 2.2 2.4 2.6 2.8 3 3.2 3.4 3.6
Electron drift lines from a wire
x-Axis [cm] y-Axis [ cm ] Cell: TRD DC Gas: Xe 85%, CO2 15%, T=300 K, p=1 atm z x drift electrode cathode wires anode wires cathode pads amplification region 0.7 cm drift region 3.0 cm radiator 4.7 cm pion electron
Fig. 2: Schematic cross-section of a TRD chamber in the x-z plane (perpendicular to the wires) with tracks of a pion and an electron to illustrate the ionisation energy deposition and the TR contribution. The large energy deposition due to the TR photon absorption is indicated by the large red circle in the drift region. The drift lines (solid lines) are calculated with Garfield [43] and correspond to the nominal voltage settings for chamber operation. The radiator is not drawn to scale.
wards radially to the centre of the LHC ring and the zlab-axis coinciding with the direction of one beam and pointing in direction opposite to the muon spectrometer. According to the (anti-)clock-wise beam directions, the muon spectrometer side is also called C-side, the opposite side A-side.
The design of the TRD is a result of the requirements and constraints discussed in the Technical Design Report [44]. It has a modular structure and its basic component is a multiwire proportional chamber (MWPC). Each chamber is preceded by a drift region to allow for the reconstruction of a local track segment, which is required for matching of TRD information with tracks reconstructed with ITS and TPC at high multiplicities. TR photons are produced in a radiator mounted in front of the drift section and then absorbed in a xenon-based gas mixture. A schematic cross-section of a chamber and its radiator is shown in Fig. 2. The shown local coordinate system is a right-handed orthogonal Cartesian system, similar to the global coordinate system, rotated such that the x-axis is perpendicular to the chamber. Six layers of chambers are installed to enhance the pion rejection power. An eighteen-fold segmentation in azimuth (ϕ), with each segment called ‘sector’, was chosen to match that of the TPC read-out chambers. In the longitudinal direction (zlab), i.e. along the beam direction, the coverage is split into five stacks, resulting in a manageable chamber size. The five stacks are numbered from 0 to 4, where stack 4 is at the C-side and stack 0 at the A-side. Layer 0 is closest, layer 5 farthest away from the collision point in the radial direction. In each sector, 30 read-out chambers (arranged in 6 layers and 5 stacks) are combined in a mechanical casing, called a ‘supermodule’ (see Fig. 3 and Section 2.3).
In total the TRD can host 540 read-out chambers (18 sectors × 6 layers × 5 stacks), however in order to minimise the material in front of the PHOS detector in three sectors (sectors 13–15, for numbering see Fig. 1) the chambers in the middle stack were not installed. This results in a system of 522 individual read-out chambers. The main parameters of the detector are summarised in Table 1.
At the start of the first LHC period (Run 1) in 2009 the TRD participated with seven supermodules. Six further supermodules were built and integrated into the experiment during short winter shutdown periods of the accelerator, three in each winter shutdown period of 2010 and 2011. The TRD was completed
Stack 0 Stack 1 Stack 2 Stack 3 Stack 4 Layer 5 Layer 0 Zlab, η 1 m A-side C-side
Fig. 3: Cross-section (longitudinal view) of a supermodule.
Parameter Value Pseudorapidity coverage −0.84 < η < +0.84 Azimuthal coverage ϕ 360◦ Radial position 2.90 m to 3.68 m Length of a supermodule 7.02 m Weight of a supermodule 1.65 t Segmentation in ϕ 18 sectors
Segmentation in zlab 5 stacks
Segmentation in r 6 layers
Total number of read-out chambers 522
Size of a read-out chamber (active area) 0.90 m × 1.06 m to 1.13 m × 1.43 m
Radiator material fibre/foam sandwich
Depth of radiator 4.7 cm
Depth of drift region 3.0 cm
Depth of amplification region 0.7 cm
Number of time bins (100 ns) 30 (22–24)
Total number of read-out pads 1 150 848
Total active area 673.4 m2
Detector gas Xe-CO2(85-15)
Gas volume 27 m3
Drift voltage (nominal) ∼2150 V
Anode voltage (nominal) ∼1520 V
Gas gain (nominal) ∼3200
Drift field ∼700 V/cm
Drift velocity ∼1.56 cm/µs
Avg. radiation length along r hX/X0i 24.7%
Table 1: General parameters of the TRD. The indicated weight corresponds to a supermodule with 30 read-out chambers; the length of the supermodule does not include the connected services. At maximum 30 time bins can be read out, typical values used in Run 1 and Run 2 are 22–24 (see Section 5.2).
coverage in azimuth was accomplished for the second LHC period (Run 2) starting in 2015. 2.1 Read-out chambers
The size of the read-out chambers changes radially and along the beam direction (see Fig. 3). The active area per chamber thus varies from 0.90 m × 1.06 m to 1.13 m × 1.43 m (x × z). The optimal design of a read-out chamber (see Fig. 2) was found considering the requirements on precision and mechanical stability, and minimisation of the amount of material.
The construction of the radiator, discussed in the following sub-section, is essential for the mechanical stability of the chamber. The drift electrode, an aluminised mylar foil (25 µm thick), is an integral part of the radiator. To ensure a uniform drift field throughout the entire drift volume, a field cage with a voltage divider chain is employed [44]. The current at nominal drift voltage is about 170 µA. The grounded cath-ode wires are made of Cu-Be and have a diameter of 75 µm, while the ancath-ode wires are made of Au-plated tungsten with a diameter of 20 µm. The pitch for the cathode and anode wires are 2.5 mm and 5 mm, re-spectively; the tensions at winding were 1 N and 0.45 N [45]. The wire lengths vary from 1.08 m to
pads pad rows α = 2o y z 85 mm 7.25 mm z0
Fig. 4: Pad geometry of a TRD read-out chamber in layer 3 (not stack 2). The pad tilt is ± 2◦with respect to the z-axis (along the beam direction), with the sign alternating between layers.
1.45 m. The maximum deformation of the chamber frame was 150 µm under the wire tension indicated, leading to a maximum 10% loss in wire tension. Even with an additional 1 mbar overpressure in the gas volume (see Section 3), the deformation of the drift electrode can be kept within the specification of less than 1 mm. The segmented cathode pad plane is manufactured from thin Printed Circuit Boards (PCB) and glued on a light honeycomb and carbon fibre sandwich to ensure planarity and mechanical stiffness. The design goal of having a maximum deviation from planarity of 150 µm was achieved with only a few chambers exceeding slightly this value. The PCBs of the pad plane were produced in two or three pieces. The PCBs are segmented into 12 (stack 2) or 16 pads along the z-direction, and 144 pads in the direction of the anode wires (rϕ). The pad area varies from 0.635 cm × 7.5 cm to 0.785 cm × 9 cm [45] to achieve a constant granularity with respect to the distance from the interaction point. The pad width of 0.635 cm to 0.785 cm in the rϕ direction was chosen so that charge sharing between adjacent pads (typically three), which is quantified by the pad response function (PRF) [46], is achieved. As a con-sequence, the position of the charge deposition can be reconstructed in the rϕ-direction with a spatial resolution of . 400 µm [46]. In the longitudinal direction, the coarser segmentation is sufficient for the track matching with the inner detectors. In addition, the pads are tilted by ± 2◦ (sign alternating layer-by-layer) as shown in Fig. 4, which improves the z-resolution during track reconstruction without compromising the rϕ resolution. For clusters confined within one pad row, a z position at the row centre is assumed, zcluster= z0. The honeycomb structure also acts as a support for the read-out boards. The pads are connected to the read-out boards by short polyester ribbon cables via milled holes in the honeycomb structure.
The original design of the TRD was conceived such that events with a multiplicity of dNch/dη = 8000 would have lead to an occupancy of 34% in the detector [44]. The fast read-out and processing of such data on 1.15 · 106 read-out channels required the design and production of fully customised front-end electronics (see Section 5).
The positive signal induced on the cathode pad plane is amplified using a charge-sensitive PreAmplifier-ShAper (PASA) (see Section 5) and the signals on the cathode pads are sampled in time bins of 100 ns inside the TRAcklet Processor (TRAP, see Section 5). For LHC Run 1 and Run 2 running conditions (see Section 7.2), the probability for pile-up events is small. The averaged time evolution of the signal is shown in Fig. 5 for pions and electrons, with and without radiator. In the amplification region (early
0 20 40 60 80 100 120 0 0.5 1 1.5 2 2.5 3 d
(µ s)
Av
er
age pu
lse hei
ght (mV
)
p = 2 GeV/c π e dE/dx + TR e dE/dx dE/dxt
Fig. 5: Average pulse height as a function of drift time for pions and electrons (with and without radiator). The time axis is shown with an arbitrary offset of 0.3 µs. The measurements were performed at the CERN PS with prototype read-out chambers that were smaller in overall size (active area 25 cm × 32 cm) but otherwise similar in construction to that of the final detector. Figure taken from [47].
same time interval. The contribution of TR is seen as an increase in the measured average signal at times corresponding to the entrance of the chamber (around 2.5 µs in Fig. 5), where the TR photons are preferentially absorbed. At large times (beyond 2.5 µs), the effect of the slow ion movement becomes visible as a tail. Various approximations of the time response function, the convolution of the long tails with the shaping of the PASA, were studied in order to optimally cancel the tails in data, see Section 8. The knowledge of the ionisation energy loss is important for the control of the detector performance and for tuning the Monte Carlo simulations. A set of measurements was performed with prototype read-out chambers with detachable radiators for pions and electrons at various momenta [48]. An illustration of the measured data is shown in Fig. 6 for pions and electrons with a momentum of 2 GeV/c. The sim-ulations describe the Landau distribution of the total ionisation energy deposition, determined from the calibrated time-integrated chamber signal. A compilation of such measurements over a broad momen-tum range including data obtained with cosmic-ray muons and from collisions recorded with ALICE is shown in Section 11, Fig. 37.
Measurements of the position resolution in the rϕ-direction (σy) and angular resolution σϕ, conducted with prototype chambers, established that the required performance of the detector and electronics (σy .400 µm and σϕ ≤ 1◦) is reached for signal-to-noise values of about 40, which corresponds to a moderate gas gain of about 3500 [46].
The production of a chamber was performed in several steps [49] and completed in one week on average. First, the aluminium walls of the chamber were aligned on a precision table and glued to the radiator panel. The glueing table was custom-built to ensure the required mechanical precision and time-efficient handling of the components. For almost all junctions the two-component epoxy glue Araldite R AW 116
with hardener HV 953BD was used. In a few places, where a higher viscosity glue was needed, Araldite R
AW 106 was applied. In a second step, the cathode and anode wires were wound on a custom-made winding machine and glued onto a robust aluminium frame in order to keep the wire tension. This aluminium frame was subsequently placed on top of the chamber body, and the cathode and anode wires were transferred to the G10 ledges glued to the chamber body. After gluing of the anode and cathode wire planes, the tension of each wire was checked by moving a needle valve with pressurised air across
10-4 10-3 10-2 10-1 pions Data δ escape no δ escape Simulations
Yield (keV
-1)
10-4 10-3 10-2 10-1 0 20 40 60 80 100 120 140 electrons∆
E (keV)
p=2 GeV/cFig. 6: Distributions of the ionisation energy loss of pions and electrons with momenta of 2 GeV/c. The symbols represent the measurements obtained at the CERN PS with prototype read-out chambers that were smaller in overall size (active area 25 cm × 32 cm) but otherwise similar in construction to that of the final detector. The lines are simulations accounting (continuous line) or not (dashed line) for the long range of δ -electrons as compared to the chamber dimensions. Figure taken from [48].
the wires. The induced resonance frequency in each wire was determined by measuring the reflected light of an LED [50]. Afterwards the pad plane and honeycomb structure were placed on top of the chamber body. Following this production process, each chamber was subjected to a series of quality control tests with an Ar-CO2 (70-30) gas mixture. The tests were performed once before the chamber was sealed with epoxy (closed with clamps) and repeated after chamber validation and glueing. In the following the requirements are described [51]. The anode leakage current was required not to exceed a value of 10 nA. The gas leak rate was determined by flushing the chamber with the Ar-CO2gas mixture and measuring the O2 content of the outflowing gas. It was required to be less than 1 mbar · l/h. In addition, the leak conductance was measured at an underpressure of 0.4–0.5 mbar in the chamber. The underpressure test was only introduced at a later stage of the mass production after viscous leaks were found, see Section 3.4.1 for more details. Comparisons of the anode current induced by a109Cd source placed at 100 different positions across the active area allowed determinations of the gain uniformity. The step size for this two-dimensional scan was about 10 cm in both directions and the measured values were required to be within ± 15% of the median. Electrically disconnected wires were detected by carrying out a one-dimensional scan perpendicular to the wires with a step size of 1 cm. This scan clearly identified any individual wire that was not connected due to the visible gas gain anomaly in the vicinity of this wire, and allowed for repair. For one position the absolute gas gain was determined by
Fig. 7: Side (left) and top (right) view of the design of the TRD sandwich radiator [44]. 0 10 20 30 40 50 TR TR to t ( tot) 0 0.01 0.02 0.03 0.04 0.05
p = 2 G eV /c
Data
Simulation
E (keV)
d
N
/d
E
(1/k
eV)
Fig. 8: Measured and simulated spectra of TR produced by electrons with a momentum of 2 GeV/c for the ALICE TRD sandwich radiator. Figure adapted from [53].
characterised by monitoring the gas gain in intervals of 15 minutes over a period of 12 hours. 2.2 Radiator
The design of the radiator is shown in Fig. 7. Polypropylene fibre mats of 3.2 cm total thickness are sand-wiched between two plates of Rohacell R foam HF71, which are mechanically reinforced by lamination
of carbon fibre sheets of 100 µm thickness. Aluminised kapton foils are glued on top, to ensure gas tight-ness and to also serve as the drift electrode. For mechanical reinforcement, cross-bars of Rohacell R foam
of 0.8 cm thickness are glued between the two foam sheets of the sandwich, with a pitch of 20–25 cm depending on the chamber size. After construction the transmission of the full radiator was measured using the Kαline of Cu at 8.04 keV to ensure the homogeneity of the radiators [52]. This line was chosen as its energy is close to the most probable value of the TR spectrum (see Fig. 8).
Measurements with prototypes [53] indicated that such a sandwich radiator produces 30–40% less TR compared to a regularly spaced foil radiator. However, constructing a large-area detector with radiators made out of 100 regularly spaced foils each is infeasible. The impact of various radiators constructed from fibres and/or foam on, e.g. particle identification is discussed in [47, 53]. Based on these measure-ments the fibre/foam sandwich radiator design was chosen for the final detector.
The spectra of TR produced by electrons with a momentum of 2 GeV/c as measured with the ALICE TRD sandwich radiator is shown in Fig. 8. Such a measurement is important for the tuning of simula-tions in the ALICE setup. As the production of TR is not included in GEANT3 [54], which is used to propagate generated particles through the ALICE apparatus for simulations, we have explicitly added it to our simulations in AliRoot [55], the ALICE offline framework for simulation, reconstruction and analysis. An effective parameterisation of the irregular radiator in terms of a regular foil radiator is em-ployed as an approximation. The simulations describe the data satisfactorily including the momentum dependence [53].
2.3 Supermodule
The detector is installed in the spaceframe (the common support structure for most of the central barrel detectors) in 18 supermodules, each of which can host 30 read-out chambers arranged in 5 stacks and 6 layers (see Fig. 3). The overall shape of the supermodule is a trapezoidal prism with a length of 7.02 m (8 m including services). Its height is 0.78 m and the shorter (longer) base of the trapezoid is 0.95 m (1.22 m). The weight of a supermodule with 30 read-out chambers is about 1.65 t. Mechanical stability is provided by a hull of aluminium profiles and sheets, connected with stainless steel screws. The materials were chosen to minimise the interference with the magnetic field in the solenoid magnet. In front of PHOS, where minimal radiation length is required, the aluminium sheets of the short and long base of the trapezoid were replaced by carbon-fibre windows.
All service connections must be routed internally to the end-caps of the supermodule. Those that require materials with large radiation length are placed at the sidewalls, outside the active area of the TRD and most other detectors in ALICE. This includes the low-voltage power distribution bus bars as well as other copper wires for the Detector Control System (DCS) board power, network and high-voltage (HV) connections between the fanout boxes and read-out chambers, and the rectangular cooling pipes (see Section 4 for more details).
Low-voltage (LV) power for the read-out boards is provided via copper power bus bars (2 for each layer and voltage as described in Table 3) with a cross-section of 6 mm × 6 mm (per channel) running along the sidewalls of the supermodule. Each read-out board is connected directly to the power bus bars. Heat generated by ohmic losses in the power bus bars is partially transferred to the adjacent cooling pipes (see Section 4.2). The power bus bars protrude about 30 cm from each side of the supermodule hull, where they are equipped with capacitors for voltage stabilisation. On one end-cap of the supermodule the power-bus bars are connected via a low-voltage patch panel to the long supply lines to the power supplies outside of the magnet.
Each read-out chamber is equipped with 6 or 8 read-out boards (see Section 2.1) and one DCS board (see Section 4.4). Power is provided and controlled separately for each DCS board by a power distribution box. The DCS boards are connected via twisted-pair cables to Ethernet patch panels at the end-caps and the boards of two adjacent layers are connected via flat-ribbon cables in a daisy chain loop to provide low-level Joint Test Action Group (JTAG) access to neighbouring boards.
For each chamber, three optical fibres are routed to the end-cap on the C-side. Two fibres connect the optical read-out interfaces to a patch panel, where they are linked via the Global Tracking Unit (GTU) (see Section 5) to the Data AcQuisition (DAQ) systems. One trigger fibre connects the DCS board to the trigger distribution box (see Section 5.1), which receives the trigger signals from the pretrigger system or its back-up system and splits them into 30 fibres (+ 2 spares).
The supermodules were constructed from 2006 to 2014. In the following, we discuss the sequence of required steps. After the construction of the supermodule hulls, the power bus bars and patch panels for the distribution of low voltage for the read-out boards and the cooling bars for the water cooling were
distribution, a patch panel for the optical read-out fibres, and the high-voltage distribution boxes were installed at the end-caps.
Before integrating the read-out chambers into a supermodule, they were equipped with electronics (read-out boards, DCS boards) and cooling pipes. After a series of tests were performed to ensure stable operation [56, 57], the chambers were then inserted layer by layer. The first connection established during the installation was the gas link between the chambers (using polyether ether ketone connectors). The chambers were fixed to the hull with three screws on each of the long sides after performing a manual physical alignment. As demonstrated by later measurements (Section 9), the alignment in rϕ between the chambers is of the order of 0.6–0.7 mm (r.m.s.).
The cables to and from the read-out boards used for JTAG, low-voltage sensing, Ethernet, and DCS power were routed along one side of the chambers. The cable lengths in the active area on top of the chambers were minimised, avoiding cables from the read-out pads to cross. On the other side of the chambers, only the high voltage cables were routed. They were soldered at two separate HV distribution boxes for anode and drift voltage at one end-cap of the supermodule. Each read-out board (38 per layer) was connected to the power bus bars (low voltage) using pre-mounted cables. The cooling pipes (4 per read-out board) were connected by small Viton tubes. In the z-direction across the read-out chambers, only optical fibres for the trigger distribution (1 per chamber) and data read-out (2 per chamber) were routed.
In addition to layer-wise tests during installation, a final test was done after completion. The test setup consisted of low-voltage and high-voltage supplies, a cooling plant, a gas system [58], as well as a full trigger setup and read-out equipment. Also a trigger for cosmic rays was built and installed [59, 60]. It was used for first measurements of the gas gain and the chamber alignment, and to also study the zero suppression during assembly [50, 61–65].
After transport to CERN pre-installation tests were performed (see Section 7.1 and [66]) and the su-permodules were installed in the space frame with a precision of 1 cm (r.m.s.) in zlab-direction. The maximum tolerance in ϕ is 2 cm due to constraints given by the space frame.
In addition to the sequential assembly and installation, four supermodules were completely disassembled again in 2008 and 2009. The initial tests were not sensitive to viscous leaks of the read-out chambers and thus the supermodules were rebuilt after improving the gas tightness (see Section 3.4.1). Furthermore, in 2013 during LS 1, one supermodule was disassembled in order to improve the high-voltage stability of the read-out chambers (see Section 7.3).
2.4 Material budget
A precise knowledge of the material budget of the detector is important to obtain a precise description of the detector in the Monte Carlo simulations, which are used, e.g. to compute the track reconstruction efficiencies.
The TRD geometry, as implemented in the simulation part of AliRoot, consists of the read-out chambers, the services, and the supermodule frame. All these parts are placed inside the space frame volume. The material of a read-out chamber is obtained including several material components. A general overview of the various components is given in Table 2.
The material budget in the simulation was adjusted to match the estimate based on measurements during the construction phase of the final detector. The supermodule frames consist of the aluminium sheets on the sides, top, and bottom of a supermodule together with the traversing support structures, such as the LV power bus bars and cooling arteries. Additional electronics equipment is represented by aluminium boxes that contain the corresponding copper layers to mimic the present material. The services are also introduced, including, e.g. the gas distribution boxes, cooling pipes, power and read-out cables, and
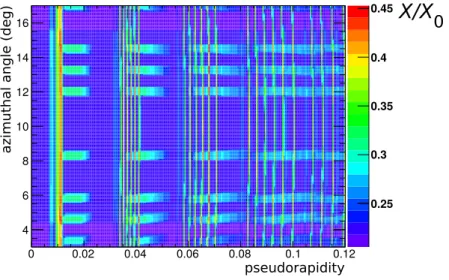
0 0.02 0.04 0.06 0.08 0.1 0.12 4 6 8 10 12 14 16 0.25 0.3 0.35 0.4 0.45
X/X
0 azimuth al angle ( deg) pseudorapidityFig. 9: The radiation length map in units of X/X0in a zoomed-in part of the active detector area as a function of the pseudorapidity and the azimuthal angle, calculated from the geometry in AliRoot (the colour scale has a suppressed zero). The positions of the MCMs and the cooling pipes are visible as hot spots. The radiation length was calculated for particles originating from the collision vertex. Therefore the cooling pipes of the six layers overlap for small, but not large η.
Description X/X0(%)
Radiator 0.69
Chamber gas and amplification region 0.21
Pad plane 0.77
Electronics (incl. honeycomb structure) 1.18
Total 2.85
Table 2: Parts of one read-out chamber, radiator, electronics, and their average contribution to the radiation length in the active area for particles with normal incidence.
power connection panels.
Figure 9 shows the resulting radiation length map, quantified in units of radiation length (X/X0), in a zoomed-in part of the active detector area. It is clearly visible that the Multi-Chip Modules (MCM)s on the read-out boards (see Section 5) and the cooling pipes introduce hot spots in X/X0. After averaging over the shown area, the mean value is found to be hX/X0i = 24.7% for a supermodule with aluminium profiles and sheets and 30 read-out chambers (6 chambers per stack with the material budget as indicated in Table 2). The reduced material budget of the supermodules in front of the PHOS detector (carbon fibre inserts instead of aluminium sheets and no read-out chambers in stack 2) is likewise modelled in the simulation. In regions directly in front of PHOS hX/X0i is only 1.9%.
The total weight of a single fully equipped TRD supermodule as described in the AliRoot geometry, including all services, is 1595 kg, which is about 3.3% less than its real weight. This discrepancy can be attributed to material of service components, such as the gas manifold (see Section 3.3) and the patch panel, outside the active area, which were not introduced in the AliRoot geometry.
3 Gas
At atmospheric pressure, a total of 27 m3 of a xenon-based gas mixture must be circulated through the TRD detector. This expensive gas cannot be flushed through, but rather has to be re-circulated in a closed
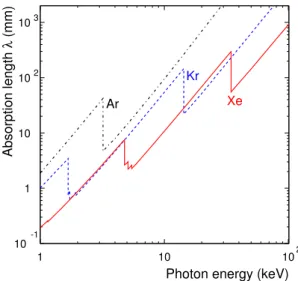
10-1 1 10 102 103 1 10 102
Photon energy (keV)
Absorption length
λ (mm)
Ar
Kr
Xe
Fig. 10: Absorption length of X-rays in noble gases in the relevant energy range of TR production.
the TRD follows a pattern in construction, modularisation, control, and supervision which is common to all LHC gaseous detectors, with emphasis on the regulation of a very small overpressure on the read-out chambers and on the minimisation of leaks. The basic modules such as mixer, purification, pump, exhaust, analysis, etc., are based on a set of equal templates applied to the hardware and the software. A Programmable Logic Controller (PLC) controls each system and the user interacts with it through a supervision panel. Upon a global command, the PLC executes a sequence that configures all elements of the gas system for a given operation mode and continuously regulates the active elements of the system. In this manner the modules and operational conditions can be customised to the specific requirements of each detector, from the control of the stability of the overpressure in the detectors, the circulation flow, and the gas purification, recuperation and distillation, to the monitoring of the gas composition and quality (Xe-CO2(85-15), and as little O2, H2O and N2as possible).
3.1 Gas choice
As well as being an array of tracking drift chambers, the TRD is an electron identification device, achieved through the detection of TR photons. In order to efficiently absorb these several keV pho-tons, a high Z gas is necessary. Figure 10 shows, for three noble gases, the absorption length of photons of energies in the range of typical TR production. At around 10 keV the absorption length in Xe is less than a cm, whereas for Kr it is several cm. This argues for the choice of Xe as noble gas for the operating mixture. CO2 is selected as the quenching gas, since hydrocarbons are excluded for flammability and ageing reasons. The choice of the exact composition is in this case rather flexible, since the design of the wire chambers leaves enough freedom in the choice of the drift field and anode potential. The best com-promise for the CO2 concentration corresponds to the mixture Xe-CO2 (85-15), which ensures a very good efficiency of TR photon absorption by Xe and provides stability against discharges to the detector. Furthermore, this mixture exhibits a nice stability of the drift velocity, at the nominal drift field, also with the inevitable contamination of small amounts of N2that accumulates in the gas through leaks (see Section 3.2). The drift velocity of the Xe-CO2 (85-15) mixture, pure and with substantial admixtures of N2, as a function of the drift field, is shown in Fig. 11 (left). The drift velocity does not depend on the N2contamination at the nominal drift field of 700 V/cm. On the other hand, as illustrated in Fig. 11 (right), the anode voltage would need a 50 V readjustment to keep the gain constant when increasing the concentration of N2 by 10% in the mixture. It should be noted that intakes of less than 5% N2 are typically observed in one year of operation. After 2–3 years of operation, the N2 is cryogenically separated from the Xe (see Section 3.3.9).
4 0 0 6 0 0 8 0 0 1 0 0 0 0 1 2 3 0 % N 2 1 0 % N 2 2 0 % N 2 vd ( c m / µ s ) D r i f t f i e l d ( V / c m ) 1 5 0 0 1 6 0 0 1 7 0 0 1 8 0 0 1 0 0 0 1 0 0 0 0 0 % N 2 1 0 % N 2 2 0 % N 2 G a in A n o d e v o l t a g e ( V ) X e - C O 2- N 2 ( 8 5 - 1 5 - x )
Fig. 11: Left: Drift velocity as a function of the drift field for the nominal gas mixture Xe-CO2and different admixtures of N2. Right: Gain as a function of the anode voltage for the same gas mixtures.
The operation of the chambers in a magnetic field of 0.5 T, perpendicular to the electric drift field (700 V/cm), forces the drifting electrons on a trajectory, which is inclined with respect to the electric field. The so-called Lorentz angle is about 9◦for this gas mixture (see Section 10).
For commissioning purposes, where TR detection is not necessary, the read-out chambers are flushed with Ar-CO2(82-18), which is available in a premixed form at low cost.
3.2 Requirements and specifications
The TRD consists of read-out chambers with an area of about 1 m2 which are built with low material budget. This poses a severe restriction on the maximum overpressure that the detector can hold. There-fore, while in operation, the pressure of each supermodule is regulated by the gas system to a fraction of a mbar above atmospheric pressure and the safety bubblers, installed close to the supermodules, are adjusted to release gas at about 1.3 mbar overpressure. The detector can hold an overpressure in excess of 5 mbar.
Another tight constraint arises from the highly disadvantageous surface-to-volume ratio of the detector, which enhances the challenge of keeping the gas losses through leaks to a minimum. Cost considerations drive the criterion for the maximum allowable leak rate of the system: a reasonable target is to lose less than 10% of the total gas volume through leaks in one year. This translates into a total leak conductance of 1 ml/h per supermodule at 0.1 mbar overpressure. As a result, unlike in other gas systems, gas is not continuously vented out to the atmosphere. Furthermore, the filling and emptying of the system must be performed with marginal losses of xenon. Adequate gas separation and cryogenic distillation techniques are therefore implemented. Furthermore, any pulse-height measuring detector must be operated with a gas free of electronegative substances, such as O2, which is continuously removed from the gas stream. Precautions are taken by chromatographic analyses of both the supply xenon and of the air inside the volume of the solenoid magnet to avoid any SF6 contamination of the gas through gas supply cylinders or from neighbouring detectors.
3.3 Description of the gas system
supply mixer exhaust membrane separator cryogenic Xe recovery inlet distribution compressor detector return regulation surface sha* cavern
Fig. 12: Schematic view of the TRD gas system. The gas circulates in a closed loop pushed by a compressor. The flow for each supermodule is determined by the pressure set at individual pressure reducers in the inlet distribution modules. The overpressure is regulated with individual pneumatic valves at the return modules. The gas is purified at the surface and, when needed, supply gas is mixed and added to the loop. For the filling and the removing of the expensive xenon, semipermeable membranes are used to separate it from the CO2. The recovered xenon can be treated in a cryogenic plant in order to remove accumulated N2, prior to storage.
distributed, as shown schematically in Fig. 12, on the surface, in a location halfway down the cavern shaft, and in the cavern. The gas is circulated by compressors that suck the gas from the detector and compresses it to a high pressure value. This pumping action is regulated to keep the desired overpressure at the detector. In the high-pressure part of the system, at the surface, gas purification, mixing, and other operations are carried out. On its way to the cavern, the gas is distributed to individual supermodules using pressure regulators. The gas circulates through the detector and at the outlet of each sector a gas manifold is used to return the gas through a single line and to hold the pressure regulation hardware. Halfway to the surface, a set of pneumatic valves is used to regulate the flow from each supermodule in order to keep the desired overpressure. The gas is then compressed into a high pressure buffer prior to circulation back to the surface.
3.3.1 Distribution
Xenon is a heavy gas; its standard condition density at ambient conditions is 5.76 kg/m3, 4.7 times that of air. This means that over the 7 m height-span of the TRD in the experiment, the total hydrostatic pressure difference between the top and the bottom supermodules would be about 2.8 mbar. In order to overcome this, gas is circulated separately through each supermodule (except the top three and the bottom three, which are installed at similar heights) and the pressure is thus individually regulated to equal values everywhere. In addition, due to the different heights of the supermodules, the gas, supplied from the surface, would flow unevenly through the different supermodules, the lower ones being favoured over the higher ones. This second inconvenience is overcome by supplying the gas to each supermodule from the distribution area (half way down the cavern shaft) through 4 mm thin lines over a length of about 100 m. The pressure drop of the circulating gas in these lines, of several tens of mbar, is much larger than the difference in hydrostatic pressure between supermodules, and therefore nearly equal flow, at equal overpressure, is assured in all supermodules.
of them serving two consecutive layers. Small bypass bellows connect two consecutive layers on the opposite side. In the A-side, a manifold arrangement is used to connect the gas outlets and a common safety bubbler, pressure sensors and back-up gas. The return outlets in each supermodule are connected together into one line which returns to the pump module. The three top and three bottom supermodules are connected to one single return line each. This arrangement results into 14 independently regulated circulation loops. Each supermodule has its own two-way bubbler, which provides the ultimate safety against over- or underpressure.
3.3.2 Pump
In the distribution area, the flow through each return line is regulated by a pneumatic valve per loop driven by the pressure sensors located at the detector. In this area, the gas is kept at a pressure slightly below atmospheric pressure, and it is stored in a 0.8 m3buffer container before it is compressed by two pumps which operate at a constant frequency. The compressor module drives a bypass valve in order to maintain a calculated pressure set point at its inlet. In this manner, a dual regulation concept is used to handle the 14 loops. The role of the inlet buffer is to act as a damper of possible regulation oscillations. This pressure regulation system keeps the overpressure in the supermodule stable at 0.1 mbar above atmospheric pressure (set point) within 0.03 mbar.
A 0.93 m3 high pressure buffer at the compressor outlet is used as a storage volume. Its content varies according to the atmospheric pressure, either by providing gas to the detectors, or by receiving it from them. The overpressure in this buffer typically ranges between 0.8 and 2 bar. Knowledge of all the system volumes allows the pressure in the buffer to be predicted for any atmospheric pressure value. Gas leaks ultimately result in a reduction of this pressure, in that case the dynamic regulation of the high pressure triggers the injection of fresh gas from the mixer until the high pressure is restored. From this buffer, the pressurised gas is circulated up to the gas building at the surface.
3.3.3 Purifier
The purifier module consists of two 3 litre cartridges each filled with a copper catalyser which is efficient in chemically removing oxygen by oxidising the copper, and mechanically removing water by absorption. Upon saturation, the PLC switches between cartridges at the pre-defined frequency, and launches an automatic regeneration cycle where CuO2 is reduced at high temperatures with a flow of H2diluted in argon. As the detector is rather gas tight, the O2intake through leaks is moderate, and the purifier keeps it between 0 and 3 ppm. However, H2O diffusion, probably through the aluminised Mylar foil which constitutes the drift electrode of every read-out chamber, makes it necessary to switch between purifiers about every 3.5 days, in order to keep the H2O content below a few hundred ppm.
3.3.4 Recirculation
The surface module is used to recirculate the gas at high enough pressure to the distribution modules in the cavern shaft area. It also contains provisions for extracting gas samples for analysis, and a bypass loop to allow for the installation of containers such as a krypton source for gain calibration (see Section 10). 3.3.5 Mixer
Under normal operation and since the gas is only exhausted through leaks, gas injection into the system happens only if the pressure in the high pressure buffer falls below a dynamic threshold, as explained above. On such occasions, the mixer is activated and injects the nominal gas mixture at a rate of a few tens of l/h until the high pressure buffer is replenished. The amount of gas injected by the mixer during a given period provides a direct measurement of the leak rate.
3.3.6 Backup system
When the gas system is in stop mode, e.g. when there is a power failure, the safety bubbler installed on each supermodule ensures that the detector pressure always remains within about ±1.3 mbar relative to atmospheric pressure. In order to avoid that air, i.e. oxygen, enters the detector, the external side of the bubbler is connected to a continuous flow of neutral gas, in this case N2, that flows through the bubbler in case of a large detector underpressure. The choice of N2 is driven by the small influence on the gas properties that this admixture has (see Fig. 11). The full TRD is served by three independent backup lines, each with connections to six supermodule bubblers, and arranged such that the flow points downwards. In this way, if the xenon mixture is exhausted through the bubblers, it falls down the back-up line, relieving its high hydrostatic pressure. A differential pressure transmitter measures the pressure difference between the detector and the backup gas.
3.3.7 Analysis
The control of the gas quality is perhaps the most demanding aspect of running detectors where both signal amplitude and drift time information are important. This control is even more crucial for the ALICE TRD, where accurate and uniform drift velocity and gain values are needed for triggers based on online tracking and particle identification. Thus, in addition to effective tightness of the system and continuous removal of O2 and H2O, constant monitoring of the gas composition and in particular of the N2 is necessary. Although for a large volume system such as that of the TRD the changes in composition are obviously slow, the precision and stability requirement of the measuring instruments are quite challenging. Furthermore, constantly measuring analysers, such as O2, H2O and CO2sensors, must be installed in the gas loop, since xenon must not be exhausted. Therefore they must be free of outgassing of contaminants into the gas.
The analysis module samples the return gas from individual supermodules in a bypass mode, before it is compressed. For this, a fraction of the gas is pushed through the analysis chain by a small pump, and returned to the loop at the compressor inlet. Usually, the PLC is programmed to continuously sample one supermodule after the other, for about 10 minutes each.
An external gas chromatograph is used to periodically measure the gas composition. This device is not in the gas loop; rather, the gas is exhausted while purging and sampling a small stream for a few seconds every few hours.
3.3.8 Membranes
One system volume of xenon is injected for operation and, typically every two or three years, removed for cleaning and storage. This means that it must be possible to separate CO2from Xe. This separation is achieved with a set of two semipermeable membrane cartridges. Each cartridge consists of a bundle of capillary polyimide tubes through which the mixture flows. The bundle is in turn enclosed in the cartridge case. While the CO2 permeates through the polyimide walls, most of the xenon is contained and continues to flow into the loop. The permeating gas can be circulated through the second membrane cartridge to further separate and recover most of the Xe.
During the filling, the detector is first flushed with CO2and then, in closed-loop circulation, the xenon is injected as the CO2is removed through the membranes. The reverse process is used for the recuperation of the xenon into a cryogenic plant.
3.3.9 Recuperation
N2inevitably builds up in the gas through small leaks and cannot be removed by the purifier cartridges. Therefore, after each long period (2–3 years) of operation, the N2is cryogenically separated from the Xe.
A cryogenic buffer is filled with xenon after separating it from CO2. At the same time, CO2is injected into the gas system in order to replace the removed gas.
The cryogenically isolated buffer is surrounded by a serpentine pipe with a regulated flow of liquid nitrogen (LN2) in order to keep its temperature at −170◦C, just above the N2boiling point (−195.8◦C). At this temperature Xe (and CO2) freezes whereas N2stays in the gaseous phase. Once the buffer is full, the stored gas is pumped away. After this, the buffer is heated up in a regulated way, and the evaporating Xe is compressed into normal gas cylinders. The resulting Xe has typically a N2contamination of <1%, and the total Xe loss (due to the efficiency of the membranes and the cryogenic recovery process) is about 1 m3for a full recovery operation.
3.4 Operational challenges
The gas system has been operating reliably over several years in several modes, but mainly in so-called run mode. Aside from minor incidents, a number of important leaks have been dealt with, which deserve a brief description.
3.4.1 Viscous leaks
As part of the standard quality assurance procedure, a leak test was performed on each chamber prior to installation in the supermodule. The leak test consisted of flushing the chamber with gas and measuring the O2contamination at the exhaust, where the overpressure was typically about 1 mbar. It was found, however, that a supermodule would lose gas even if the O2 content was very low. The reason turned out to be the particular construction of the pad planes, which are glued to a reinforcement honeycomb panel with a carbon fibre sheet. Viscous leaks would develop between the glued surfaces and gas would find its way out through the cut-outs for the signal connections machined in the honeycomb sandwich. The impedance of this kind of leak is large enough that gas can escape the detector with no intake of air through back-diffusion. The concerned read-out chambers were then extracted and repaired, and the leak tests on subsequent chambers were modified such that the O2 was measured both at over- and underpressure in the read-out chamber, resulting in a tight system.
3.4.2 Argon contamination
At one point, the routine gas analysis with the gas chromatograph showed increasing levels of Ar in the Xe-CO2 mixture. This elusive leak came from a faulty pressure regulator which was pressurised with argon on the atmospheric side. Occasionally, depending on the pressure, the membrane of the regulator would leak and let Ar enter the gas volume. A total of 1% Ar accumulated in the mixture and was removed by cryogenic distillation, together with N2.
3.4.3 Leak in pipe
The last major leak in the system was detected when suddenly the pressure at the high pressure buffer started to steadily decrease. Any leak of the system would appear, while running, as a decrease in the high pressure buffer, because the system always ensures the right overpressure at the read-out chambers. By stopping the system and isolating all of its modules, it was found that the source of the leak was a long, stainless steel pipe which connected the compressor module, half way down the cavern shaft, to the surface, where the gas, still at high pressure, is cleaned and recirculated. It was not possible to find the exact location of the leak. This was solved by replacing the pipe by a spare.
4 Services
Channel Unom(V) Ityp(A) 3 x Analogue 1.8 V 2.5 125 3 x Analogue 3.3 V 4.0 107 3 x Digital 1.8 V 2.5 95–150 Digital 3.3 V 4.0 110 DCS boards 4.0 2 × 30
Table 3: Number of low voltage channels, nominal voltages and typical currents for the electronics on the chamber-mounted read-out boards of one supermodule. The current for the TRAP cores (digital 1.8 V) increases with the trigger rates. The current for the DCS boards is 2 × 30 A for two adjacent sectors.
routed via dedicated frames on the A- and C-side, respectively. Both frames are 2 m extensions of the space frame with similar geometry, but mechanically independent except for the flexible services. Most of the equipment, such as the low-voltage power supplies, is placed in the cavern underground and thus inaccessible during beam operation. Some devices are situated in counting rooms in the cavern shaft, which are supervised radiation areas but accessible.
4.1 Low voltage
The low voltage system supplies power to various components of the TRD. The largest consumer is the Front-End Electronics (FEE), i.e. the electronics of the Read-Out Boards (ROB) mounted on the chamber (see Section 5). To minimise noise, separate (floating) voltage rails are used for analogue and digital components. The power supply channels for analogue 1.8 V, analogue 3.3 V, and digital 1.8 V are grouped such that one power supply channel supplies two layers of a supermodule. For the digital 3.3 V there is one channel per supermodule. For each supermodule, this results in the supply channels listed in Table 3. The DCS boards (see Section 4.4) are powered by a power distribution box (PDB), two of which (in two adjacent supermodules) are supplied by a dedicated channel. The PDBs are controlled by Power Control Units (PCU) over a redundant serial interface.
Because of the high currents, the intrinsic resistances of the cables and connections are critical and are constantly monitored by measuring the voltage drop between the power supply unit (terminal voltage) and the patch panel at each supermodule (sense voltage). Typical values are 6–8 mΩ, depending on the cable length. In addition, the voltages at the end of each power bus bar are monitored.
The Global Tracking Unit (GTU) (see Section 5.3) uses additional power supplies which are shared with the PCUs. The pretrigger system (see Section 5.1) is powered by separate power supplies, laid out in a fail-safe redundant architecture.
Different customizations of the Wiener PL512 power supply units are used. The power supplies feeding the FEE are connected to a PLC-based interlock based on the status of the cooling. Power is automatically cut in case of a cooling failure.
During the Run 1 operation, several low-voltage connections on the supermodules showed increased resistivity resulting in excessive heat dissipation, which in some cases required to switch off part of the detector until the problem could be fixed during an access. Later, during LS 1, the affected supermodules were pulled out of the experiment and the connections were reworked in the cavern. The supermodules were re-inserted and re-commissioned immediately after the rework. The complete procedure took about one day per supermodule.
4.2 Cooling
The complexity of the cooling system, whose cooling medium is deionised water, is driven by the large amount of heat sources (more than 100 000) distributed over the complete active area of the detector. Heat is produced by the MCMs and the Voltage Regulators (VR) on the read-out boards, the DCS boards, and the power bars. The total heat dissipation in a supermodule amounts to about 3.3 kW, of which about
2.6 kW are produced in the FEE, the remaining 700 W originate from the voltage regulators and the bus bars. The DCS boards contribute with about 130 W per supermodule. Overall, the rate of heat to be carried away during detector operation amounts to 55 kW and 70 kW in Pb–Pb and pp collisions, respec-tively, due to different read-out rates. Apart from the power bus bars, the heat sources are positioned on top of the read-out boards.
In the cooling system the pressure is kept below atmospheric pressure. Thus a leak leads to air entering in the system but no water is spilled onto the detector. The cooling plant [67] consists of a 1500 l storage tank positioned at the lowest point outside the solenoid magnet, which is able to contain all the water of the installation, the circulation pump, the 18 individual circuits that supply cooling water to the 6 layers of each supermodule, and the heat exchanger connected to the CERN chilled water network. The reservoir is kept at 300–350 mbar below atmospheric pressure by means of a vacuum pump that also removes any air collected through small leaks. In addition, the pressure of the circulation pump (1.8 bar) and the diameter of all pipes are chosen such that a sub-atmospheric pressure is maintained in all places of the detector, despite a difference in height of about 7 m between the lowest and the highest supermodule. Each circuit is equipped with individual heaters and balancing valves in order to control the temperature and the flow in each loop separately. The heaters are regulated by a proportional-integral-derivative controller. A temperature stability in the cooling water of ±0.2◦C is achieved. The typical water flow is about 1300 l/h per supermodule. To avoid corrosion a fraction of the total water flow is passed by a deioniser to keep the water conductivity low. As the water is in contact with similar materials (stainless steel and aluminium), the TRD cooling system also supplies the water to the cooling panels of the thermal screening between TPC and TRD [31].
The loop regulations and cooling plant control is done by a PLC. Warnings and alarms are issued by the PLC if the parameters are outside the allowed intervals and read out by the Detector Control System (see Section 6). Two independent security levels were implemented in each loop. The first continuously monitors the pressure of each loop and stops the water circulation of the cooling plant if any value reaches atmospheric pressure. Secondly, large safety valves were installed at the entrance to each supermodule. They will open in case an overpressure of 50 mbar is reached, providing a low resistance path for the water evacuation in case of emergency.
The cold water is supplied in the lowest point of each supermodule and the warm water is collected on the highest point in order to have more homogeneous water flow in all pipes. A water manifold at one end-cap of the supermodule distributes the water in parallel to the 6 layers inside each supermodule, and on the opposite side a similar manifold collects the warm water. In each layer, two rectangular pipes along the z-direction (65 × 8 × 7500 mm) supply (collect) water to (from) the meanders, 76 individual cylindrical aluminium pipes (3 mm in diameter) running across the y-direction where the heat sources are. A total of 17 meander types were designed for the system. To bring the water from the rectangular pipes to the individual meanders, the rectangular pipe has small stainless steel pipes (3 mm diameter and 5 cm length) soldered at the proper position for each MCM row. A Viton tube of about 2 cm length is used to connect the small stainless steel pipes and the meanders as well as for the connections between the two meanders (one per ROB) in y-direction. A total of about 25000 Viton tube connectors were used in the system. This kind of connector was previously used in the CERES/NA45 leakless cooling system [68] because of its low price and reliability.
The cooling pad mounted on top of the heat source consists of an 0.4 mm thick aluminium plate. The meander is glued on top of the pad by aluminium-filled epoxy (aluminium powder: Araldite R 130:100
by weight) to increase the thermal conductivity. In order to maximise the heat transfer, the longest possible path was chosen. The choice of aluminium was driven by the necessity of keeping the material budget as low as possible in the active area of the detector.
4.3 High voltage
The high voltage distribution for the drift field and the anode-wire plane is made separately for each chamber, reducing the affected area to one chamber in case of failure. The power supplies for the drift channels and anode-wires were purchased from ISEG [69] (variants of the model EDS 20025). Each module has 32 channels, which are grouped in independent 16-channel boards. Each channel is independently controllable in terms of the voltage setting and current limit as well as monitoring of current and voltage. Eight modules are placed into each crate and remotely controlled via CANbus (Controller Area Network) from DCS (see Section 6). The HV crates are placed in one of the counting rooms in the cavern shaft, which allows access even during beam operation.
For each of the 30 read-out chambers in a supermodule one power supply is needed for the drift field and one for the anode-wire plane. A multiwire HV cable connects the 32 channel HV module with a 30 channel HV fanout box (patch box) located at one end of the supermodule, where the output is redistributed to single wire HV cables (see Section 2.3). The individual HV cables are then connected to a HV filter box, mounted along the side of the read-out chamber. The HV filter box supplies the HV to the 6 anode segments and the drift cathode of the read-out chamber, and in addition it allows connection of the HV ground to the chamber ground. It consists of a network of a resistor and capacitors (2.2 nF and 4.7 nF) to suppress load-induced fluctuations of the voltages in the chamber.
The HV crates are equipped with an Uninterruptible Power Supply (UPS) and a battery to bridge short term power failures. In case of a longer power failure (> 10 s) a controlled ramp-down is initiated, i.e. the HV of the individual drift and anode-wire channels is slowly ramped down. Details on maximum applied voltages, channel equalisation, ramp speed as well as high-voltage instability observed during data taking are discussed in Sections 6 and 7.3.
4.4 Slow control network
The slow control of the TRD is based on Detector Control Systemboards [70]. They communicate with the DCS (see Section 6) by a 10 Mbit/s Ethernet interface, mostly using Distributed Information Management (DIM) as protocol for information exchange. The use of Ethernet allows the use of standard network equipment, but a dedicated network restricted to the ALICE site is used. The DCS boards are used as end points for the DCS to interact with subsystems of the detector. Later sections will discuss how the DCS boards are used as interface to the various components, e.g. the front-end electronics or the GTU.
The DCS boards were specifically designed for the control of the detector components and are used by several detectors in ALICE. At the core, the board hosts an Altera Excalibur EPXA1 (ARMv4 core + FPGA), which hosts a Linux operating system on the processor and user logic in the FPGA fabric depending on the specific usage of the board. The DCS board also contains the Trigger and Timing Control receiver (TTCrx) for clock recovery and trigger reception. The Ethernet interface is implemented with a hardware PHY (physical layer) and a soft-Media Access Controller (MAC) in the FPGA fabric. In case of the boards mounted on the detector chambers, the FPGA also contains the Slow Control Serial Network (SCSN) master used to configure the front-end electronics. Further general purpose I/O lines are, e.g. used for JTAG and I2C communication.
Since the Ethernet connections are used for configuration and monitoring of the detector components, reliable operation is crucial. All DCS boards are connected to standard Ethernet switches installed in the experimental cavern outside of the solenoid magnet. Because of the stray magnetic field and the special Ethernet interface of the DCS board (no inductive coupling), there are limitations on the usable switches. Since the failure of an individual switch would result in the loss of connectivity to a large number of DCS boards, a custom-designed Ethernet multiplexer was installed in front of the switches in the second half of Run 1. This allows the connection of each DCS board to be remotely switched between two different
0 1 2 3 4 5 6 7 8 9 10 11 12 13 1415 16 17
supermodule stack ROC ROB
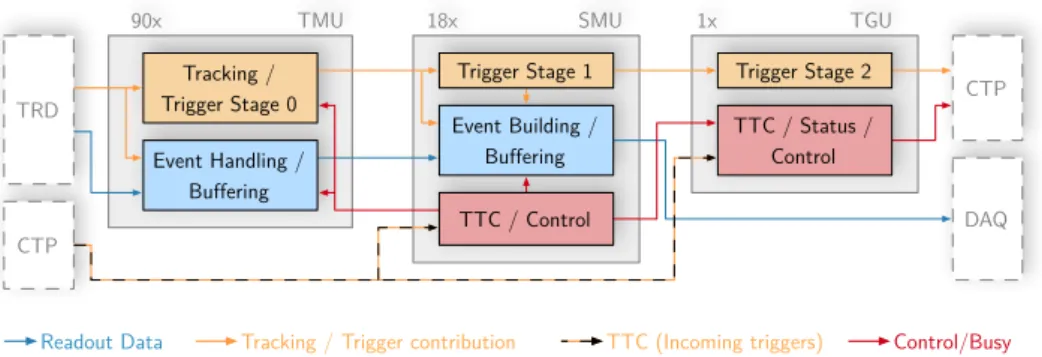
DAQ CTP SuperModule Unit Track Matching Unit Trigger Unit x 18 x 5 x 6 TRD zlab
Fig. 13: Detector structures and corresponding read-out stages [71]. The top row of the figure represents the detector and the bottom row the GTU components. The dimensions are not to scale.
switches with separate uplinks to the DCS network. The multiplexers themselves are implemented with fully redundant power supplies and control interfaces.
5 Read-out
The read-out chain transfers both raw data and condensed information for the level-1 trigger. While the former requires sufficient bandwidth to minimise dead time, the latter depends on a low latency, i.e. a short delay of the transmission. The data from the detector are processed in a highly parallelised read-out tree. Figure 13 provides an overview and relates entities of the read-out system to detector components. In the detector-mounted front-end electronics, the data are processed in Multi-Chip Modules grouped on Read-Out Boards (ROB) and eventually merged per half-chamber. Then, they are transmitted optically to the Track Matching Units (TMU) as the first stage of the Global Tracking Unit (GTU). The data from all stacks of a supermodule are combined on the SuperModule Unit (SMU) and eventually sent to the Data AcQuisition system (DAQ) through one Detector Data Link (DDL) per supermodule.
The read-out of the detector is controlled by trigger signals distributed to both the FEE and the GTU. The ALICE trigger system is based on three hardware-level triggers (level-0, 1, 2) and a High Level Trigger (HLT) [72] implemented as a computing farm. In addition to these levels, the FEE requires a dedicated wake-up signal as described in the next subsection.
5.1 Pretrigger and LM system
Both FEE and GTU must receive clock and trigger signals, which are provided by the Central Trigger Processor (CTP) [73] using the Trigger and Timing Control (TTC) protocol over optical fibres. While the GTU only needs the level-0/1/2 and is directly connected to the CTP, the FEE requires a more com-plicated setup. To reduce power consumption, it remains in a sleep mode when idle and requires a fast wake-up signal before the reception of a level-0 trigger to start the processing. During Run 1, an interme-diate pretrigger system was installed within the solenoid magnet [74, 75]. Besides passing on the clock and triggers received from the CTP, it generated the wake-up signal from copies of the analogue V0 and T0 signals (reproducing the level-0 condition) and distributed it to the front-end electronics. In addition, the signals from TOF were used to generate a pretrigger and level-0 trigger on cosmic rays. Because of limitations of this setup, the latencies of the contributing trigger detectors at the CTP were reduced for Run 2 (also by relocating the respective detector electronics) such that the functionality of the pretrigger system could be integrated into the CTP. The latter now issues an LM (level minus 1) trigger for the TRD before the level-0 trigger. An interface unit (LTU-T) was developed for protocol conversion [76] in order to meet the requirements of the TRD front-end electronics. A comparison of the two designs is shown in Fig. 14. The new system has been used since the beginning of collision data taking in Run 2.
RUN 1 setup CTP V0 T0 TOF PT FEE GTU CTP V0 T0 TOF LTU-T FEE GTU RUN 2 setup
Fig. 14: In Run 1, the wake-up signal required for the front-end electronics was generated by a dedicated pretrigger system. In Run 2, the functionality was implemented in the central trigger processor and the LTU-T serves as an interface to the TRD FEE.
CPU 0 CPU 1 CPU 2 CPU 3
18 19 20 21 22 23 24 25 26 27 28 29 30 31 17 16 15 14 13 32 33 34 35 36 37 38 39 40 0 1 2 3 4 5 6 7 8 9 10 11 12 13 14 15 16 17 0 1 2 3 4 5 6 7 8 9 10 11 12 13 14 15 16 17 0 1 2 3 4 5 6 7 8 9 10 11 12 13 14 15 16 17 0 1 2 3 4 5 6 7 8 9 10 11 12 13 14 15 16 17 18 19 20 18 MCM PASA ADC & DSP cluster detection fit sums tracklet calculation one padrow pads in
Fig. 15: Connections in one MCM [66].
5.2 Front-end electronics
The FEE is mounted on the back-side of the read-out chamber. It consists of MCMs which are connected to the pads of the cathode plane with flexible flat cables. An MCM comprises two ASICs, a PASA and a TRAP, which feature a large number of configuration settings to adapt to changing operating conditions. The signals from 18 pads are connected to the charge-sensitive inputs of the PASA on one MCM. An overview of the connections is shown in Fig. 15.
The very small charges induced on the read-out pads (typically 7 µA during 1 ns) are not amenable to direct signal processing. Therefore, the signal is first integrated and amplified by a Charge Sensitive Amplifier (CSA). Its output is a voltage signal with an amplitude proportional to the total charge. The CSA has a relatively long decay time, which makes it vulnerable to pile-up. A differentiator stage re-moves the low frequency part of the pulse. The exponential decay of the CSA feedback network, in combination with the differentiator network, leads to an undershoot at the shaper output with the same time constant as the CSA feedback network. A Pole-Zero network is used to suppress the undershoot. A shaper network is required to limit the bandwidth of the output signal and avoid aliasing in the subse-quent digitisation process. At the same time the overall signal-to-noise ratio must be optimised. These