HAL Id: jpa-00227423
https://hal.archives-ouvertes.fr/jpa-00227423
Submitted on 1 Jan 1988
HAL is a multi-disciplinary open access
archive for the deposit and dissemination of
sci-entific research documents, whether they are
pub-lished or not. The documents may come from
teaching and research institutions in France or
abroad, or from public or private research centers.
L’archive ouverte pluridisciplinaire HAL, est
destinée au dépôt et à la diffusion de documents
scientifiques de niveau recherche, publiés ou non,
émanant des établissements d’enseignement et de
recherche français ou étrangers, des laboratoires
publics ou privés.
HALLEY’S COMET : FROM REMOTE
ULTRAVIOLET SPECTROSCOPY TO IN-SITU
STUDIES
Anny Chantal Levasseur-Regourd
To cite this version:
Anny Chantal Levasseur-Regourd. HALLEY’S COMET : FROM REMOTE ULTRAVIOLET
SPEC-TROSCOPY TO IN-SITU STUDIES. Journal de Physique IV Proceedings, EDP Sciences, 1988, 49
(C1), pp.C1-25-C1-35. �10.1051/jphyscol:1988103�. �jpa-00227423�
JOURNAL DE PHYSIQUE
Colloque Cl, SupplBment au n o 3 , Tome 49, Mars 1988
HALLEY'S COMET
:
FROM REMOTE ULTRAVIOLET SPECTROSCOPY TO IN-SITU
STUDIES
A.-C. LEVASSEUR-REGOURD
UniversitB Paris VI, Service dVABronomie, BP 3,
F-91371 Verrihres-le-Buisson Cedex, France
INTRODUCTION
Due to the success of the March 1986 space missions to comet Halley, and to the large amount of ground, rocket or satellite observations, numerous papers have recently been published, and new and exciting problems have raised. It should nevertheless be kept in mind that the development of cometary physics is much prior to the last return to perihelion of Halley. One of the most remarkable results of the space missions has been to demonstrate that the nucleus, the coma (transient atmosphere which expands when the comet approaches the Sun), and the tails models that had been inferred from various astrophysical methods were rather in agreement with in situ observations.
The "nucleus" was assumed to be a rotating icy conglomerate, since the non gravitational forces required to explain some orbital perturbations seemed to originate in rocket effect (Whipple, 1950). The "coma" was believed to be a mixture of gases evaporating from the nucleus and of dust grains carried away by the expanding gases. Various emission features (resonance-fluorescence and forbidden transitions) were indeed found in the optical spectra of bright comets at short heliocentric distances R. superimposed on solar a like spectrum due to scattering of solar radiation (Schwartzschild and Kron, 1911)
:
first to appear when a comet approaches the Sun (R 4 au) are the bands of species normally unstable in gases at normal temperatures and pressures ; closer to the Sun (Re0.5 au), the lines of heavy elements appear. The "plasma tail" (with mainly CO+ emitter in the visible) formation was attributed to accelerations to momentum transferred from the solar wind (Biermann, 1951). The structure Of the "dust tail" was found to fit the trajectories of micron size grains released from the nucleus and acted upon by solar gravity and radiation pressure (Finson and Probstein, 1968).THE BIRTH
OF
COMETARY UV SPECTROSCOPYOptical spectroscopy of comets at short wavelengths is more than one century old (Huggins. 1882). One of its most unexpected by-products has been, in 1910, the fearful rumors about lethal gas in Halley, after identification of the violet CN bands (- 388 nm) in various comets. Near ultraviolet spectroscopy has been tried on comet Brooks 191 1 1, but no identification was possible, since the fine structure could not be resolved. During the autumn 1940, spectrogramms of Cunningham 1941 1 obtained from McDonald Observatory (Swings et al., 1941) revealed both the NH (P 336 nm) and the
OH
(- 309 nm) bands.In the sixties, when astronomical observations from outside the earth atmosphere became feasible, the most popular comet nucleus model was the Whipple conglomerate of ices (predominantly H20) and dust. As the ices evaporated, water molecules (or various hydrocarbons) had to be ejected and photodissociated by sunlight ; thus hydrogen atoms could be expected to bu~ld an envelop around the coma and to be luminescent in Lyman a (Biermann, 1968).
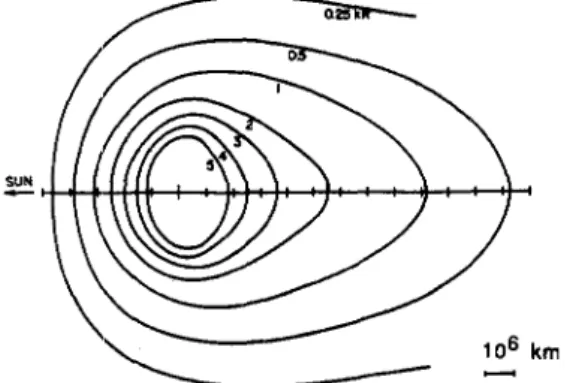
The first ultraviolet spectrum of a comet, Tago-Sato-Kosaka 1969 IX was obtained on January 14, 1970 from OAO (Orbiting Astronomical Observatory) 2 spacecraft (Code et al., 1972) ; it did show a huge Ly a (121.6 nm) emission. This result was soon confirmed by observations of Bennett 1970 11 from OGO (Orbiting Geophysical Observatory) 5 spacecraft (Bertaux et al., 1973). The "hydrogen halo", much greater than the visual coma, was found to extend over tens of millions of km (Fig. 1). The predominant species in the ultraviolet spectrum were demonstrated to
be
H and OH, both d~ssoc~ation products of H20. The strength of these lines was a convincing evidence for the large abundance of the water vapor In the coma.JOURNAL
DE
PHYSIQUE
Fig. 1
-
Ly a isophotes of comet Bennett 1970 11 observed by Bertaux et al. (1973) on 1 april 1970 from OGO 5 satellite (average surface brightness along the line of sight in kilo-Rayleigh).PROBLEMS AND GOALS IN COMETARY SPECTROSCOPY
The first goal in cometary spectroscopy is to determine the various species, i.e. to identify atoms, radicals and ions in the coma, in the ultraviolet halo or in the plasma tail. Due to the Swings and Greenstein effects, the emission bands are highly distorded, with intensity distributions within the molecular bands rather different from those observed in laboratory sources. The bands and lines emissions are sensitive to the solar intensity at the wavelength at which they absorb it. One has to take into account the Dopplershift across the irregular solar spectrum (Fraunhofer absorption lines), as a comet orbits towards or away from the Sun (Swings, 1941) and as the gas expands non uniformly outside the nucleus (Greenstein, 1958).
The species c~ventually identified by spectroscopy are mostly reactive radicals. The nucleus evaporates stable "parent" molecules, soon photolysed through various chemical processes in 'daugter" atoms, radicals and ipns (Wurm, 1934). Inferring from spectroscopic remote observations the composition of the nucleus is therefore a most difficult task, which would require both a good knowledge of ail the production processes, and simultaneous measurements of the relative abundances of all the different emissions.
In addition to determine which species are present in the coma and in the nucleus, a main goal of (ultraviolet) spectroscopy is to determine the production rates of these species. Digital spectrophotometry and high angular resolution are thus much desirable. The production rate Q for a given species is
Q = ~ I A ~ I T ~
where A is the spectrometer-comet distance (usually geocentric distance), F is the total flux In an emissive line of the given species, T is its lifetime and g is the probability of scattering a solar photon per unlt time per molecule (g factor). This equation assumes an optically thin medium, which is realistic except for the very inner coma ; also one has to take into account the variation of g with Swings or Greenstein effects (Feldman et al., 1976) and the variation of T with the solar activity (Oppenheimer and Downey, 1980). The production rate of water, as inferred from OH or H emission rates for various comets at (or reduced to) 1 au is of about loZ9 molecules S-I ; this sums to nearly 3 tons per second or 250 000 tons per day
...
For most of cometary observations, the field of view is smaller than the projected coma or hydrogen halo. The measured quantity is not the total flux F, but an average surface brightness along the line of sight. An integration of a realistic density model has to be made to derive physical parameters from the observations. The most usual model is the Haser model, which assumes symmetrical rodial outflow at velocity v, and, again an optically thin atmosphere; it includes the effects of the solar radiation pressure and of a maxwellian velocity distribution (Haser, 1966) and can be extended to
a
second daughter product (Festou, 1981). The surface brightness is derived from the product of the g factor by the integral of the space density over all velocities and over the line of sight ; realistic values of Q, v and r are obtained by empirically varying those parameters to fit the observations (Bertaux et al., 1973, Keller 1973). Ty ically, for comet Bennett 0bse~ations reduced to 1 au, the hydrogen production rate (4 X 10²' atomsP
S' ) and the lifetime (- 2 x 10⁶ S) were in agreement with anticipated values ; the relatively low value of the hydrogen outflow velocity (- 8 km s'l , whence a scale length
-
2 Xlo7
km) demonstrated that H 2 0 is not its only parent molecule, and that H is likely to also originate from photodissociation of OH.UV SPECTROSCOPY OF COMETS
-
THE PRE-HALLEY ERAOnce the existence of the H and OH halo had been established and the production rates had been estimated, extensive campaigns of ultraviolet spectral observations took place, which allowed the detection
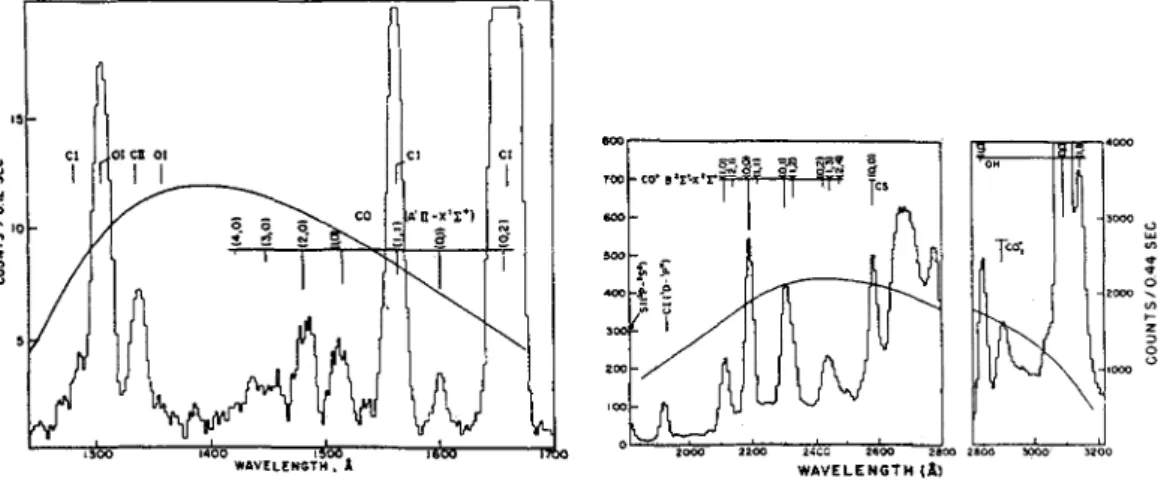
of minor species, the study of the evolution of the comae, and also some comparative spectroscopy (see the reviews by Keller, 1976 and Feldman, 1982). The new comet Kohoutek 1973 XI1 was studied from rocket flights and from Skylab space station, allowing the 0 (130.4 nm) and C (156.1 nm) emission lines to be discovered (Feldman et al. 1974 ; Opal and Carruthers, 1977). The bright comet West 1976 VI was studied from rocket flights and OAO 3 Copernicus satellite, whence the discovery of CO(= 151 nm), S(181.4 nm), CS (- 258 nm) and CO2+ (- 289 nm) emissions and the achievement of an extended spectrum (Fig. 2) (Smith et al., 1980 ; Feldman and Brune, 1976). Also Copernicus observations of the Ly a line shape in Kobayashi-Berger-Milon 1975 IX demonstrated the existence of two velocity distributions for H, produced by photodissociation of both H20 and OH. itself a photodissociation product of H20 (Festou et al., 1979).
O tom 2200 2i;c 2600 naa,
WAVELENGTH ( 8 )
Fig. 2
-
Ultraviolet spectra of comet West 1976 VI observed by Feldman and Brune (1976) on 5 march 1976 from a sounding rocket. The transmission at Ly a was attenuated to prevent scattered light from masking weaker features. The Cl, 01, CII. CO, SI, CO+, CS, CO2+ and OH emission features were clearly visible.Last but not least, IUE (International Ultraviolet Explorer) has been available since january 1978 for cometary observations, with a capability of detecting in the 115-340 nm spectral range (low dispersion mode with 1.2
-
1.8 nm resolution and-
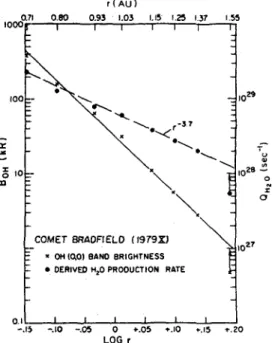
10" X 20" aperture) comets whose visual magnitude is greater than 10. No bright comet like Bennett or West was observable during the last decade, but nearly 25 comets have been monitored (Weaver et al, 1981 a ; Feldman. 1983, 1984). This large set includes a relatively bright comet comparable to Halley (Bradfield, 1979 X), faint old periodic comets (PIEncke 1980 XI, PIEncke 1984 VI), earth approaching comets (IRAS-Araki-Alcok 1983 VII, Sugano-Saigusa -Fujikawa 1983 V) or distant and dusty comets (Bowell 1982 1, Cernis 1983 XII).Among significant discoveries was the identification of C2 bands (- 231 nm) in the spectrum of Bradfield, which provides a convenient way to correlate ultraviolet with visible observations (A'Hearn and Feldman, 1980). Also Bradfield wcs the first comet for which ultraviolet 0bse~ations were made on a relatively large range of heliocentric distances ; the derived water production rate showed an unexpectedly strong variation (Fig. 3). decreasing as R -3.7 for 0.71 au < R < 1.55 au (Weaver et al., 1981 b). A major discovery has also been that of S2 (- 305 nm) in the inner coma of IRAS-Arakl-Alcok while the comet was only at 0.032 au from the earth. The spatial distribution and the short Idet~rne imply that S2 is a parent molecule, with a production rate about I O - ~ times smaller than the water's one ; the species is an ideal tracer of short term nucleus activity ; its existence is in agreement w~th Greenberg "bird nest" model (1982) of cometary ice accreted from interstellar grains with irradiat~on processed organic mantles (A'Hearn et al., 1983 ; Feldman et al., 1984 ; A'Hearn and Feldman, 1985).
Table 1 presents a summary of the atoms, radicals and ions identified through ultraviolet spectroscopy, together with the wavelength and associated transition (Wyckoff, 1982). All comets have fairly similar spectra. The cosmically abundant elements (H, C,
N.
0, S) are well represented ; the N line at 120 nm is likely to be masked by the bright Ly a feature. The analysis of the H and OH obsewations firmly establishes that water is the dominant parent molecule. The situation is more complex for the carbon compounds (Festou, 1984). Some emissions, like those of Cl, CO, CO+ or CO2+, are found to vary widely from one comet to another; ; the Q(C)/Q(OH) production rates ratio varies from approx~rnately 0.005 for the "old" comets up to 0.5 for the "young" ones ; this suggest that the structure of the nucleus is not homogeneous. Also, CO as a parent molecule seems to be able to account for the measured abundances of the carbon compounds ; however, when the Cl production rate is considered, an alternative source of C atoms has to be found. It was therefore suggested that cometary dust could d~ffer from interplanetary dust collected in the earth stratosphere (carbonaceous chondrites) and contain the mlssing carbon (Delsemme, 1982).JOURNAL
DE
PHYSIQUE
a
0
COMET BRAOFt EL0 / 1979x1
1oZ7
OH (QO) EAND BRIGHTNESS
DERIVED H,O PROOUCTION RATE
0.1
l 0
-
0 +.05 *.l0 +.I5 t.20LOG r
Fig. 3
-
Evolution versus heliocentric distance of the H 2 0 production rate of comet Bradfield 1979 X, as derived by Weaver et al. (1981 b) from the OH brightness recorded by IUE satellite. The presence of a dust coma, of nucleus inhomogeneities, of seasonal effects, etc, could have significantly steepen the heliocentric variation of the gas production rate.TABLE 1
OBSERVED SPECIES I N ULTRAVIOLET COMETARY SPECTRA SPECIES CHARACTERISTIC BAND OR LINE (m) TRANSITION
REMOTE UV SPECTROSCOPY OF HALLEY
A large number of remote sensing ultraviolet programs had been planned for the 1985-1986 apparition of Halley. Of great interest would have been the Astro I mission (Feldman, 1983) which would have been flown on board space shuttle in march 1986 in order to provide a complete spectral coverage from 50 nm to 320 nm with an optimum balance between spectral and spatial resolution. The main results of the 0 b S e ~ a t i 0 n ~ actually performed, after the Challenger disaster, either on board sounding rockets or on board satellites are summarized below.
The NASA sounding rockets flights have allowed far ultraviolet observations of Halley to be made, wifh improved versions af the instruments that had been used for rocket observations of Kohoutek (Opal et al., 1974). The first flight took place on 24 february 1986, only 17 days after perlhellon and the last one on 13 march 1986. precisely 13 hours prior to Giotto encounter with Halley. The payloads consisted of a far ultraviolet objective spectograph combined with a Ly a camera and of a far ultraviolet long-slit spectrograph (McCoy et al., 1986 a ; Woods et al., 1986 a).
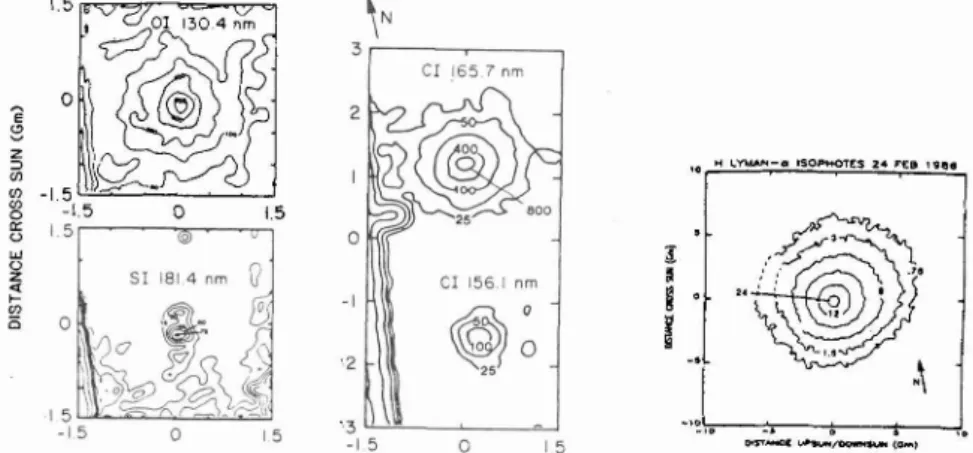
The objective grating spectograph (123-200 nm) had a 12" square field of view, with a spatial resolution of 1' and a spectral resolution of 0.1 nm (Carruthers, 1979). Brightness contours of the 0, C or
S images are reproduced on Fig. 4, together with the Ly a isophotes obtained by the camera. Assuming a radial outflow model, the production rates can be determined, when distances to the nucleus are much smaller than the scale length of the loss process. For Ly a emission, a mean outflow velocity of about 8 km S-' is derived from the shin of Ly a isophotes caused by solar radiation pressure ; on 13 march 1986, a hydrogen production rate of 1.4 X lo30 atom S-l is obtained, which (assuming that all H comes from H20) yields a water production rate of 7 X 1 0 molecules S-l. ~ ~ For 0, C and S, outflow velocities of the order of 1 km S-' are assumed ; the production rates are found to be of the order of 1030, lo2' and 1 0atoms ~ ~ S-' respectively (McCoy et al., 1986 b ; Opal et al.. 1987).
Fig. 4
-
lsophote contours of 01, SI, Cl (in R) and of Ly a (in kR) images of comet Halley obtained by Opal et al. (1987) and by McCoy et al. (1986 a) on 24 february 1986 from sounding rocket observations. The sun is to the left; the ,scale is in 106 m ; the vertical streaks on the left of the 0, S and C images are from the spectrum of .r Cap.The long slit spectograph (120-175 nm) consisted of a 0.4 m Dall-Kirkham telescope, a Rowland circle spectrograph and a slit jaw camera (Hartig et al., 1980). The spectral resolution was 1.2 nm and the spatial resolution 10" ; during both flights, the entrance slit was cantered on the brighest paf
of the coma, with the long axis (7.7') along the Sun-comet line. The central coma spectra are reproduced on Fig. 5. The extended and bright features are HI, 01 and Cl ; other features include the emissions from C11 and the CO fourth ositive system with at least 11 bands ~dentified. On 13 march 1986, the derived production rate is 6 X 10²' molecules S-' for H20. The analysis of the observed radial CO distribution shows that the profile can be modelled for a CO parent molecule. However, as suspected from previous cometary observations, a difference remains between the observed radial distribution of C and the predicted one ; the discrepancy can be resolved with an additional source of carbon from the nucleus or from the coma (Woods et al., 1985, 1986 b).
The ultraviolet spectrum of Halley was monitored with IUE satellite between 12 september 1985 and 8 july 1986 (R < 2.6 au pre and post perihelion) at regular time intervals except between 1 january and 8 march 1986, when the cometary solar elongation was too small. The first ultraviolet spectrum of Halley ever recorded was obtained on 12 september 1985. Daily observations were made during the week of the Vega 2 and Giono encounters.
Cl-30
JOURNAL
DE
PHYSIQUE
Fig. 5
-
Ultraviolet spectra of the central coma of Halley recorded by Woods et al. (1986 b)on 26 february 1986 (R = 0.69 au) and on 13 march 1986 (R 0.89 auf from rocket observations. The dots figure the synthetic CO spectrum, convolved to the instrument resolution.
Typical spectra are reproduced on Fig. 6. Some unexpected reddening appeared In the solar spectrum reflected by cometary grains, while the emission features did not show any previously undetected cometary species. As a matter of fact, the main goal of the IUE Halley program was to determine some production rates, together with their evolution versus time. For 13 march 1986, typical values derived from Hasev and Festou models are 5.2 x 10²' molecules S-' for H 2 0 and about
lo2',
1 0 and ~
loZ7
~ molecules S-' respectively for CO, CS and S p . The water production rate, as given on Fig. 7, is found not to follow a simple power law and to be asymetric with respect to perihelion (Festou and Feldman, 1987). The water production rate can be inte rated over the september 1985 - july 1986B
period ; the total H 2 0 loss is estimated to be about 3 X 10 tons (Festou et al., 1986 ; Feldman et al.,
1987
:
Wallis and Krishna Swamy. 1987).WAVELENGTH (A)
Fig. 6
-
Typical spectra of Halley observed by Feldman et al. (1987) on 12 September 1985(R = 2.6 au, long wavelength spectrum) or on 9 march 1986 (R = 0.83 au, short wavelength spectrum) from IUE satellite.
+ pm-perihelion
x post-perihelion
Fig. 7
-
Evolution versus heliocentric distance of the H20 production rate of comet Halley, as derived by Festou and Feldrnan (1987) from IUE observations. The production rate increasesAlthough the spatial and temporal coverage given by IUE was limited, some significant fluctuations could be detected. On 18-19 march 1986, a strong CO2+ (-; 289 nm) emission, at a flux comparable to that of OH, was detected in the coma on the tailward side ; the CO2+ feature was absent on the sunward side. This outburst may have been the source of the clumps of CO+ emission recorded in the plasma tail by various ground based observers on 19 march (Feldman et al., 1986b). From 23 to 25
march 1986, large gradual increases in the coma abundances of OH, CS and COC were observed ; the change in the continuum followed the same trend. Such an activity may originate in gas and dust ejection from an active region on the rotating nucleus (McFadden et al., 1987).
The ultraviolet spectrum (150 - 350 nm) was also monitored from the soviet space station Astron in december 1985, april 1986 and june 1986, with a spatial resolution of 1' and a spectral resolution of 2.8 nm (Boyarchuk et al., 1986). In early april, the water yoduction rate is 4.9 X
molecules S-'; its variation follows a law before perihelion and a R* law after perihelion.
At its perihelion. when Halley was almost impossible to observe from the earth, obsewations could be performed from the Pioneer Venus orbiter (Colin, 1979). The on-board ultraviolet spectrometer made systematic measurements from 28 december 1985 to 6 january 1986, and again from 31 january to 7 march 1986. The effective field of view was 1.4' X 2.2' and the spectral resolution was 1.4 nm. Production rates derived for H 0, C can be found in Fig.8 ; the average rates in february 1986 are 2.7 X
1030, 1.9 X and 2 X atoms s - l respectively, yielding a Q(O)/Q(H) ratio of about 0.7 and a
Q(C)IQ(H) ratio of about 0.07. It should be pointed out that a periodic 7.4 days variation is found in the data and that the water production rate (up to 1.7 X 1030 mol&cules S-') agrees very well with that obtained from IUE in december 1985 (Stewart, 1987).
ATOMIC PRODUCTION RATES
L- 31.01 I 8 I i HYDROGEN
-
OXYGEN CARBON5
.82 5 -30 4 0 50 60 7 0 DAY OF YEAR 1986Fig. 8
-
Evoluticrn versus time of the production rates of H (circles), 0 (triangles) and C (crosses), as derived by Stewart (1987) from Pioneer Venus observations af Halley.IN-SITU OBSERVATIONS OF HALLEY
The encounter of Halley with a swarm of spacecraft took place in early march 1986, while the comet was crossing the ecliptic plane at its descending node, approximately 1 month after perihelion. The Halley's distance to the Sun was about 0.9 au ; its distance to the earth was about 0.96 au and the relative velocities of the spacecraft to the comet were of the order of 70 km S-'. (Hirao and Itoh, 1986 ;
Sagdeev et al., 1986 ; Reinhard, 1986). The japanese spacecraft Suisei probed the hydrogen halo (distance to the nucleus
-
150 000 km on 8 march). The soviet spacecraft Vega 1 and Vega 2 flew inside the coma (8900 km on 6 march ; 8000 km on 9 march). The european spacecraft Giotto encountered successfully the inner coma (600 km on 14 march). Only TKS experiment on board Vega had been devoted to ultraviolet spectral observations of Halley ; its results are summarized below. All the observations of the about forty in-situ experiments provide a ground-truth for remote observations made at the same time, just as well as for past or future remote 0 b s e ~ a t i 0 n ~ of comets ; their main results are briefly mentionned.The TKS experiment was a combination of three spectrometers : ultraviolet (120
-
290 nm), near-ultraviolet and visible (275-715 nm) and infrared (950-1 900 nm).The Vega 1 instrument has been unsuccessful and the Vega 2 ultraviolet channel did not function. Nevertheless, hundreds of near ultra-violet spectra were recorded in the inner coma on 9 march 1986, with a spatial resolution never achieved before (Krasnopolsky et al., 1986; Moreels et al., 1985, 1986).
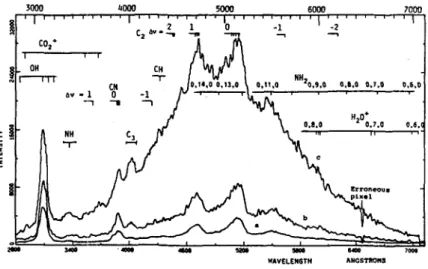
The near-ultraviolet and visible channel consisted of a 0.1 m Cassegrain telescope, a concave holographic grating and a microchannel plate with a linear array detector. It had a spatial resolution of 0.5' and a spectral resolution of 7 nm (Gogoshev et al., 1985). The optical axis was centered at about
Cl-32
JOURNAL
DE
PHYSIQUE
2" from the center of brightness of the comet ; the instrument scanning system could allow the slit (0.5' X 26') to explore in 15 steps the 0-10 000 km region around the nucleus (Parisot et al., 1987). Typical spectra are reproduced on Fig. 9 with' OH and NH bands clearly visible on the left side. The colour of the dust continuum was found to present fluctuations in the inner coma and the dust distribution showed a spatial structure. The OH emission was stable in the inner coma (600-1500 km from the nucleus) and decreased for an impact parameter smaller than 600 km, possibly due to the high optical thickness of water vapor at Ly a. On 9 march 1986, the OH production rate was in a 9 X
lo2'
to 1.4 X 1 030 molecules S-' range, depending on the model used (Moreels et al., 1987 ; Krasnopolsky and Tkachuk, 1986).WAVELENGTH I U G S t m m S
Fig. 9
-
Typical spectra of Halley obtained by Moreels et al. (1986) on 9 march 1986' from Vega space probe. Spectrum a was recorded at r = 405 600 km from the nucleus, with an impact parameter p of 15 600 km ; spectrum b was obtained for r = 152 600 km. p = 5 000 km ; spectrum c was obtained for r = 59 600 km, p = l040 km.The series of in-situ observations probing the cometary coma have confirmed that water Is the dominant compound in cometary ice. About 80% of the volatile fraction of Halley are H 2 0 molecules ; minor species could be CO, CO2, CH4, HCN, H2C0, H2C02 ... (Krankovsky et al.. 1986). Polymerized formaldehyde, formed by irradiation of a mixture of H 2 0 and CO2 ices, seems indeed to have been detected by the ion cluster composition analyser on board Giono (Huebner et al., 1987).
While the deuterium and hydrogen Lya lines have not been spectrally separated by lack of very high resolution ultraviolet spectrography (A1 = 0.03 nm), the ODIOH ratio has been reported to be smaller than 4 X 1 0 ~ ~ from IUE observations of comet Austin 1982 VI at high dispersion mode (A'Hearn et al., 1985). The DIH ratio has been derived from the observations of the neutral gas mass spectrometer on board Giotto (Eberhard et al., 1987). It could be in a 0.6 X I O - ~
-
4.8 x range, which corresponds to an enrichment factor of at least 3 with respect to the protosolar ratio. Such an enrichment occurs on earth, and the DIH ratio is indeed one of the critical parameters for the various cosmogonical models.The most spectacular results of the space missions to Halley have been those of the cameras. from which the size, shape, albedo, and activity of the nucleus have been derived (Keller et al., 1987 ;
Keller, 1987 ; Sagdeev et al., 1986). However, some of the most surprising results may have been those of the dust experiments, and specially of the dust mass spectrometer on-board Vega (Kissel et al., 1986 ; Kissel and Kruger, 1987 ; Vaisberg et al., 1986 ; Mazets et al., 1986 ; McDonnell et al., 1986 ; Levasseur-Regourd et al., 1986). The dust population is found to be very heterogeneous in size, density, distribution and composition. Many of the dust grains seem to be submicron particles, with a chondritic silicate core, and an organic mantle formed of C, H. 0 , N atoms. This is in agreement with in s ~ t u and ground based observations of CN jets in Halley's coma, which could be formed by volatiles directly released from the surface of the grains (A'Hearn et al., 1986). A considerable part of the spectroscopically observed C atoms may indeed come for the dust grains, which solves the carbon puzzle previously mentionned.
SUMMARY
More than 10 years have passed since the space missions to comet Halley have been considered. The current knowledge of the composition of cometary nuclei was then largely inferred from spectroscopic observations ; from ultraviolet 0bSe~ations of the huge H and OH halo, it appeared that the gas and dust production was controlled by water sublimation ; the production rate was inferred to be about 102' molecules S-l at l au, or even more for a very active comet. Comets had long been
assumed to be frozen remnants of the primeval solar system ; the purpose of the space missions was mainly to study a cometary nucleus and to measure some elemental abundances or isotopic ratios characteristics of the early solar system. Halley was chosen because of its well known orbit and its great activity.
Comet Halley turned out to be most active and variable. The successfull Suisei, Vega and Giotto missions demonstrated that the cometary models were quite realistic. Of great interest was the comparison of the complementary in situ mass spectrometry measurements-(which have some mass ambiguities) and remote spectroscopy obsewations (which select the fluorescent species). Elemental ratios of the order of 1.4 for HI0 and 0.1 for C/O were found ; the DIH ratio was in a 1-4 X 1 0 - ~ range. The question of the carbon depletion was solved by the discovery of organic compounds in the dust grains ; the "CHON" particles are assumed to vaporize slowly, then producing an extended source of gas around the nucleus.
It is likely that some relatively unaltered interstellar grains with organic mantles are released from cometary nuclei. Learning more about those grains would be a significant advance for astrophysics. Future space missions to comets are indeed under discussion. Giono (extended mission) could fly-by comet Grigg-Skjellerup on 10 july 1992; CRAF (Comet Rendez-Vous Asteroid Fly-By) could study comet Tempel 2 from its aphelion in november 1996 to its perihelion in september 1999, with a set of about 20 experiments, including an X-ray fluorescence spectrometer and a y ray spectrometer ; CNSR-Rosetta (Comet Nucleus Sample Return) could, in the early
xxlSt
century, land on a comet nucleus, take samples, and return them in refrigerated state for study in terrestrial laboratories...
And in a nearer future, extreme ultraviolet spectrophotometers, spectrometers with higher spectral resolution, and further laboratory studies should be available to improve our understanding of comets from ultraviolet spectroscopy.The author whishes to thank F. Bely-Dubau for having suggested this review. Comments on the manuscript by J.L. Bertaux and R. Dumont are greatfully acknowledged.
REFERENCES
A'Hearn, M.F. and Feldman, P.D. 1980.
AstroDhvs..,
242, L 187.A'Hearn, M.F., Feldman, P.D., Schleicher, D.G. 1983.
Astroobvs..,
274, L 99.A'Heam, M.F. and Feldman, P.D. 1985. Ices in the
solarsvstem.
NATO AS1 series C, 156, 463. A'Hearn, M.F., Schleicher,D.G.,
West, R.A. 1985.m.,
297, 826.A'Hearn, M.F., Hoban, S., Birch, P.V., Bowers, C., Martin, R., Klingensmith Ill, D.A. 1986. Nature, 324, 649.
Bertaux, J.L., Blamont, J.E., Festou, M. 1973. Astr-., 25, 415. Biermann, L. 1951,
Z
.
.
29, 274.,
Biermann, L. 1968.
U
report n098.Boyarchuk, A.A., Grinin, V.P., Zvereva, A.M., Sheihet, A.I. 1986. -E of Hallev's cornet, ESA SP 250, 111, 193.
Carruthers, G.R. 1979, proc.
SPIF
172, 304.Code, A.D., Houck, T.E., Lillie, C.F. 1972. c-
. .
results from 04QZ , NASA SP 310, 109.Colin. L. 1979. 203, 743
Delsemme, A.H. 1982.
Comets.
University of Arizona Press, 85.Eberhard, P., Dolder, U., Schulte, W., Krankovsky, D., Llmmerzahl, P., Hoffman, J.H., Hodges, R.R., Berthelier, J.J., Illiano, J.M. 1987. w o n . A n . 187, 435.
Feldman, P.D. 1982.
Comets
,
University of Arizona Press, 461. Feldman, P.D. 1983.Science
,
219, 348Feldman, P.D. 1984.
-.
,
4, 9, 177.Feldman, P.D., Takacs, P.Z., Fastie, W.G., Donn, B. 1974.
Science.
185, 705.Feldman, P.D., Opal. C.B., Meier, R.R., Nicolas, K.R. 1976. -v of C-, NASA SP 393, 773.
Feldman, P.D. and Brune, W.H. 1976.
m.,
209, L 45. Feldman, P.D., A'Hearn, M.F., Millis, R.L. 1984.AstroDhvs..,
282, 799.Feldman, P.D., Festou. M.C., A'Hearn, M.F., Arpigny, C., Butterworth, P.S., Cosmovici, C.B., Danks, A.C., Gilmozzi, R., Jackson, W.M., McFadden, L.A., Patriarchi, P., Schleicher, D.G., Toui, G.P., Wallis, M.K., Weaver, H.A., Woods, T.N. 1987. &Won. AstrLQPhYS. 187, 325.
Festou, M. 1981. m r o n .
-.,
95, 69. Festou, M.C. 1984.Adv..,
4, 9, 165.Festou, M.C., Jenkins, E.B., Keller, H.U., Barker, E.S., Bertaux, J.L., Drake, J.F., Upson, W.L. 1979.
Cl-34
JOURNAL
DE
PHYSIQUE
Festou, M.C.. Feldman, P.D.. A'Hearn, M.F., Arpigny, C., Cosmovici, C.B., Danks, A.C., McFadden. L.A., Gilmozzi, R., Patriarchi, P. Tozzi, G.P., Wallis, M.K., Weaver, H.A. 1986.
m
321, 361. Festou, M.C. and Feldmar~, P.D. 1987.Scientific
of the IUE, D. Reidel, 101. Finson, M.L. and Probstein, R.F., 1968, -., 154, 327.Gogoshev, M., Gogosheva, T., Sargoichev, S., Palasov, K., Georgiev, A., Kostadinov. I., Kanev, K., Spasov, S., Werner, R., Mendev, I., Moreels, G., Clairemidi, J., Vincent, M., Mougin, B., Parisot, J.P., Zucconi, J.M., Festou, M., Lepage, J.P.. Runavot, J., Bertaux, J.L., Blamont, J.E., Hers4 M., Kranopolsky, V.A., Moroz, V.I., Krysko. A.A., Troshin. V.S., Barke, V.V., Jegulev. V.S., Sanko, N.F., Tomashova, G.V., Parshev. V.A., Tkachuk, A.Y.. Novikov, B.S., Perminov, V.G., Sulakov, I.I., Fefororr, O.S.1985186. M ~ a cR=., e 5, 12, 133.
Greenberg, J.M. 1982.
.
University of Arizona Press, 131. Greenstein, J.E. 1958.A
s
.
,
128, 106.Hartig, G.F., Fastie, W.G., Davidsen, A.F. 1980. 19, 729. Haser, L. 1966. SW. Rov. I ibaa, 5. 12, 233.
Hirao, K. and Itoh, T. 1986.
m
321, 294:Huebner, W.F., Boice, D.C., Sharp, C.M., Korth, A., Lin, R.P., Mitchell. D.L., Rbme, H. 1987. of CM&?&, ESA SP 278, 163.
Huggins, W. 1982. Proc.
-.,
33, 1 Keller, H.U. 1973.&-.,
27, 51. Keller, H.U. 1976.W m . ,
18, 641.Keller, H.U.' 1987. PjYaLStv and
. . .
of cpmats, ESA SP 278, 447.Keller. H.U., Delamere, W.A., Huebner, W.F., Reitsema, H.J., Schmidth, H.U., Whipple. F.L., Wilhelm, K., Curdt, W., Kramm, R., Thomas, N., Arpigny, C., Barbieri, C., Bonnet, R.M., Cares, S., Coradini, M., Cosmovici, C.B., Hughes, D.W., Jamar, C., Malaise, D., Schmidt, K., Schmidt,
W.K.H.,
Seige, P. 1987. Astron. Astrp- 187, 807.Kissel, J., Sagdeev, R.%., Bertaux, J.L., Angarov, V.N., Audouze. J., Blamont, J.E., Bitchler, K., Evlanov, E.N., Fechtig. H., Fomenkova, M.N., von Hoerner, H., Inogamov, N.A., Khromov, V.N., Knabe, W., Krueger, F.R., Langevin, Y., Leonas, V.B., Levasseur-Regourd, A.C., Managadze, G.G.,
Podkolzin, S.N., Shapiro, V.D., Tabaldyev, S.R., Zubkov, B.V. 1986.
Nature,
321, 280. Kissel, J. and Krueger, F.R. 1987. 326, 755.Krankovsky, D., Lamerzhal, P. Herrwerth, I., Woweries, J. Eberhardt, P., Dolder, U,, Herrmann, U,, Schuite, W., Bertherlier, J.J., Illiano, J.M., Hodges, R.R., Hoffman, J.H., 1936. Nature, 321, 326. Krasnopolsky, V.A., Gogoshev, M., Moreels. G., Moroz, V.!., Krysko, A.A., Gogosheva, T., Palazov,
K.,
Sargoichev, S., Clairemidi, J., Vincent, M., Bertaux, J.L., Blamont, J.E., Troshin, V.S., Vanicek, B. 1986.W
321, 269.Krasnopolsky, V.A. and Tkachuk, A.Y. 1986. E m nof Hallev's comet, ESA SP 250, 1, 465. Levasseur-Regourd, A.C., Bertaux, J.L.. Dumont, R., Festou, M., Giese, R.H., Giovane, F., Lamy, P., Le
Blanc, J.M., Llebaria, A., Weinberg, J.L. 1986.
m
321, 341.Mazets. E.P., Aplekar, R.L.. Golenetskii, S.V., Guryan, Y.A., Dyachkov, A.V., Ilynskii, V.N., Panov, V.N., Petrov, G.G., Savvin, A.V., Sagdeev, R.Z., Sokolov, I.A., Khavenson. N.G., Shapiro, V.D., Shevchenko, V.I., 1986. W 321, 280.
McCoy, R.P., Opal, C.B., Carruthen, G.R. 1986 a. E, - ESA SP 250, 1, 403.
McCoy, R.P., Opal, C.B., Carruthers, G.R. 1986 b. 324, 439.
McDonnell, J.A.M., Alexander, W.M., Burton. W.M., Bussoletti. E., Clark, D.H., Grard. R.J.L.. Gritn, E., Hanner, M.S., Hughos, D.W., Igenbergs. E., Kuczera, H., Lindblad, B.A., Mandeville. J.C., Minafra, A., Schwehm, G.H., Sekanina, Z.. Wallis, M.K., Zarnecki, J.C., Chakaveh, S.C., Evans, G.C., Evans, S.T., Firth, J.G., Littler, A.N., Massonne, L., Olearczyk, R.E., Pankiewicz, G.S.. Stevenson, T.J., Turner, R.F. 1986.
m,
321, 338.McFadden, L.A., A'Hearri, M.F., Feldman, P.D., Roetger, E.E.. Edsall. D.M., Butterworth, P.S. 1987.
LWLQCI.
Astr-., 187, 333.Moreels, G., Vincent, M., Clairemidi, J., Mougin, B., Parisot. J.P., Zucconi, J.M., Bertaux, J.L., Blamont, J.E.. Hersft, M., Chalon, G.. tepage, J.P.. Runavot, J., Krasnopolsky, V.A., Moroz, V.I., Krysko, A.A., Troshin, V.S., Barke, V.V., Jegulev, V.S., Sanko, N.F., Tomashova, G.V., Parshev. V.A., Tkachuk, A.Y., Novikov, B.S., Perminov, V.G.. Sulakov. 1.1.. Fedorov, O.S., Gogoshev, M., Gogosheva, T., Sar(joichev, S., Palasov, K., Georgiev, A., Kostadinov. I., Kanev, K., Spasov, S., Werner, R., Mendev, D., Vanicek, B., Vanycek, V., 1985185. U e Res., 5, 12, 137. Moreels, G., Gogoshev, M., Krasnopolsky, V.A., Clairemidi.
M.,
Vincent, M., Parisot, J.P., Bertaux,J.L., Blamont, J.E., I=estou, M.C., Gogosheva, T., Sargoichev, S., Palasov, K., Moroz, V.I., Krysko. A.A., Vanysek, V. 1986,
Nature.
321, 271.Moreels, G., Clairernidi, J., Parisot, J.P., Zucconi, J.M., Bertaux, J.L., Blamont, J.E., Hers4, M., Krasnopolsky, V.A., Moroz, V.I., Krysko, A.A., Tkachuk, A.Y., Gogoshev, M., Gogosheva, T., Werner, R., Spasov, S. 1987. b t r o n . A s t r w . , 187, 551.
Opal, C.B., Carruthers, G.R., Prinz, D.K., Meier, R.R. 1974. Science. 185, 702. Opal, C.B. and Carruthers, G.R. 1977.
a
31, 503.Opal, C.B., McCoy R.P., Carruthers, G.R. 1987. ,&#onn A-., 187, 320. Oppenheirner, M. and Downey, C.J. 1980.
Astroohvs.
241, L 123.Parisot, J.P., Zucconi, J.M., Festou, M.C., Moreels, G., Clairemidi, J., Krasnopolsky, V.A., Moroz, V.I.,
8 n-u,Z'h?-k:'r.. %XS,=BR,''~:L'., LI~~SS~IS~S.E'.., IaS~rd;140~.$ JdyuS;wCW: Q b y v S ; ~ h ? ' ? 3 0 a T , r .'OQ7
Reinhard, R. 1986. 321, 313.
Sagdeev, R.Z., Blamont, J., Galeev, A.A.. Moroz, V.I., Shapiro, V.D., Shevchenko. V.I., Szegb, K. 1986.
m
321, 259.Schwartzschild, K. and Kron, E. 1911.
m.,
34, 342.Smith, A.M., Stecher, T.P., Casswell, L. 1980.
m.,
242, 402.Stewart, A.I.F. 1987. A s t r w . , 187, 369.
Swings, P. 1941. J ick Obs. R u . , XIX, 408, 131.
Swings, P., Elvey, C.T., Babcock, H.W. 1941.
AstroDhvs..,
94, 320.Vaisberg, O.L., Smirnov, V.N., Gorn, L.S., lovlev. M.V., Balikchin, M.A., Klimov, S.I., Savin, S.P.. Shapiro, V.D., Shevchenko, V.I. 1986.
Nature.
321, 274.Wallis, M.K. and Krishna Swamy, K.S. 1987. &iron. Astr-., 187, 329.
Weaver, H.A., Feldman, P.D., Festou, M.C., A'Hearn, M.F., Keller, H.U. 1981 a.
IEBLUS,
47, 449.Weaver, H.A., Feldman, P.D., Festou, M.C., A'Hearn, M.F. 1981 b.
AstroDhvs..,
251, 809.Whipple, F.L. 1950.
BstroDhvs.
1 1 l , 375.Woods,
T.N.,
Feldman, P.D., Dymond, K.F., Sahnow, D.J. 1985188. Adv.W m . ,
5, 12, 289.Woods, T.N., Feldman, P.D., Dymond, K.F., 1986 a. -1Iev's C Q I , ESA SP 250, 1, 431.
Woods, T.N., Feldman, P.D., Dymond, K.F., Sahnow, D.J. 1986 b.
m
324. 436.Wurm, K. 1934.