HAL Id: hal-00298927
https://hal.archives-ouvertes.fr/hal-00298927
Submitted on 12 Feb 2008HAL is a multi-disciplinary open access
archive for the deposit and dissemination of sci-entific research documents, whether they are pub-lished or not. The documents may come from teaching and research institutions in France or abroad, or from public or private research centers.
L’archive ouverte pluridisciplinaire HAL, est destinée au dépôt et à la diffusion de documents scientifiques de niveau recherche, publiés ou non, émanant des établissements d’enseignement et de recherche français ou étrangers, des laboratoires publics ou privés.
Discharges of past flood events based on historical river
profiles
D. Sudhaus, J. Seidel, K. Bürger, P. Dostal, F. Imbery, H. Mayer, R. Glaser,
W. Konold
To cite this version:
D. Sudhaus, J. Seidel, K. Bürger, P. Dostal, F. Imbery, et al.. Discharges of past flood events based on historical river profiles. Hydrology and Earth System Sciences Discussions, European Geosciences Union, 2008, 5 (1), pp.323-344. �hal-00298927�
HESSD
5, 323–344, 2008 Discharges from historical river profiles D. Sudhaus et al. Title Page Abstract Introduction Conclusions References Tables Figures ◭ ◮ ◭ ◮ Back CloseFull Screen / Esc
Printer-friendly Version Interactive Discussion Hydrol. Earth Syst. Sci. Discuss., 5, 323–344, 2008
www.hydrol-earth-syst-sci-discuss.net/5/323/2008/ © Author(s) 2008. This work is distributed under the Creative Commons Attribution 3.0 License.
Hydrology and Earth System Sciences Discussions
Papers published in Hydrology and Earth System Sciences Discussions are under open-access review for the journal Hydrology and Earth System Sciences
Discharges of past flood events based on
historical river profiles
D. Sudhaus1, J. Seidel2,4, K. B ¨urger2, P. Dostal3, F. Imbery3, H. Mayer3, R. Glaser2, and W. Konold1
1
Institute for Landscape Management, Albert-Ludwigs-University Freiburg, Germany
2
Department of Physical Geography, Albert-Ludwigs-University Freiburg, Germany
3
Meteorological Institute, Albert-Ludwigs-University Freiburg, Germany
4
Institute for Hydraulic Engineering, Department of Hydrology and Geohydrology, University of Stuttgart, Germany
Received: 20 December 2007 – Accepted: 3 January 2008 – Published: 12 February 2008 Correspondence to: J. Seidel ([email protected])
HESSD
5, 323–344, 2008 Discharges from historical river profiles D. Sudhaus et al. Title Page Abstract Introduction Conclusions References Tables Figures ◭ ◮ ◭ ◮ Back CloseFull Screen / Esc
Printer-friendly Version Interactive Discussion
Abstract
This paper presents a case study to estimate peak discharges of extreme flood events of Neckar River in south-western Germany during the 19th century. It was carried out within the BMBF research project RIMAX (Risk Management of Extreme Flood Events). The discharge estimations were made for the flood events of 1824 and 1882
5
based on historical cross profiles. The 1-D model Hydrologic Engineering Centers River Analysis System (HEC-RAS) was applied with different roughness coefficients. The results are compared (i) with contemporary historical calculations and (ii) in the case of a flood event in 1824 with the discharge simulation by the water balance model LARSIM (Large Area Runoff Simulation Model). These calculations are matched by
10
the HEC-RAS simulation based on the standard roughness coefficients.
1 Introduction
The reconstruction of historical flood events represents an important subject for mod-ern flood risk management. The estimation of discharges for historical extreme flood events extents existing discharge data series and improves statistical calculations,
15
e.g. for the determination of return periods as well as for a better assessment of ex-treme flood events. The identification and quantification of historical flood events will also provide answers to the question whether frequency and magnitude of floods have increased during the past few centuries. For a well-founded flood-frequency analy-sis, the magnitude of the peak discharge of historical floods must be quantified (Cook,
20
1987). Therefore, the inclusion of historical data considerably improves the reliability of calculations of return periods for extreme flood events (IKSE, 2004; Payrastre et al., 2005).
Major damaging floods in Europe (e.g. Oder, 1997; Elbe, 2002 and 2006; Danube, 2006) resulted in a general interest in increasing flood risk and flood risk management.
25
Cen-HESSD
5, 323–344, 2008 Discharges from historical river profiles D. Sudhaus et al. Title Page Abstract Introduction Conclusions References Tables Figures ◭ ◮ ◭ ◮ Back CloseFull Screen / Esc
Printer-friendly Version Interactive Discussion tral Europe. Therefore, the flood risk is expected to increase in the future for specific
regions like Northern, Central and Eastern Europe (KLIWA, 2003; IPCC, 2007). Addi-tionally, the number of people and economic assets located in flood endangered areas is expected to increase further, resulting in a higher damage potential. Flood risk map-ping can reduce potential economic and health damages and raise the risk awareness
5
in the general population. For planners and engineers, extreme flood events are of high interest, although they are very rare in observational records (Enzel et al., 1993).
The knowledge of peak discharges represents the basis for flood area mapping. Flood level marks alone give insufficient information about the severity of a flood since hydraulic engineering may have influenced the stage-discharge relation over the course
10
of time. Historical calculations of the discharge often appear not to be reliable (Pohl, 2007). In historical times as well as today, the data for the largest floods have frequently been indirect post-flood estimations. This is due to the fact that conventional stream gauge stations have great difficulties to record extreme floods accurately, since they may be inundated, damaged or destroyed (Benito et al., 2006).
15
Discharge measurements during flood conditions are very important, but were ex-plicitly difficult to determine in historical times. Between 1867 and 1897, the effort to improve discharge measurements was increased, e.g. for the development of open channel flow resistance equations (Hager, 1994). Many of the historical discharge calculations cited in this paper originate from this time. Therefore, the informational
20
value of these historical data must be examined before they can be used for statistical calculations, e.g. return times.
B ¨urger et al. (2006) calculated the discharge of the Neckar River for the 1824 ex-treme flood event using historical meteorological measurements and the water balance model LARSIM (Ludwig and Bremicker, 2006). Kidson et al. (2002), Barriendos and
25
Coeur (2004), Thorndycraft et al. (2005) and Thorndycraft et al. (2006) used histori-cal flood marks and recent cross sections of bedrock channels for the estimation of palaeodischarges.
HESSD
5, 323–344, 2008 Discharges from historical river profiles D. Sudhaus et al. Title Page Abstract Introduction Conclusions References Tables Figures ◭ ◮ ◭ ◮ Back CloseFull Screen / Esc
Printer-friendly Version Interactive Discussion and tributaries during the 19th century is tested using historical cross profiles.
Further-more, these results were compared to historical discharge calculations and simulations with the LARSIM model (B ¨urger et al., 2006).
2 Study area
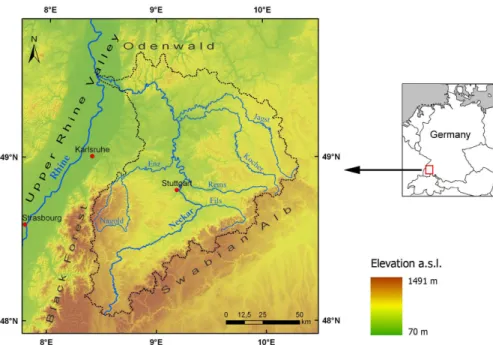
The Neckar River with a catchment area of 14 000 km2is located in the south-western
5
part of Germany and is a tributary of the Upper Rhine (Fig. 1). The Neckar has a length of 367 km and originates in the Eastern Black Forest at an elevation of 706 m a.s.l. The river passes through the cities of T ¨ubingen, Stuttgart, Heilbronn, Heidelberg and Mannheim, where it discharges into the Rhine. Its main tributaries are the rivers Fils, Rems, Enz, Kocher and Jagst. The Neckar is also the river with the largest
catch-10
ment area in the federal state of Baden-W ¨urttemberg (south-western Germany). To-day, 202.5 km of the Neckar are navigable between Plochingen and Mannheim at the river mouth. Together with Rhine and Main rivers, the Neckar is one of the three main waterways in Baden-W ¨urttemberg.
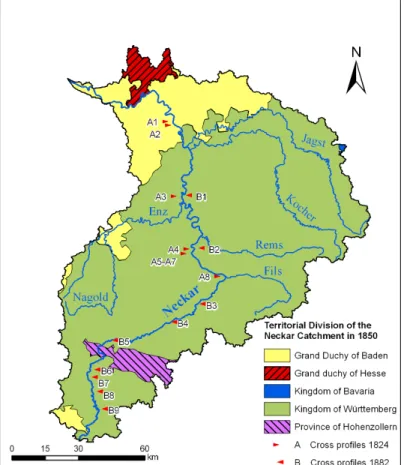
During the 19th century, the area of the Neckar catchment was divided between
15
five territorial states: The Grand Duchy of Baden, the Kingdom of W ¨urttemberg, the Prussian Province of Hohenzollern, the Grand Duchy of Hesse and the Kingdom of Bavaria (Fig. 2). The latter three only held minor percentages of the catchment area and the main channel of the Neckar River was situated in the former Grand Duchy of Baden and the former Kingdom of W ¨urttemberg. Therefore, most hydraulic engineering
20
measures were primarily carried out and documented by these two states.
The first gauging station at the Neckar River was installed in Heilbronn in 1827 (Centralbureau f ¨ur Meteorologie und Hydrographie, 1889). Continuous and system-atic measurements of the water levels at six gauging stations were carried out from 1881 onwards (Statistisch-Topographisches Bureau, 1883). At present 17 gauging
25
stations are installed along the Neckar. In the lower course of the Neckar River be-tween Heidelberg and Mannheim, the mean, minimum and the mean flood discharges
HESSD
5, 323–344, 2008 Discharges from historical river profiles D. Sudhaus et al. Title Page Abstract Introduction Conclusions References Tables Figures ◭ ◮ ◭ ◮ Back CloseFull Screen / Esc
Printer-friendly Version Interactive Discussion are 145 m3s−1, 42 m3s−1and 1150 m3s−1, respectively (LfU, 2005).
3 Material and methods
Different sources such as archive records and administrative reports from 19th century authorities where examined for suitable river cross profiles (Table 1). A number of cross profiles with various hydrological parameters were generated during the 19th century
5
through the course of hydro-engineering measures to achieve better navigability and technical flood risk management along the Neckar River system. All historical profiles chosen for the discharge calculations in this study met the following criteria:
– information about the water level,
– specification of the elevation (water level and/or river bed),
10
– channel slope in the river section,
– water levels must not exceed the cross profile, – no bridges and/or weirs to avoid backwater effects.
For the flood events of 1824 and 1882, discharges were calculated using eight and nine river cross profiles, respectively, along the Neckar River (Fig. 2 and Table 1).
15
In the case of the 1824 flood event, the profiles used to calculate the discharges are situated between Plochingen (historical river km 212) and Obrigheim (river km 82). The last major inflows are the rivers Kocher and Jagst at river km 100. Therefore, the cross profiles at Obrigheim are representative for the lower course of the Neckar. For the Stuttgart section of the Neckar River, three suitable and exceptionally detailed cross
20
profiles (profiles A5–A7 in Table 1 and Fig. 2) could be identified based on a historical record found in the City Archive of Stuttgart (1877).
HESSD
5, 323–344, 2008 Discharges from historical river profiles D. Sudhaus et al. Title Page Abstract Introduction Conclusions References Tables Figures ◭ ◮ ◭ ◮ Back CloseFull Screen / Esc
Printer-friendly Version Interactive Discussion The cross profiles for the 1882 flood event are located between Rottweil (river km
344) and Gemmrigheim (river km 137). In this case, there is no information available about discharges in the lower course of the Neckar after the inflow of the rivers Kocher and Jagst. At two profiles (M ¨unster and Gemmrigheim, Table 1) there are water stages for both floods.
5
The selected cross profiles were digitized and the distances were converted from historical to SI-units. The discharge calculations were carried out using the 1-D hy-draulic model HEC-RAS 3.1.3 (Hydrologic Engineering Center, 2005). Previously, this model has been used successfully for palaeoflood studies (O’Conner and Webb, 1987; Kidson et al., 2002; Benito et al., 2004; Thorndycraft et al., 2006). For the calculation
10
of discharges, the single cross profiles were regionalized and the particular river slope was derived from the historical longitudinal profile of the Neckar River.
The most uncertain variable is the roughness coefficient (Manning’s n; Cook, 1987). For example, a 50% error in the roughness coefficient results in a maximum error of 25% in the upper end of the rating curve (Sauer et al., 1984). For a difference of
15
50% in the roughness coefficient, Kidson et al. (2002) calculated a discharge error of 40% for a palaeoflood in a bedrock river. The channel conditions during floods (scour, fill, debris), however, are not known (Cook, 1987). For the adjacent flood plain, the uncertainty factor is higher due to changes in the vegetation cover. Especially for such flood plains where the historical land use is not known, this could have a significant
20
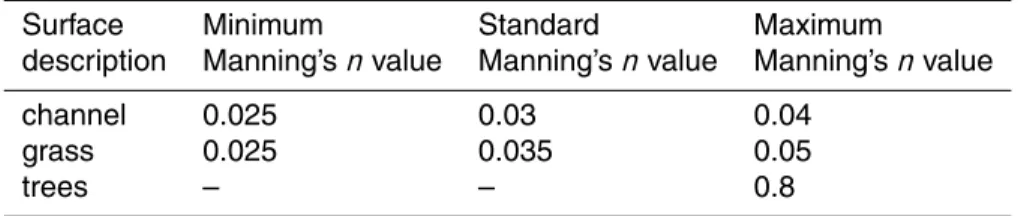
effect. Therefore, a range of roughness coefficients (Manning’s n) was used in this study, obtained by default values (Table 2). For the river bed, a standard value of 0.03 was used, which corresponds to the roughness coefficient found in historical hydraulic engineering documents. For flooded areas outside the river bed, where no land use information and roughness coefficients were available, a high grass cover vegetation
25
or the upper limit of short grass cover with a roughness coefficient of 0.035 for the standard value was assumed.
The standard Manning’s n for the river bed is nearly the same as mentioned in histor-ical administrative reports for tributaries of the Neckar river. The specified roughness
HESSD
5, 323–344, 2008 Discharges from historical river profiles D. Sudhaus et al. Title Page Abstract Introduction Conclusions References Tables Figures ◭ ◮ ◭ ◮ Back CloseFull Screen / Esc
Printer-friendly Version Interactive Discussion coefficients in historical times were calculated with the Ganguillet-Kutter equation (1),
where v=flow velocity, n=roughness coefficient, R = profile radius and J=water sur-face slope (K ¨onigliches Ministerium des Innern 1896).
v= 1 n+ 23 + 0,00155 J 1 + (23 +0,00155J ) n √ R p RJ (1)
A calibration of the model was not possible because the stage-discharge relations are
5
not known for the historical cross profiles. The discharges were calculated as sub-critical flow conditions. The HEC-RAS model uses the Mannig-Strickler equation for discharge estimation. In contrast, the historical discharges were calculated according to Harlacher’s graphical method (K ¨onigliches Ministerium des Innern 1896).
Because the profiles are not associated to gauging stations, the indicated historical
10
water level could potentially represent the level of the wash of the waves (energy head) and therefore overestimate the actual water level. Therefore, in the diagrams (Figs. 3– 6) discharge values were also computed by using the energy line (EL) with the standard roughness. The discharges using the water surfaces (WS) were computed with three different roughness values (Table 2).
15
4 Results of discharge calculations along the Neckar for the 1824 and 1882 floods
4.1 Examples from greater Stuttgart Profile Stuttgart-Cannstatt:
A cross profile and the stage-discharge in Stuttgart (Neckar River) is presented in
20
Fig. 3. The flow discharge calculated on the basis of the standard Manning’s n for 1824 ranges from 1610 m3s−1 (energy line) to 2070 m3s−1 (Fig. 5). Since the cross
profile originates from the year 1877, there is no water stage available for the 1882 flood event.
HESSD
5, 323–344, 2008 Discharges from historical river profiles D. Sudhaus et al. Title Page Abstract Introduction Conclusions References Tables Figures ◭ ◮ ◭ ◮ Back CloseFull Screen / Esc
Printer-friendly Version Interactive Discussion Profile M ¨unster:
Figure 4 displays the cross profile of the Neckar at M ¨unster (5 km downstream of Stuttgart) at historical river km 186.47 and the corresponding stage-discharge curve determined with HEC-RAS. The figure shows the difference between the energy line and the water level as stage-discharge relations for the 1824 and the 1882 flood.
5
The 1824 flow discharge ranges from 1800 m3s−1 (EL) to 2170 m3s−1 (WS). The
dis-charges computed with high and low roughness values range from 1430 to 3100 m3s−1
(both for the WS). The historical discharge determined by the official water authorities at the time is 1700 m3s−1(K ¨onigliches Ministerium des Inneren, 1896). The calculated
discharge for the 1882 flood event and standard Manning’s n ranges from 1140 m3s−1
10
(EL) to 1500 m3s−1 (WS). The historical calculated discharge amount is 1250 m3s−1
and falls within this range. The calculation with minimum and maximum Manning’s n values results in a discharge of 910 m3s−1 and 2100 m3s−1, respectively.
4.2 Overview of the results obtained for the Neckar River
Figure 5 shows the results of the discharge calculations using HEC-RAS for the 1824
15
flood between river kilometre 80 and 220 and the historical calculations. In addition, the simulated discharges from B ¨urger et al. (2006) for the 1824 flood event and the discharge values for the current extreme flood (EHQ; LfU, 2005) are depicted. Since there are no documented water stages from any cross profiles further upstream, this particular river section was omitted in Fig. 5a. Due of the short distances between
20
the cross profiles at Stuttgart (km 180) this section is magnified (Fig. 5b). For this section, the results from the HEC-RAS simulation using the EL and WS with standard roughness parameters match the historical calculations. Generally, this applies also for the whole Neckar River (Fig. 5a), except for the profile at Gemmrigheim (A3, river km 137), where all HEC-RAS simulations are much higher than the discharges from
25
historical sources and the LARSIM model.
Figure 6 shows the results of the discharge calculations using HEC-RAS for the 1882 flood in comparison with the historical calculations. Since the availability of historical
HESSD
5, 323–344, 2008 Discharges from historical river profiles D. Sudhaus et al. Title Page Abstract Introduction Conclusions References Tables Figures ◭ ◮ ◭ ◮ Back CloseFull Screen / Esc
Printer-friendly Version Interactive Discussion data in the former Kingdom of W ¨urttemberg is generally better in the second half of
the 19th century, the profiles for this flood event are distributed more evenly along the Neckar River. In contrast, there are no cross profiles available at all for the river section in the former Grand Duchy of Baden, resulting in the discontinuation of the diagram at river km 100. Except for the profiles B8 and B9 (Table 1) in the upper course of the
5
Neckar, where the flow area is relatively small, the discharges derived with HEC-RAS using the EL and WS with standard Manning’s n correspond well with the values from the administrative reports (Fig. 6).
5 Discussion of the results
Discharge calculations from four different sources are available for three cross profiles
10
in Stuttgart:
1. record 2577 from the City Archive of Stuttgart from 1877,
2. administrative report from the Interior Ministry of the Kingdom of W ¨urttemberg (K ¨onigliches Ministerium des Innern, 1896),
3. discharge simulation with the run-off model LARSIM (B ¨urger et al., 2006, 2007),
15
and
4. calculations with HEC-RAS based on historical profiles from record 2577, City Archive Stuttgart.
Compared to the historical calculations for 1824 (a) at Stuttgart (Fig. 5, river km 189– 187, 1370 m3s−1), the streamflow from all HEC-RAS simulation runs (d) as well as
20
the results from LARSIM (c) and the discharges from the administrative report (b) are higher. This example shows that a critical assessment of sources is necessary and it is inevitable to analyse all available historical data. The calculations from the adminis-trative reports (b), with a value of 1700 m3s−1 for this site, are similar to the results of
HESSD
5, 323–344, 2008 Discharges from historical river profiles D. Sudhaus et al. Title Page Abstract Introduction Conclusions References Tables Figures ◭ ◮ ◭ ◮ Back CloseFull Screen / Esc
Printer-friendly Version Interactive Discussion the present study (1410–2380 m3s−1) and identical with the EHQ (LfU, 2005). B ¨urger
et al. (2006) reconstructed the hydrometeorological conditions of the 1824 flood event and simulated the resulting discharges with the current hydrological conditions of the Neckar River system (c). The flood discharge for this river section is approximately 1420 m3s−1 and thus matches the value simulated with HEC-RAS using the energy
5
line and standard Manning’s n (d). Generally, the 1824 flood discharges simulated with LARSIM tend to underestimate the actual peak flood discharges, because the input data for this simulation was only available in daily resolution.
For the cross profile at M ¨unster (river km 186), B ¨urger et al. (2006) determined a discharge of approximately 1700 m3s−1. The calculations using HEC-RAS are within
10
a range of 1430 to 3100 m3s−1 depending on the roughness values and again
dis-charge according to the energy line (1800 m3s−1) with standard Manning’s n is the
value matching the LARSIM results. In comparison, the current HQ 100 determined by the water authorities for this site is about 1200 m3s−1 (LfU, 2005).
The two discharges for the 1824 flood event obtained from historical cross profiles in
15
the Grand Duchy of Baden range from 2500 to 5900 m3s−1. The discharge using the
water level and standard roughness is 4250 m3s−1 for both profiles and using the
en-ergy line 4010 and 4080 m3s−1, respectively .Thus, the flood discharge at this site was
far higher than the current EHQ of 3600 m3s−1for the nearest current gauging station
near Ebersbach-Rockenau at river km 60 (LfU, 2005). This discrepancy reflects the
ex-20
treme magnitude of the 1824 flood event, especially in the lower course of the Neckar River, which is also documented in the historical sources (B ¨urger et al., 2006). The flood of 1824 was the most extreme along the Neckar River within the last 300 years and reached its highest water levels after the inflow of the river Enz at km 140. Based on the presented results, the historical discharges for the 1824 flood recorded by the
25
local water authorities in the former Kingdom of W ¨urttemberg (K ¨onigliches Ministerium des Innern, 1896) and the Grand Duchy of Baden (Centralbureau f ¨ur Meteorologie und Hydrographie, 1993) are plausible.
HESSD
5, 323–344, 2008 Discharges from historical river profiles D. Sudhaus et al. Title Page Abstract Introduction Conclusions References Tables Figures ◭ ◮ ◭ ◮ Back CloseFull Screen / Esc
Printer-friendly Version Interactive Discussion Unfortunately there were no historical cross profiles of the corresponding water
lev-els available for the 1882 flood event for the lower section of the Neckar River in the Grand Duchy of Baden. The only available historical source (Centralbureau f ¨ur Meteo-rologie und Hydrographie, 1893) states a discharge of about 3000 m3s−1for the city of
Heidelberg (river km 26) which is slightly higher than the current HQ 100 (LfU, 2005)
5
and seems to correspond to the intensity of the flood in this river section. Throughout the course of the Neckar River, the flood event of 1882 reached the intensity of the current HQ 100 and was lower than the flood in 1824.
For the 1824 flood, the temporal span between the actual flood event and the time of the survey, when the cross profiles were mapped, can reach up to 50 years,
de-10
pending on the source of the cross profiles. Hence, we have to take into account that the historical discharge values for 1824 were approximated and the water levels were reconstructed since there were no gauging stations in operation at the time. There-fore, the indicated water level also could be related to the energy level of the cross profile, which Thorndycraft et al. (2006) also assumed for estimating palaeodischarges
15
by sediment records. Figure 5 shows no significant correlation between EL or WS and the historical calculated discharges or the LARSIM results, respectively. Therefore, both values have to be taken into account when working with historical sources which were not derived at gauging stations. This is also the case of the 1882 flood event, al-though the discharge calculations were generally more sophisticated at this time, since
20
there were several gauging stations in service. Nevertheless, the results allow no clear statement whether the EL or WS is the more suitable value for discharge calculations using historical data. Concerning the roughness parameters, the standard Manning’s
nproduces the most feasible results.
6 Conclusions
25
The present paper completes the historical flood analysis presented by B ¨urger et al. (2006, 2007) for the Neckar River. The presented study shows that it is
gener-HESSD
5, 323–344, 2008 Discharges from historical river profiles D. Sudhaus et al. Title Page Abstract Introduction Conclusions References Tables Figures ◭ ◮ ◭ ◮ Back CloseFull Screen / Esc
Printer-friendly Version Interactive Discussion ally possible to estimate the discharge of historical floods using historical documents
and to obtain details about the course and quality of a flood event. The results of this study and the historical discharges as well as the LARSIM results are comparable, so this method can be used to verify historical discharge calculations and, when no his-torical calculations are available, to obtain the discharges. By using various hishis-torical
5
profiles, it is possible to cover large parts of a river course and recognize possible sys-tematic errors in the sources. Hence, it is not reliable to use only a few cross profiles or data sources within a river system to obtain reliable information concerning a historical flood.
The 1824 event was the most extreme flood in large parts of the Neckar River, but the
10
magnitude of the flood is not reflected by the current EHQ. The results from this study can contribute towards a better flood risk management in river catchments, because the knowledge about historical flood processes leads to a better understanding of flood processes.
Acknowledgements. The authors would like to thank the BMBF (German Federal Ministry of
15
Education and Rresearch) and the Federal State Ministry of Science, Research and Arts in Baden-W ¨urttemberg for funding. Furthermore, the authors thank the General State Archive Karlsruhe and the City Archive Stuttgart for the permission to scan and publish historical records. We would also like to thank T. Strahl for proof-reading and corrections.
References
20
Barriendos, M. and Coeur, D.: Flood data reconstruction in historical times from non-instrumental sources in Spain and France, in : Systematic, Palaeoflood and Historical Data for the Improvement of Flood Risk Estimation, edited by: Benito G. and Thorndycraft, V. R., CSIC, Madrid, Spain, 29–42, 2004.
Benito, G., Lang, M., Barriendos, M., Llasat, M.C., Franc ´es, F., Ouarda, T., Thorndycraft, V.R., 25
Enzel, Y., Bardossy, A., Coeur, D., and Bob ´ee, B.: Use of Systematic, Palaeoflood and Historical Data for the Improvement of Flood Risk Estimation, Review of Scientific Methods, Nat. Hazards, 31, 623–643, 2006.
HESSD
5, 323–344, 2008 Discharges from historical river profiles D. Sudhaus et al. Title Page Abstract Introduction Conclusions References Tables Figures ◭ ◮ ◭ ◮ Back CloseFull Screen / Esc
Printer-friendly Version Interactive Discussion
B ¨urger K., Dostal P., Seidel J., Imbery F., Barriendos M., Mayer H., and Glaser R.: Hydrom-eteorological reconstruction of the 1824 flood event in the Neckar River basin (southwest Germany), Hydrolog. Sci. J., 51, 864–877, 2006.
B ¨urger, K., Seidel, J., Glaser, R., Sudhaus, D., Dostal, P., and Mayer, H.: Extreme floods of the 19th century in southwest Germany, Houille Blanche, 1/2007, 67–73, 2007.
5
Centralbureau f ¨ur Meteorologie und Hydrographie: Die Wassermengen der fliessenden Gew ¨asser im Großherzogthum Baden, Beitr ¨age zur Hydrographie des Grossherzogthums Baden, 8. Heft, Berlin, Germany, 1893.
Centralbureau f ¨ur Meteorologie und Hydrographie: Der Rheinstrom und seine wichtigsten Nebenfl ¨usse, Karlsruhe, Germany, 1889.
10
City Archive Stuttgart: Cannstatt Verwaltungsakten. Hochwasser (u. ¨Uberschwemmungen) 1824–1884–1894, Mit Situationspl ¨anen und Zeichnungen zu den ¨Uberschwemmungen 1824 und 1845, City Archive Stuttgart, Germany, record 2577, 1877.
Generallandesarchiv Karlsruhe: Querprofile des Neckars unterhalb Neckarsteinach und un-terhalb Diedesheim. Generallandesarchiv Stuttgart, record G Wasserbaupl ¨ane 1 Ab 2 Nr. 4 15
Bl ¨atter 2 + 4, unknown date.
Cook, J. L.: Quantifying peak discharges for historical floods, J. Hydrol., 96, 29-40, 1987. Enzel, Y., Ely, L. L., House, P. K., Baker, V. R., and Webb, R. H.: Palaeoflood evidence for a
natural upper bound to flood magnitudes in the Colorado River basin, Water Resour. Res., 29, 2287–2297, 1993.
20
Hager, W.: Die historische Entwicklung der Fließformel, Schweizer Ingenieur und Architekt, 9, 123–133, 1994.
Hydrologic Engineering Center: Hydrologic Engineering Centers River Analysis System (HEC– RAS), available at:http://www.hec.usace.army.mil/software/hec-ras/hecras-hecras.html, ac-cess: 5 March 2007, 2005.
25
IKSE, Internationale Kommission zum Schutz der Elbe: Dokumentation des Hochwassers vom August 2002 im Einzugsgebiet der Elbe, available at: http://www.ikse-mkol.org, access: 5 March 2007, 2004.
IPCC: Climate Change 2007 – Impacts, Adaptation and Vulnerability, Contribution of Working Group II to the Fourth Assessment Report of the IPCC, Cambridge University Press, New 30
York, USA, 2007.
Kidson, R., Richards, K. S., and Carling, P. A.: Hydraulic model calibration using a modern flood event: The Mae Chaem river, Thailand, Proc. PHEFRA Workshop, Barcelona, Spain,
HESSD
5, 323–344, 2008 Discharges from historical river profiles D. Sudhaus et al. Title Page Abstract Introduction Conclusions References Tables Figures ◭ ◮ ◭ ◮ Back CloseFull Screen / Esc
Printer-friendly Version Interactive Discussion
Oct 2002.
KLIWA: Report on the national project KLIWA (Klimaver ¨anderung und Wasserwirtschaft), avail-able at:http://www.kliwa.de, access: 10 March 2004, 2003.
K ¨onigliches Ministerium des Innern: Verwaltungsbericht der K ¨oniglichen Ministerialabteilung f ¨ur den Strassen- und Wasserbau f ¨ur die Rechnungsjahre vom 1. Februar 1893/94 und 5
1894/95, Stuttgart, Germany, 1896.
K ¨onigliches Ministerium des Innern: Verwaltungsbericht der K ¨oniglichen Ministerialabteilung f ¨ur den Strassen- und Wasserbau f ¨ur die Rechnungsjahre vom 1. Februar 1897/98 und 1898/99, Stuttgart, Germany, 1901.
LfU, Landesanstalt f ¨ur Umweltschutz Baden-W ¨urttemberg: Abflusskennwerte in Baden-10
W ¨urttemberg, Oberirdische Gew ¨asser/Gew ¨asser ¨okologie 94, CD-ROM, Karlsruhe, 2005. Ludwig, K. and Bremicker M. (ed.): The Water Balance Model LARSIM – Design, Content and
Applicationes, Freiburger Schriften zur Hydrologie, 22, 130 pp., 2006.
O’Conner, J. E. and Webb, R.: Hydraulic modelling for paleoflood analysis, in: Flood geomor-phology, edited by: Baker, V. R., Kochel, R.C., and Patton, P.C., Wiley, New York, 393–402, 15
1987.
Payrastre, O., Gaume, E., and Andrieu, H.: Use of historical data to assess the occurrence of floods in small watersheds in the French Mediterranean area, Adv. Geosci., 2, 313–320, 2005,
http://www.adv-geosci.net/2/313/2005/. 20
Pohl, R.: Auswertung von Wasserspiegellagenberechnungen mit historischen Datens ¨atzen f ¨ur die Hochwasseranalyse, Wasserwirtschaft, 5/2007, 16–20, 2007.
Sauer, V. B., Curtis, R. E., Santiago, L. R., and Gonzales, R.: Quantifying flood discharges in mountain tropical streams, Int. Symp. Trop. Hydrol. and 2nd Caribbean Islands Water Resour. Congr. Proc., 104–108, 1984.
25
Statistisch-Topographisches Bureau: W ¨urttembergische Jahrb ¨ucher f ¨ur Statistik und Lan-deskunde, Stuttgart, Germany, 1883.
Thorndycraft, V. R., Benito, G., Rico, M., Sope ˜na, A., S ´anchez-Moy, Y., and Casas, A.: A long-term flood discharge record derived from slackwater flood deposits of the Llobregat River, NE Spain, J. Hydrol., 313, 16–31, 2005.
30
Thorndycraft, V. R., Barriendos, M., Benito, G., Rico, M., and Casas, A.: The catastrophic floods of AD 1617 in Catalonia (northeast Spain) and their climatic context, Hydrolog. Sci. J., 51, 899–912, 2006.
HESSD
5, 323–344, 2008 Discharges from historical river profiles D. Sudhaus et al. Title Page Abstract Introduction Conclusions References Tables Figures ◭ ◮ ◭ ◮ Back CloseFull Screen / Esc
Printer-friendly Version Interactive Discussion
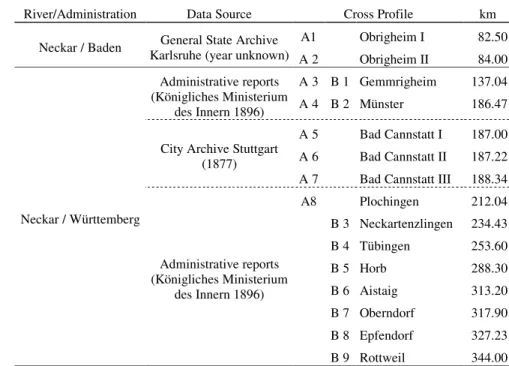
Table 1. Historical sources for cross profiles along the Neckar. Cross profile numbers A=1824,
B=1882.
River/Administration Data Source Cross Profile km A1 Obrigheim I 82.50 Neckar / Baden General State Archive
Karlsruhe (year unknown) A 2 Obrigheim II 84.00 A 3 B 1 Gemmrigheim 137.04 Administrative reports
(Königliches Ministerium
des Innern 1896) A 4 B 2 Münster 186.47 A 5 Bad Cannstatt I 187.00 A 6 Bad Cannstatt II 187.22 City Archive Stuttgart
(1877)
A 7 Bad Cannstatt III 188.34 A8 Plochingen 212.04 B 3 Neckartenzlingen 234.43 B 4 Tübingen 253.60 B 5 Horb 288.30 B 6 Aistaig 313.20 B 7 Oberndorf 317.90 B 8 Epfendorf 327.23 Neckar / Württemberg Administrative reports (Königliches Ministerium des Innern 1896) B 9 Rottweil 344.00
HESSD
5, 323–344, 2008 Discharges from historical river profiles D. Sudhaus et al. Title Page Abstract Introduction Conclusions References Tables Figures ◭ ◮ ◭ ◮ Back CloseFull Screen / Esc
Printer-friendly Version Interactive Discussion
Table 2. Assigned Manning’s n values for hydraulic modelling.
Surface Minimum Standard Maximum
description Manning’s n value Manning’s n value Manning’s n value
channel 0.025 0.03 0.04
grass 0.025 0.035 0.05
HESSD
5, 323–344, 2008 Discharges from historical river profiles D. Sudhaus et al. Title Page Abstract Introduction Conclusions References Tables Figures ◭ ◮ ◭ ◮ Back CloseFull Screen / Esc
Printer-friendly Version Interactive Discussion
HESSD
5, 323–344, 2008 Discharges from historical river profiles D. Sudhaus et al. Title Page Abstract Introduction Conclusions References Tables Figures ◭ ◮ ◭ ◮ Back CloseFull Screen / Esc
Printer-friendly Version Interactive Discussion
Fig. 2. Historical administrative districts in the Neckar catchment area and sites of the cross
HESSD
5, 323–344, 2008 Discharges from historical river profiles D. Sudhaus et al. Title Page Abstract Introduction Conclusions References Tables Figures ◭ ◮ ◭ ◮ Back CloseFull Screen / Esc
Printer-friendly Version Interactive Discussion
Fig. 3. Cross profile A5 from Stuttgart (Neckar River) with the stage-discharge curve and energy line (standard Manning’s n) during the highest stage of the 1824 flood.
HESSD
5, 323–344, 2008 Discharges from historical river profiles D. Sudhaus et al. Title Page Abstract Introduction Conclusions References Tables Figures ◭ ◮ ◭ ◮ Back CloseFull Screen / Esc
Printer-friendly Version Interactive Discussion
Fig. 4. Historical cross profile at M ¨unster (A4/B2) (K ¨onigliches Ministerium des Innern, 1896)
with the stage-discharge curve and energy line (standard Manning’s n), indicated water stages for the floods of 1824 and 1882.
HESSD
5, 323–344, 2008 Discharges from historical river profiles D. Sudhaus et al. Title Page Abstract Introduction Conclusions References Tables Figures ◭ ◮ ◭ ◮ Back CloseFull Screen / Esc
Printer-friendly Version Interactive Discussion
Fig. 5. (a) Discharges for the Neckar during the flood of 1824 from historical administrative
documents (K ¨onigliches Ministerium des Innern, 1896), discharges simulated with historical cross profiles, LARSIM simulation by B ¨urger et al. (2006) and the current EHQ (LfU, 2005); (b) magnification for Stuttgart (km 189–186).
HESSD
5, 323–344, 2008 Discharges from historical river profiles D. Sudhaus et al. Title Page Abstract Introduction Conclusions References Tables Figures ◭ ◮ ◭ ◮ Back CloseFull Screen / Esc
Printer-friendly Version Interactive Discussion
Fig. 6. Discharges for the Neckar during the flood of 1882 from historical administrative
doc-uments (K ¨onigliches Ministerium des Innern, 1896), discharges simulated with historical cross profiles and the current HQ 100 (LfU, 2005).