Spectral modelling of the α Virginis (Spica) binary system
Texte intégral
Figure
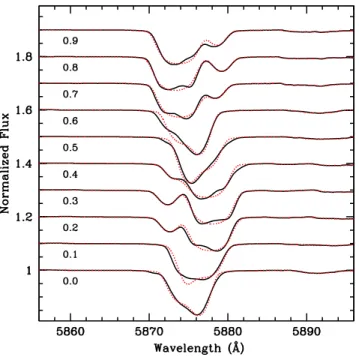
![Fig. 7. The difference between equivalent widths measured on the per- per-turbed and unperper-turbed spectra, ∆(EW)=[EW p -EW u ]/EW u , of the pri-mary star in Spica showing that the effects are ≤ 1.5%, and thus indicat-ing that the interaction effects](https://thumb-eu.123doks.com/thumbv2/123doknet/6128036.156300/6.892.469.821.99.451/difference-equivalent-measured-unperper-showing-effects-indicat-interaction.webp)
Documents relatifs
ﺔﻟﺎطﺑﻟا ةرﻫﺎظﺑ ارﯾﺑﻛ ﺎﻣﺎﻣﺗﻫا , ﺎﻫرﺎﺷﺗﻧا دﻌﺑ لﻛﺷﺑ لﻼﺧ رﯾﺑﻛ .ﺔﯾﻣﻟﺎﻌﻟا ﺔﻣزﻻا زﻧﯾﻛ دﻧرﺎﻧﯾﻣ نوﺟ ضﻓر دﻘﻓ ةرﻛﻓ, نا روﺟﻷا رﯾﻐﺗﻣﻟا ﻲﻫ ﺔﯾﻘﯾﻘﺣﻟا ﻪﺑ ددﺣﺗﯾ يذﻟا دﯾﺣوﻟا
This statement acknowledges the fact that the mother tongue has a great impact on the new language the child is going to learn at school. If we take the case ofAlgeria, The
The simulated CO 2 concentration (ppm) at 16:00 UTC, at the first level of the Meso-NH model (20 m): (a) for the first control simulation and (b) after calibration of the surface
Dans la mesure où le texte littéraire produit, selon Pierre Macherey, un effet de réalité et un effet de fiction, le roman que nous nous proposons d’étudier n’est pas
During Period II the combined particle flow was passed through the CCNC and PCVI when the saturation, 0.25 %, was not sufficient to form droplets that have a size large enough to
Table 4 presents and defines different hydrological measures within five broad groupings of hydrological response, namely; gross water balance, groundwater recharge, base flow
Entre 2003 et 2005, une enquête annuelle spécifique a été adressée à 18 000 entreprises de toutes tailles, dont 7 000 de moins de 10 salariés : un questionnement particulier, commun
Elles sont moins présentes dans les TPE de l’artisanat où elles représentent 34,5 % des salariés, et largement majoritaires dans les autres TPE avec une part s’élevant à 57,3
