HAL Id: hal-00301300
https://hal.archives-ouvertes.fr/hal-00301300
Submitted on 29 Oct 2003HAL is a multi-disciplinary open access
archive for the deposit and dissemination of sci-entific research documents, whether they are pub-lished or not. The documents may come from teaching and research institutions in France or abroad, or from public or private research centers.
L’archive ouverte pluridisciplinaire HAL, est destinée au dépôt et à la diffusion de documents scientifiques de niveau recherche, publiés ou non, émanant des établissements d’enseignement et de recherche français ou étrangers, des laboratoires publics ou privés.
Measurements of reactive chlorocarbons over the
Surinam tropical rain forest: indications for strong
biogenic emissions
H. A. Scheeren, J. Lelieveld, J. Williams, H. Fischer, C. Warneke
To cite this version:
H. A. Scheeren, J. Lelieveld, J. Williams, H. Fischer, C. Warneke. Measurements of reactive chloro-carbons over the Surinam tropical rain forest: indications for strong biogenic emissions. Atmospheric Chemistry and Physics Discussions, European Geosciences Union, 2003, 3 (5), pp.5469-5512. �hal-00301300�
ACPD
3, 5469–5512, 2003Reactive chlorocarbons over the Surinam tropical
rainforest H. A. Scheeren et al. Title Page Abstract Introduction Conclusions References Tables Figures J I J I Back Close
Full Screen / Esc
Print Version Interactive Discussion
© EGU 2003
Atmos. Chem. Phys. Discuss., 3, 5469–5512, 2003 www.atmos-chem-phys.org/acpd/3/5469/
© European Geosciences Union 2003
Atmospheric Chemistry and Physics Discussions
Measurements of reactive chlorocarbons
over the Surinam tropical rain forest:
indications for strong biogenic emissions
H. A. Scheeren1, J. Lelieveld2, J. Williams2, H. Fischer2, and C. Warneke3 1
Institute for Marine and Atmospheric research Utrecht, The Netherlands
2
Max-Planck-Institute for Chemistry, Mainz, Germany
3
NOAA Aeronomy Laboratory, Boulder, Colorado, USA
Received: 11 September 2003 – Accepted: 22 October 2003 – Published: 29 October 2003 Correspondence to: H. A. Scheeren (h.a.scheeren@phys.uu.nl)
ACPD
3, 5469–5512, 2003Reactive chlorocarbons over the Surinam tropical
rainforest H. A. Scheeren et al. Title Page Abstract Introduction Conclusions References Tables Figures J I J I Back Close
Full Screen / Esc
Print Version Interactive Discussion
© EGU 2003 Abstract
Contrary to the understanding of the emissions and chemical behavior of halocar-bons from anthropogenic sources (e.g. CFCs and HCFCs), the biogeochemistry of naturally emitted halocarbons is still poorly understood. We present measurements of chloromethane (methyl chloride, CH3Cl), trichloromethane (chloroform, CHCl3),
5
dichloromethane (CH2Cl2), and tetrachloroethylene (C2Cl4) from air samples taken over the Surinam rainforest during the 1998 LBA/CLAIRE campaign. The samples were collected in stainless steel canisters on-board a Cessna Citation jet aircraft and analyzed in the laboratory using a gas chromatograph equipped with FID and ECD. The chlorocarbons we studied have atmospheric lifetimes of ∼1 year or less, and
ap-10
pear to have significant emissions from natural sources including oceans, soils and vegetations, as well as biomass burning. These sources are primarily concentrated in the tropics (30◦N–30◦S). We detected an increase as a function of latitude of methyl chloride, chloroform, and tetrachloroethylene mixing ratios, in pristine air masses ad-vected from the Atlantic Ocean toward the central Amazon. In the absence of
signifi-15
cant biomass burning sources, we attribute this increase to biogenic emissions from the Surinam rainforest. From our measurements, we deduce fluxes from the Surinam rain-forest of 7.6±1.8 µg CH3Cl m−2h−1, 1.11±0.08 µg CHCl3 m−2h−1, and 0.36±0.07 µg C2Cl4m−2h−1. Extrapolated to a global scale, our emission estimates suggest a large potential source of 2 Tg CH3Cl yr−1 from tropical forests, which could account for the
20
net budget discrepancy (underestimation of sources), as indicated previously. In addi-tion, our estimates suggest a potential emission of 57±17 Gg C2Cl4yr−1 from tropical forest soils, equal to half of the currently missing C2Cl4 sources. We hypothesize that the extensive deforestation over the last two decades relates to the observed global downward trend of atmospheric methyl chloride.
ACPD
3, 5469–5512, 2003Reactive chlorocarbons over the Surinam tropical
rainforest H. A. Scheeren et al. Title Page Abstract Introduction Conclusions References Tables Figures J I J I Back Close
Full Screen / Esc
Print Version Interactive Discussion
© EGU 2003 1. Introduction
The magnitude of natural sources in the global budgets of reactive organic chlorine species such as chloromethane (methyl chloride, CH3Cl), dichloromethane (CH2Cl2), trichloromethane (chloroform, CHCl3), and tetrachloroethylene (C2Cl4) is still poorly constrained (Khalil et al., 1999; Keene et al., 1999). These reactive organic chlorine
5
species have an atmospheric lifetime from reaction with OH radicals of about 1.3 years for CH3Cl, 0.5 years for CHCl3, 0.4 years for CH2Cl2 and 0.3 years for C2Cl4 (Khalil, 1999). About 60% of the total emissions of reactive organic chlorocarbons (including chlorinated ethanes and ethenes) appear to be natural and concentrated in the trop-ics (Khalil, 1999; Keene et al., 1999). Although the atmospheric budget of reactive
10
chlorocarbons (dominated by CH3Cl) represents only about 15% of the total standing chlorine concentration, these compounds constitute the dominant source of reactive chlorine in the troposphere and lower stratosphere. An understanding of their present budget allows us to assess their role in atmospheric chemistry in the past, in the ab-sence of anthropogenic chlorine sources, and in the future after anthropogenic chlorine
15
has decreased significantly.
The most prominent organic chlorine species is CH3Cl with a present mean background concentration of ∼550 pptv (pptv = mol−12mol) in the extra-tropics and ∼600 pptv in the tropics (Lee-Taylor et al., 2001; Scheeren et al., 2002, 2003; Montzka et al., 2003). CH3Cl is removed from the atmosphere mainly by reaction with the OH
20
radical (3.43 Tg yr−1), and to a lesser extend by reaction with Cl radicals in the ma-rine boundary layer (0.20 Tg yr−1), microbial degradation in soils (0.18 Tg yr−1), loss to polar oceans (0.075 Tg yr−1), and loss to the stratosphere (0.20 Tg yr−1) (Montzka et al., 2003). In the stratosphere CH3Cl contributes to about 17% of present chlorine catalyzed ozone destruction (Harper, 2000). Within a fair degree of uncertainty, about
25
half of the estimated annual global sink of 4 Tg CH3Cl has been accounted for, mainly by emissions from the oceans and biomass burning (Lobert et al., 1999; Lee-Taylor et al., 2001; Montzka et al., 2003). The search for new CH3Cl sources has resulted in the
ACPD
3, 5469–5512, 2003Reactive chlorocarbons over the Surinam tropical
rainforest H. A. Scheeren et al. Title Page Abstract Introduction Conclusions References Tables Figures J I J I Back Close
Full Screen / Esc
Print Version Interactive Discussion
© EGU 2003
identification of emission fluxes from wetlands (Varner et al., 1999), peat land (Dimmer et al., 2001), coastal waters (Li et al., 1999), coastal salt marshes (Rhew et al., 2000; Bill et al., 2002), and from forest soils (Dimmer et al., 2001). These emission fluxes, however, are to small to account for the large discrepancy between known sources and the estimated global sink. Recently, several studies have pointed to higher plants as
5
potential major source of CH3Cl to the atmosphere (Lobert et al., 1999; Khalil et al., 1999; Harper, 2000, Yokouchi et al., 2000). The emission of CH3Cl from higher plants (potato tubers) was first reported by Varns (1982) and later in a laboratory study by Saini et al. (1995), involving herbaceous species and halophytes. Recent observations by Yokouchi et al. (2002), supported by a model study by Lee-Taylor et al. (2001), point
10
to large fluxes of CH3Cl from tropical vegetation. Lee-Taylor et al. (2001) show that observed mixing ratios and latitudinal distributions are best reproduced in their model by addition of a large tropical terrestrial CH3Cl source of the order of 2.3 Gg yr−1, indi-cating that tropical plants might the largest known source.
Besides the search for new CH3Cl sources, there has been a considerable effort to
15
identify and quantify natural sources of the reactive chlorocarbons CHCl3, CH2Cl2and C2Cl4to decrease considerable uncertainties in their global budgets. The atmospheric budget of CHCl3 appears to be dominated by natural emissions from the oceans, re-sponsible for more than half of the known source budget (Keene et al., 1999). Fur-thermore, there have been extensive studies pointing to significant CHCl3fluxes from
20
forest soils related to bio-degradation processes involving fungi (Watling and Harper, 1998; Hoekstra et al., 1998, 2001; Haselmann et al., 2000a, 2000b). In addition, natu-ral emissions of CHCl3have been reported from peat land (Dimmer et al., 2001), and from biomass burning (Rudolph et al., 1995; Scheeren et al., 2002). The known source budgets of CH2Cl2and C2Cl4, on the other hand, are for ∼70% and ∼90% determined
25
by industrial emissions (Khalil et al., 1999; McCulloch et al., 1999). Natural sources include CH2Cl2 and C2Cl4 emissions from the oceans (Keene et al., 1999, and ref-erences therein), and CH2Cl2 emissions from biomass burning (Rudolph et al., 1995; Scheeren et al., 2002). Moreover, Hoekstra et al. (2001) observed a small soil flux of
ACPD
3, 5469–5512, 2003Reactive chlorocarbons over the Surinam tropical
rainforest H. A. Scheeren et al. Title Page Abstract Introduction Conclusions References Tables Figures J I J I Back Close
Full Screen / Esc
Print Version Interactive Discussion
© EGU 2003
C2Cl4 in Douglas fir forest. To our knowledge, there have been no reports of terres-trial biogenic emissions of CH2Cl2. For an extensive review of biogenic formation and degradation processes of organohalogens, not discussed here, we would like to refer to a recent special issue in Chemosphere (2003).
This paper presents measurements of reactive chlorocarbons from air samples
col-5
lected over the rainforest of Surinam, South America, as part of the Large-Scale Biosphere-Atmosphere Experiment in Amazonia Co-operative LBA airborne regional experiment (LBA/CLAIRE) in March 1998. The air samples were collected during 10 measurement flights conducted from Zanderij airport in Surinam (5.4◦N–55.2◦W) using a Cessna Citation II aircraft operated by the Delft University of Technology. The flights
10
covered an area roughly between 2◦N –7◦N and 53◦N–59◦W at altitudes ranging from 50 to 12 500 m. The measurement payload provided in situ observations of ozone (O3), carbon monoxide (CO), carbon dioxide (CO2), methane (CH4), organic tracer species (notably, acetone (CH3COCH3), isoprene, and acetonitrile (CH3CN)), and aerosols. In total, 80 air samples were collected for laboratory analyses on non-methane
hydrocar-15
bons (NMHC) and chlorocarbons. Detailed analyses of the trace gas distributions of acetone, isoprene, CO and CO2during LBA/CLAIRE have been reported by P ¨oschl et al. (2001), Warneke et al. (2001), and Williams et al. (2001b), respectively. Part of the NMHC results has been included in a study on the variability-lifetime relationship of or-ganic trace gases by Williams et al. (2001a), and in a study focusing on a high altitude
20
biomass burning plume by Andreae et al. (2001). Here, we focus on measurements of the chlorocarbons CH3Cl, CH2Cl2, CHCl3, and C2Cl4, which have been analyzed in concurrence with measurements of NMHC, CO, and acetonitrile over the Surinam rainforest.
Apart from the coastal region were the majority of the population of about 400.000
25
people resides, Surinam is covered by pristine Amazonian rain forest. Hence, our chlorocarbons measurements provide new information on the role of tropical rain forest ecosystems as natural source of chlorocarbons to the atmosphere. The measurements are used to estimate fluxes of chlorocarbons from the Surinam tropical rainforest, and to
ACPD
3, 5469–5512, 2003Reactive chlorocarbons over the Surinam tropical
rainforest H. A. Scheeren et al. Title Page Abstract Introduction Conclusions References Tables Figures J I J I Back Close
Full Screen / Esc
Print Version Interactive Discussion
© EGU 2003
estimate global annual mean emission fluxes from tropical rain forest ecosystems. Fi-nally, we discuss the relationship between observed decreasing trends in atmospheric CH3Cl and global tropical forest cover over the last two decades.
2. Measurement techniques
The measurement techniques employed in this study have all been described in detail
5
elsewhere. Here, we briefly summarize the methods, their precision and accuracy. CO was measured by an airborne Tunable Diode Laser Spectrometer (TDLAS) de-veloped and operated by the Max Planck Institute in Mainz, Germany (Wienhold et al., 1998; Williams et al., 2001b). CO was detected at 1 Hz with an accuracy of ±3% and precision of ±2%.
10
Acetone and acetonitrile were detected by an airborne Proton-Transfer-Reaction Mass-Spectrometer (PTR-MS), which was developed operated by Innsbruck Univer-sity (Lindinger et al., 1998; Crutzen et al., 2000). About 10 masses (including acetone and acetonitrile) could be identified at a time resolution of 10 s. For a detailed inter-pretation of mass scans obtained over the Surinam rainforest we refer to Williams et
15
al. (2001c). The detection limit was 0.4 ppbv for acetone and 0.2 ppbv for acetonitrile. The measurement accuracy was better than ±30%, while the precision was typically ±20% for acetone and ±30% for acetonitrile.
A total of 80 whole air samples were collected in stainless steel canisters between 0.1 to 12.5 km altitude for subsequent laboratory analysis of hydrocarbons and
chloro-20
carbons by a Gas Chromatograph equipped with a Flame Ionization and Electron Capture Detector (GC-FID/ECD). For technical details of the GC-method we refer to Williams et al. (2001a) and Scheeren et al. (2002). The accuracy based on commercial gravimetrically prepared standard mixtures (PRAXAIR) was ±3% for hydrocarbons and ±2% for chlorocarbons. The precision for hydrocarbons > 15 pptv used in this study
25
was 11% for acetylene (C2H2), 5% for propane (C3H8), 7% for n-butane (n-C4H10), 6% for benzene (C6H6). The precision for chlorocarbons was 4% for CH3Cl, 11% for
ACPD
3, 5469–5512, 2003Reactive chlorocarbons over the Surinam tropical
rainforest H. A. Scheeren et al. Title Page Abstract Introduction Conclusions References Tables Figures J I J I Back Close
Full Screen / Esc
Print Version Interactive Discussion
© EGU 2003
CH2Cl2, 5% for CHCl3, and 7% for C2Cl4.
3. Meteorology
During the short dry season from February to April, Surinam lies in the northern meteo-rological hemisphere with the Inter Tropical Convergence Zone (ITCZ) located at a few degrees south. The (short) dry season is generally characterized by low precipitation
5
due to strong subsidence over the region suppressing deep convective activity. March 1998 was a particularly dry month due to the “El Ni ˜no” phenomenon. Northeasterly trade winds carry pristine air masses from the Atlantic Ocean land over the tropical rainforest towards the ITCZ, allowing primary organic emissions and their oxidation products to accumulate.
10
During the day, a dry convective boundary layer is formed, coupling the rainforest canopy to the atmosphere above through turbulent mixing. This layer is referred to as the mixing layer, where emissions from the rainforest build-up. In contrast to the marine conditions, the boundary layer over land has a distinct diurnal cycle driven by solar heating during the day and surface radiative cooling during the night. During
15
night, the daytime mixing layer is decoupled from the surface by a strong temperature inversion. After dawn, the shallow nocturnal mixing layer starts to grow via turbulent mixing, reaching a maximum depth around 1500 m in the afternoon during the dry sea-son (Martin et al., 1988). A shallow convective cloud layer forms above the mixing layer in the course of the day. The convective clouds transport air between the mixing layer
20
and the convective cloud layer. The shallow convective cloud tops generally coincide with the top of the trade wind inversion, which acts as a barrier to mass transport out of the boundary layer to the free troposphere (Martin et al., 1988; Zimmerman et al., 1988).
The typical evolution of the mixed layer height over the Amazon tropical rainforest
25
during the dry season is shown in Fig. 1. The diurnal pattern has been composed from observed temperature inversions in potential temperature profiles from the 1985
ACPD
3, 5469–5512, 2003Reactive chlorocarbons over the Surinam tropical
rainforest H. A. Scheeren et al. Title Page Abstract Introduction Conclusions References Tables Figures J I J I Back Close
Full Screen / Esc
Print Version Interactive Discussion
© EGU 2003
Amazon Boundary Layer Experiment (ABLE 2A) (Martin et al., 1988) and from profiles obtained from ascent and descent with the Citation aircraft during LBA/CLAIRE (Kre-jci et al., 2003). It was found that the depth of the mixing layer during LBA/CLAIRE reached an altitude between 1300 to 1700 m at midday (depicted as a gray band in Fig. 1) in good agreement with the ABLE 2A observations.
5
Deep convection in the ITCZ brings boundary layer (BL) air masses into the middle and upper troposphere, where they can be caught in a southerly return flow. Indeed, outflow from the ITCZ has been clearly observed in the middle troposphere on 19, 21, and 29 March which will be discussed in the next section, and on 26 March, which has been described in detail by Andreae et al. (2001).
10
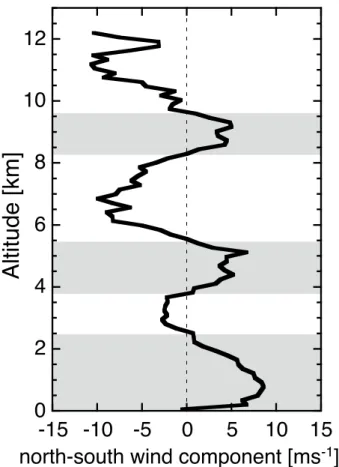
The mean observed north-south wind component for all flights, expressed as the cosine of the wind angle multiplied by the observed wind speed is shown in Fig. 2 (run-ning mean over 1278 points; negative values indicate southerly winds). Northeasterly trade winds prevailed up to about 2.5 km altitude. Southerly winds were generally ob-served in the free troposphere (FT) between 2.5 and 4 km, 5.5 and 8 km, and between
15
8 and 12 km relating to ITCZ outflow. For more details about the meteorology during LBA/CLAIRE we refer to Williams et al. (2001b) and Krejci et al. (2003).
4. Results
4.1. Vertical distributions
Before we focus on the boundary layer measurements we present a general overview
20
of the vertical distributions of chlorocarbons and selected combustion tracers measured simultaneously during March 1998. As such, we show vertical concentration profiles (in pptv) of the reactive chlorocarbons CH3Cl, CH2Cl2, CHCl3, and C2Cl4as detected in all canister samples (80) collected during March 1998 in Fig. 3a. In Fig. 3b, profiles of the combustion tracers CO and CH3CN from in situ measurements, as well as the
hydro-25
ACPD
3, 5469–5512, 2003Reactive chlorocarbons over the Surinam tropical
rainforest H. A. Scheeren et al. Title Page Abstract Introduction Conclusions References Tables Figures J I J I Back Close
Full Screen / Esc
Print Version Interactive Discussion
© EGU 2003
CH3CN data are averaged time series corresponding with the duration of the canister sampling (∼1–3 min). Error bars in Fig. 3 denote the measurement uncertainty, which is larger than the 1σ standard deviation of the mean for CO and CH3CN. Enhanced CO and hydrocarbons (notably acetylene and propane), in combination with enhanced concentrations of the biomass burning tracer CH3CN (Holzinger et al., 1999; Lobert et
5
al., 1990), point to the influence of biomass burning emissions. Elevated concentra-tions of benzene from fossil fuel use and of C2Cl4 from industrial use (a degreasing agent used notably in dry cleaning) are related to urban/industrial pollution. The flights in which the highest tracer concentrations have been observed in the FT between 8 and 12 km altitude are color-coded in Fig. 3, being flight 4 in black (19 March), flight
10
5 in blue (21 March) flight 8 in green (26 March) and flight 10 in red (29 March). In addition to the vertical profiles, an overview of average and median mixing ratios of all air samples collected below 2 km in the mixing layer, between 2–7 km in the lower free troposphere (LT), and above 7 km in the middle free troposphere (MT) is presented in Table 1.
15
Figure 3 and the results in Table 1 demonstrate that besides the boundary layer, the highest mixing ratios (except for CH2Cl2and CHCl3) have been observed above 7 km in the MT, whereas the LT shows a minimum. Moreover, the results in Table 1 show that in the case of C2H2 and C6H6, the UT was significantly more polluted than the lower atmosphere, emphasizing the minor role of local pollution sources. This MT maximum
20
in hydrocarbons, notably of benzene with a relatively short photochemical lifetime of a week or less, points to rapid uplifting of polluted air masses into the MT. The vertical wind profile in Fig. 2 indicates that the MT airflow was predominantly southerly, orig-inating over the region where the ITCZ was active. Hence, the most likely transport mechanism is deep convection and subsequent outflow of boundary layer air into the
25
MT associated with the ITCZ. Meteorological evidence of ITCZ outflow encountered in the MT is provided by 10-day backward trajectory analysis presented in Fig. 4. The back-trajectories, calculated by the Royal Netherlands Meteorological Institute (KNMI), are based on 6-hour averaged 3-D wind field from the European Centre for
Medium-ACPD
3, 5469–5512, 2003Reactive chlorocarbons over the Surinam tropical
rainforest H. A. Scheeren et al. Title Page Abstract Introduction Conclusions References Tables Figures J I J I Back Close
Full Screen / Esc
Print Version Interactive Discussion
© EGU 2003
range Weather Forecast (ECMWF) (Stohl et al., 2001). Every 2 min along the flight track a back-trajectory was computed. Figure 4 shows a selection of back-trajectories along the MT flight tracks where the highest tracer concentrations have been observed. In black we show back-trajectories starting on 19 March (flight 4) between altitudes of 10–12 km, in blue trajectories starting on 21 March (flight 5) between 8–9 km, and in
5
red trajectories starting on 29 March (flight 10) between 9–12 km. The ITCZ, denoted by the gray band in Fig. 4, was located at about 5◦S of the Guyana’s based on GOES satellite visible and infrared images of March 1998 (http://www.satmos.meteo.fr). The back-trajectories analysis depicted in Fig. 4, clearly reveals the occurrence of rapid up-ward transport of lower tropospheric and boundary layer air into the upper troposphere
10
(8–12 km altitude) over central to northwestern Brazil in the ITCZ region, 3 to 9 days prior to the flights.
The enhancements of C2Cl4, C2H2and C6H6on 19 March (flight 4), as well as high CO, C2H2 and C3H8 encountered in the MT on 21 March (flight 5), suggest a strong influence of anthropogenic pollution, which appears to originate over the populated
15
northwestern coastal region of Brazil (Fig. 4, black and blue trajectories). The peak at about 11 km altitude observed on 26 March (flight 8), notably of CO, CH3CN and CH3Cl is a strong signature of biomass burning. This event was related to large sa-vanna/forest fires that took place near the Brazil/Venezuela border and is described in detail by Andreae et al. (2001). Finally, on 29 March (flight 10) high CH3Cl mixing
20
ratios (>700 pptv) have been observed at an altitude of 11–12 km in the absence of enhanced combustion tracers (e.g. C2H2, CH3CN), pointing to a strong natural source. Here, the back-trajectory analysis suggests an air mass origin over the pristine rainfor-est of central Amazonia. In the next section, we focus on chlorocarbon gradients in the mixing layer as observed over the pristine Surinam rainforest.
25
4.2. Accumulation of chlorocarbons in the mixing layer
Yokouchi et al. (2002) showed that tropical plants emit significant amounts of CH3Cl, while others have reported forest soil emissions of CHCl3 (e.g. Watling and Harper,
ACPD
3, 5469–5512, 2003Reactive chlorocarbons over the Surinam tropical
rainforest H. A. Scheeren et al. Title Page Abstract Introduction Conclusions References Tables Figures J I J I Back Close
Full Screen / Esc
Print Version Interactive Discussion
© EGU 2003
1998) and possibly that of C2Cl4(Hoekstra et al., 2001). Here we investigate the latitu-dinal gradients of chlorocarbons in the mixing layer over the Surinam tropical rainforest to assess the biogenic sources. To do so, we investigated the relationship between observed chlorocarbons mixing ratios and the time the encountered air masses spend in the mixing layer over the Surinam rainforest while moving into a southeasterly
direc-5
tion, referred to as the Forest Contact Time (FCT). The FCT, defined as the time (in hours) an air parcel spends in the mixing layer starting from the coast the coast (6◦N) towards the Brazilian border (2◦N), was determined as following:
FCT=∆L/ cos(WA) × WS/3600 (1)
where∆L is the latitudinal distance from the coast (m); cos(WA) is the cosine of the
10
mean wind angle (WA) taken from the aircraft measurement along the boundary layer flight track; WS is the mean wind speed in the boundary layer from the aircraft mea-surement (m s−1). The average wind angle and wind speed of all boundary layer flight legs was 45±13◦ and 10±3 m s−1.
A significant linear relationship between the trace gas concentrations and the FCT of
15
the encountered air masses can point to biogenic sources. Hence, the slope of a linear regression analysis,∆C/∆FCT, can be used to estimate fluxes. First, however, the mix-ing layer data set was screened for possible influences of local pollution sources such as biomass burning or of anthropogenic origin. CH3Cl and to a lesser extend CHCl3 are emitted from biomass burning (Lobert et al., 1999), while CH2Cl2and C2Cl4 have
20
urban-industrial sources (Keene et al., 1999). Therefore, air samples affected by emis-sions from biomass burning, anthropogenic combustion processes, or urban/industrial activities were excluded since they can contain enhanced chlorocarbon concentrations. We note that apart from some isolated small biomass burning events encountered on 15 and 26 March, there were no indications of widespread fire activity in Surinam
25
during course of the campaign (Williams et al., 2001b). Nevertheless, we decided to reject an air sample when the C2H2 and C6H6and/or CH3CN mixing ratios exceeded twice their “background” value, as detected over the ocean of ∼50, ∼30 and ∼150 pptv
ACPD
3, 5469–5512, 2003Reactive chlorocarbons over the Surinam tropical
rainforest H. A. Scheeren et al. Title Page Abstract Introduction Conclusions References Tables Figures J I J I Back Close
Full Screen / Esc
Print Version Interactive Discussion
© EGU 2003
and/or CO exceeded 140 ppbv, based on a study by Williams et al. (2001b). In addi-tion, we selected only daytime observations after 10:00 local time to avoid effects from the break-up of the nocturnal boundary layer in the early morning. Emissions from the rainforest (or other ground sources) accumulate in the shallow nocturnal boundary layer (Zimmerman et al., 1988). During dawn the nocturnal BL breaks up, which can
5
cause a temporarily peak in the concentrations of the accumulated species.
After applying the selection criteria to exclude other potential sources than biogenic, a total of 27 air samples in the mixing layer over the Surinam rainforest remained. The selected air samples were collected between 10:30 and 17:30 local time at altitudes between 96 and 1070 m. The geographical distribution of the air samples collected in
10
the Surinam mixing layer is depicted in Fig. 5. It shows that the data represent an area spanning ∼500 km of pristine tropical rainforest from the Atlantic coast to the Brazilian border.
In Fig. 6 the concentrations of combustion species (Fig. 6a) and chlorocarbons (Fig. 6b) from the selected air samples are shown as a function of FCT. The
corre-15
lation coefficient r (at the 95% confidence level) indicates the significance of the linear relationship. Figure 6a shows that the combustion tracers C2H2, C6H6 and CH3CN have no significant relationship with the FCT, clearly demonstrating that biomass burn-ing or other non-biogenic sources were negligible. CO, on the other hand, shows a significant positive trend with increasing FCT. An important source of CO over the
trop-20
ical rainforest, apart from biomass burning, is the oxidation of isoprene and terpenes emitted by vegetation (Zimmerman et al., 1988). According to Williams et al. (2001b) isoprene oxidation resulted in a net increase of 29 pptv CO km−1 over the Surinam rainforest during March 1998. Our selection of CO data shows a similar increase of ∼23±3 pptv km−1, close to the result of Williams et al. (2001b). Thus, we can attribute
25
the CO increase as a function of FCT to the oxidation of biogenic hydrocarbons, in particular isoprene.
In Fig. 6b we show that there is a significant linear relation (r > 0.5 at the 95% confi-dence limit) between the atmospheric concentration of CH3Cl and CHCl3and the FCT.
ACPD
3, 5469–5512, 2003Reactive chlorocarbons over the Surinam tropical
rainforest H. A. Scheeren et al. Title Page Abstract Introduction Conclusions References Tables Figures J I J I Back Close
Full Screen / Esc
Print Version Interactive Discussion
© EGU 2003
When we exclude an outlier in the C2Cl4data, we find a small but significant increase of C2Cl4over the Surinam rainforest as well. There are no indications of an emission flux of CH2Cl2. In the absence of significant biomass burning or urban/industrial sources we attribute the positive gradients of CH3Cl, CHCl3, C2Cl4 to biogenic emissions from the tropical rainforest ecosystem. Note that we use the term “ecosystem” because it is
5
difficult to differentiate between the various biogenic sources, such as direct emissions from vegetation or microbiological activity in the forest soil. However, based on present knowledge the enhancement of CH3Cl is most likely related to emissions from tropical vegetation (e.g. Yokouchi et al., 2002), whereas the CHCl3 and C2Cl4 emissions are predominantly related to the biological decay of organic material in the forest soil (e.g.
10
Hoekstra et al., 2001).
To determine the slope,∆C/∆FCT, of the relationship between the chlorocarbon mix-ing ratio and the FCT, a least-squares linear regression analysis was performed allow-ing precision errors in both the x- and the y-variable (linear fit in Fig. 6b). The estimated error in the FCT was ∼10%, while precision errors of 4% for CH3Cl, 5% for CHCl3and
15
7% for C2Cl4 were applied. This linear regression technique, described by Press et al. (1992) is referred to as an orthogonal distance regression (ODR) analysis. The results and uncertainty of the ODR analysis are summarized in Table 2. The relative uncertainties in the∆C/∆FCT are 23% for CH3Cl, 7% for CHCl3and 16% for C2Cl4. In the next section we use the∆C/∆FCT values to estimate chlorocarbon fluxes from the
20
tropical rainforest.
5. Chlorocarbon emission fluxes from the tropical rainforest
5.1. Flux calculation method
The flux, F , in g m−2h−1of a chlorocarbon out of the rainforest at the top of the mixing layer was estimated using the linear regression slope,∆C/∆FCT in mol mol−1 h−1, of
ACPD
3, 5469–5512, 2003Reactive chlorocarbons over the Surinam tropical
rainforest H. A. Scheeren et al. Title Page Abstract Introduction Conclusions References Tables Figures J I J I Back Close
Full Screen / Esc
Print Version Interactive Discussion
© EGU 2003
the chlorocarbons in the following equation:
F = ∆C/∆FCT × Lml× (p × M/R × T ), (2)
where Lml is the mean mixing layer height (m); p is the mean air pressure; M is the molecular weight of the chlorocarbon (g); R = 0.08314 is the gas constant (hPa m3 K−1); T is the mean air temperature (K) in the mixing layer. This simple flux estimate
5
can be applied assuming a well mixed mixing layer of a constant height, a negligible loss out of the mixing layer over the course of a day, and assuming a homogeneous flux out of the forest canopy.
5.2. Fluxes of CH3Cl, CHCl3, and C2Cl4
The evolution of the mixing layer height during a typical day in March 1998 over the
10
Surinam rainforest was shown in Fig. 1. The data selection used to calculate the ∆C/∆FCT corresponds to a local time between 10:30–17:30 h. Based on typical di-urnal mixing layer heights observed over the Amazon rainforest (Fig. 1), we deduce a mean mixing height of ∼1.5 (±0.2) km, corresponding to the times of the selected observations. Applying a mean BL-height of 1.5 km, a mean temperature of 298 K, a
15
mean pressure of 950 hPa, and the calculated ∆C/∆FCT values (Table 2) in Eq. (2), we derive fluxes in µg m−2 h−1 of 7.6±1.8 for CH3Cl, 1.11±0.08 for CHCl3 and of 0.36±0.07 for C2Cl4.
The accuracy of the flux estimate is dependent on the uncertainty in the∆C/∆FCT emission factors, the variability in the mixing layer height, and the assumption of a
ho-20
mogeneous well mixed mixing layer with minimum losses at the top. Errors induced by inhomogeneous conditions in the mixing layer are incorporated in the uncertainty of the calculated∆C/∆FCT values (Sect. 4.2). The uncertainties in the emission factors and mixing layer height add up to ∼35% for CH3Cl, ∼20% for CHCl3, and to ∼30% for C2Cl4. To get a first indication of possible losses at the top of the mixing layer
25
ACPD
3, 5469–5512, 2003Reactive chlorocarbons over the Surinam tropical
rainforest H. A. Scheeren et al. Title Page Abstract Introduction Conclusions References Tables Figures J I J I Back Close
Full Screen / Esc
Print Version Interactive Discussion
© EGU 2003
chemistry-climate model (Ganzeveld et al., 2002). The model was run with meteo-rological conditions representative for the Surinam dry season and a homogeneous CH3Cl canopy flux. Running the model without convective mixing (no shallow cumulus layer), it appeared that losses due to turbulent fluxes at the top of the mixing layer are negligible. However, when convective mixing was included in the model, losses at the
5
top of the mixing layer could become as large as −25% in the afternoon. This estimate provides a first indication that losses could be between 0% and −25% over the course of a day, depending on the intensity of convective mixing. Clearly, a more detailed sen-sitivity analysis, which is beyond the scope of this study, would be necessary to quantify the role of convective mixing more accurately. Hence, compensating for losses at the
10
top of the mixing layer would increase our flux estimates. Thus, our estimates can be considered as lower limits.
The flux estimates are summarized in Table 3 and can be compared to flux estimates for forest sites from other studies. We find a remarkably good agreement, in light of the uncertainties, with other flux estimates of CH3Cl, notably with that of Yokouchi et
15
al. (2002) for tropical vegetation. For CHCl3 our estimate lies at the low-end of other flux estimates ranging from 0.1 to 53 µg m−2 h−1. Our flux estimate of C2Cl4is, to our knowledge, the first estimate of emissions from tropical vegetation. It is more than an order of magnitude higher than the median value of 0.022 µg m−2h−1 observed above Dutch Douglas fir forest soil by Hoeksta et al. (2001). In agreement with our finding,
20
there have been no reports, to our knowledge, of biogenic land-based emissions of CH2Cl2.
5.3. Global chlorocarbon emission fluxes from tropical forest
We applied the chlorocarbon flux estimates for the Surinam rainforest to obtain a global annual emission estimate from tropical rainforest. According to Yokouchi et al. (2002),
25
we can assume a constant emission flux of CH3Cl from tropical plants independent of the time of day. This also implies a low seasonal variability when evergreen tropical plants are a major tropospheric source. Indeed, the observed seasonal cycle
ampli-ACPD
3, 5469–5512, 2003Reactive chlorocarbons over the Surinam tropical
rainforest H. A. Scheeren et al. Title Page Abstract Introduction Conclusions References Tables Figures J I J I Back Close
Full Screen / Esc
Print Version Interactive Discussion
© EGU 2003
tude decreases with latitude and is less than 5% (of the yearly mean) in the tropical regions for CH3Cl (Khalil and Rasmussen, 1999). It appears to be largely driven by the variability in the OH radical concentration and the enhanced biomass burning occurring during the dry seasons in the tropics. Therefore, for the estimates of annual emissions from tropical rainforest we assumed a seasonally independent flux.
5
Another factor of to be considered is the role of soil salinity (or the availability of chlorine to biogenic chlorocarbon metabolism). There are indications that a high soil salinity (Cl−content) enhances biosynthesis and subsequent emissions of CH3Cl from fungi and higher plants (Harper, 2000). In addition, model simulations by Lee-Taylor et al. (2001) suggest that tropical coastal and near-coast CH3Cl emissions may be more
10
important than those further inland, dependent on the deposition of sea salt containing aerosol. Although not apparent in our Surinam rainforest gradients, this implies that the estimated fluxes for the Surinam rainforest may be enhanced relative to fluxes from the rainforest deeper into the Amazon. During the LBA-CLAIRE 1998 campaign, Formenti et al. (2002) observed advection of Saharan dust at two sites in Surinam
15
(Zanderij airport, 55.47◦N, 55.12◦W, and Sipaliwini, 2.12◦N–56.06◦W) and a site in Brazil (Albina, 1.55◦S, 59.24◦W), at more than 800 km inland. They found that the wet and dry deposition of Saharan dust to the rainforest ecosystem is an important source of sea salt elements (Na, Cl, S), beside crustal dust elements (e.g. Al, Si, Ca, Fe). It was shown that maritime air significantly contributed to the concentrations of Cl in
20
aerosol samples collected at Balbina. The results of Formenti et al. (2001) corroborate earlier work by Artaxo et al. (1995), concluding that the transport of sea salt aerosol, embedded in dust plumes transported at low altitudes, is responsible for excess Cl soil concentrations observed deep into the Amazon basin. Hence, we assume that soil salinity is not a limiting factor for global biogenic chlorocarbon production.
25
To obtain annual fluxes in Gg yr−1 of CH3Cl, CHCl3 and C2Cl4 from tropical rain-forests we used the following equation:
Annual flux= Surinam flux × Emission period × Forest cover area, (3) where the “Surinam flux” is the flux estimate obtained for the Surinam rainforest (in µg
ACPD
3, 5469–5512, 2003Reactive chlorocarbons over the Surinam tropical
rainforest H. A. Scheeren et al. Title Page Abstract Introduction Conclusions References Tables Figures J I J I Back Close
Full Screen / Esc
Print Version Interactive Discussion
© EGU 2003
m−2 h−1); the “Emission period” is the amount of emission hours per year (365 × 24 h for the evergreen tropical forest); the “Forest cover area” estimates were adopted from the latest FAO Forest Resource Assessment 2000 report (FAO, 2001) being 8.158 × 10¹²m2 for the Amazon region, 2.704 × 10¹²m2 of Asian tropical forest and 7.258 × 10¹²m2for the remaining tropical forest (mainly Africa).
5
About half of the Asian tropical forest is lowland tropical forest, which is different from Asian highland tropical forest in terms of vegetation composition (Yokouchi et al., 2002). Asian lowland tropical forest constitutes for about a third of certain types of ferns and tropical plants from the Dipterocarpaceae family, which can emit considerable amounts of CH3Cl (Yokouchi et al., 2002). They performed a study on CH3Cl emissions from
10
a wide range of Asian tropical plants in a glasshouse, from which they estimated a CH3Cl flux from Dipterocarpaceae in southeast Asian lowland tropical forest of 0.91 Tg yr−1 based on 1997 FAO forest cover estimates. Using the latest FAO 2000 tropical forest cover estimates (FAO, 2001), this flux estimate becomes 0.88 Tg yr−1. When we apply the Surinam emission factor to estimate a yearly flux of CH3Cl from the remaining
15
fraction of Asian (highland) tropical forest this yields an additional flux 0.09 Tg yr−1. Summing up, we find a total global emission of 2 Tg CH3Cl per year from (sub)tropical vegetation, which is more than sufficient (within the uncertainty of the es-timates) to account for the total of missing sources and to close the global tropospheric budget. Our estimates are in good agreement with the model study by Lee-Taylor et
20
al. (2001), who found that observed mixing ratios are best reproduced by addition of a large tropical terrestrial source of ∼2.3 Tg, which includes 0.18 Gg yr−1 redistributed from Asian biomass burning emissions. Interestingly, the latter is in conflict with new estimates of biomass burning emissions of CH3Cl from the use of biofuels in Southeast Asia by Scheeren et al. (2002). They find that CH3Cl emissions from the use of
biofu-25
els could be underestimated by 30–35% (∼0.28 Gg yr−1) for India and Southeast Asia based on measurements performed over the Indian Ocean during the INDOEX 1999 experiment. These conflicting estimates illustrate the level of uncertainty still present in quantifying the major CH3Cl sources.
ACPD
3, 5469–5512, 2003Reactive chlorocarbons over the Surinam tropical
rainforest H. A. Scheeren et al. Title Page Abstract Introduction Conclusions References Tables Figures J I J I Back Close
Full Screen / Esc
Print Version Interactive Discussion
© EGU 2003
Our estimates of annual fluxes of CHCl3 from global tropical forest of 175±35 Gg yr−1 (based on the Surinam emission flux) and a flux from temperate forest of ∼5 Gg yr−1(based on a forest soil flux of 0.033 µg m−2h−1from Haselmann et al. (2000a) and temperate forest cover of 1.881×10¹³m2from FAO, 2001) combine to 180±35 Gg yr−1. This number compares well to the ∼200 Gg yr−1from (forest) soil emissions estimated
5
by Khalil et al. (1999), which are mainly concentrated in the tropics. Extrapolating the Surinam rainforest C2Cl4 flux onto a global scale, we can estimate a total flux from tropical forests of 57±17 Gg yr−1. This flux could account for almost half of the amount of missing C2Cl4sources (∼128 Gg yr−1) in the global budget by Keene et al. (1999). 5.4. Global emission budgets of CH3Cl, CHCl3, and C2Cl4
10
In Table 4 we summarize our flux estimates for tropical rainforests and include emission flux estimates from the literature of the oceans, biomass burning, industrial sources and other newly identified biogenic sources. As such, an overview is given of the global an-nual source budgets of CH3Cl, CHCl3, and C2Cl4 in Tg yr−1. CH2Cl2 is not included here because it has no terrestrial biogenic sources. Wiedman et al. (1994) was able
15
to model the global distribution of C2Cl4consistently without biogenic input. However, the uncertainty in the global budget remains to be large (Keene et al., 1999) and allows for the inclusion of newly identified natural sources. In addition to Table 4, the compo-sition of global source budgets of CH3Cl, CHCl3, and C2Cl4 is illustrated in pie-plots in Fig. 7. Note that an annual emission flux of 128 Gg CH3Cl yr−1 from fungal (soil)
20
activity (Lee-Taylor et al., 2001) has not been included, because we consider this to be incorporated in the fluxes from tropical forest ecosystems. We adopted annual global net flux estimates from the oceans of 477 Gg CH3Cl yr−1from Lee-Taylor et al. (2001), and 359 Gg CHCl3yr−1and 19 Gg C2Cl4 yr−1 from Khalil et al. (1999). A small flux of 3.6 Gg C2Cl4yr−1and 5.4 Gg CHCl3yr−1was estimated for the global temperate forest
25
(FAO, 2001) using the mean C2Cl4forest soil flux measured by Hoekstra et al. (2001) and the mean CHCl3forest soil flux from Haselmann et al. (2000a), respectively.
ACPD
3, 5469–5512, 2003Reactive chlorocarbons over the Surinam tropical
rainforest H. A. Scheeren et al. Title Page Abstract Introduction Conclusions References Tables Figures J I J I Back Close
Full Screen / Esc
Print Version Interactive Discussion
© EGU 2003
Recently identified biogenic global source fluxes included in Table 4 are 170 (65– 440) Gg CH3Cl yr−1from coastal salt marshes (Rhew et al., 2000), 24 Gg CHCl3yr−1 and 35 Gg CH3Cl yr−1 from peat land and freshwater wetland ecosystems (Dimmer et al., 2001), a global conifer forest floor source of 85 (39–131) Gg CH3Cl yr−1, and a global flux of 5.8 Gg CH3Cl yr−1 from rice paddies. We assumed global biomass
5
burning emissions of 909 Gg CH3Cl yr−1 and 2 Gg CHCl3 yr−1 according to Lobert et al. (1999) and an additional biomass burning source of 118 Gg CH3Cl yr−1from Asian biofuel use from Scheeren et al. (2002). Global annual emissions of ∼10 Gg CH3Cl, 62±25 Gg CHCl3, and 366±20 Gg C2Cl4from industrial activities, 107±10 Gg CH3Cl and ∼1.9 Gg C2Cl4from fossil fuel combustion, and 45±33 Gg CH3Cl from waste
in-10
cineration for the year 1990 were taken from McCulloch et al. (1999a, b) and Aucott et al. (1999). We note that these emissions were estimated for the year 1990. McCulloch et al. (1999b) showed that the production and emission of industrial chlorocarbons is directly proportional to the economic activity. Industrial emissions for the year 2000, although not yet available, are probably somewhat higher than in 1990 due to the
in-15
creased world economy over that decade.
We estimate a total annual CH3Cl source flux of about 4 Tg (Table 4), which is in excellent agreement with the annual global sink of 4.0 Tg by Montzka et al. (2003). The annual source fluxes of 0.64 Tg CHCl3 and 0.45 Tg C2Cl4 agree reasonably well (within the uncertainty) with their estimated annual global total sinks of 0.46 Tg and
20
0.51 Tg from Keene et al. (1999). The overestimation of the global annual source of 0.17 Tg CHCl3 (+29%) is most likely mainly due to the highly uncertain ocean source estimate from Khalil et al. (1999). Although the missing source of 0.13 Tg C2Cl4yr−1, reported by Keene et al. (1999), can be reduced by half by our flux estimate from global forests, the budget of C2Cl4remains to be unbalanced by −60 Gg.
ACPD
3, 5469–5512, 2003Reactive chlorocarbons over the Surinam tropical
rainforest H. A. Scheeren et al. Title Page Abstract Introduction Conclusions References Tables Figures J I J I Back Close
Full Screen / Esc
Print Version Interactive Discussion
© EGU 2003 6. Decreasing trends in atmospheric CH3Cl
In the literature, there exist two long-term CH3Cl datasets from polar firn samples (But-ler et al., 1999; Kasper et al., 2003) and one from atmospheric measurements (Khalil and Rasmussen, 1999). Khalil and Rasmussen (1999) present a record of CH3Cl measurements from 1981 to 1997 from various background sites around the world. A
5
compilation of these measurements suggests a weak decreasing trend of methyl chlo-ride of the order of a few pptv per year over the last two decades. A similar trend was deduced from recent firn air analyses by Kaspers et al. (2003), who found a decrease of 1.2±0.6 pptv CH3Cl per year (−0.2 ± 0.1% per year) between 1975 and 2000. In contrast, the measurements from Butler et al. (1999) suggest an increase of 5–10% in
10
atmospheric CH3Cl over the past century. Although we cannot explain this inconsis-tency, the majority of evidence suggests that CH3Cl decreased over the last 20 years. Khalil and Rasmussen (1999) explained the global trend from a possible decrease of the OH-radical over the last 20 years reported by Krol et al. (1998) and later by Prinn et al. (2001). Recent work by Krol et al. (2003) has indicated however, that the
pre-15
viously reported negative OH trend in the 1990s seems to be unlikely and appears to be related to underestimated sources of methyl chloroform (1,1,1-trichloroethane) in global models. Methyl chloroform is used in global models to estimate the budget of the OH-radical since it has only anthropogenic sources and its main removal is by reaction with OH. Hence, in the absence of an OH trend, it appears that one or more
20
sources of CH3Cl have become smaller over the last two decades.
The main CH3Cl sources are biomass burning, the oceans and tropical vegetation (see previous section). In a recent study on interannual and seasonal variability of biomass burning by Duncan et al. (2003), no apparent trend in biomass burning emis-sions over the last two decades was reported. When we perform a linear regression
25
analysis on the global CO biomass burning emissions of CO (in Tg C yr−1) as a func-tion of time (in years), we can deduce a positive trend of the order of 0.6% per year (r = 0.55) between 1980 and 1997. Clearly, a biomass burning emission trend, if any,
ACPD
3, 5469–5512, 2003Reactive chlorocarbons over the Surinam tropical
rainforest H. A. Scheeren et al. Title Page Abstract Introduction Conclusions References Tables Figures J I J I Back Close
Full Screen / Esc
Print Version Interactive Discussion
© EGU 2003
is most likely not related to a decrease in CH3Cl. In addition, there are no studies indicative of any long-term trend in oceanic emissions. There is, however, significant evidence that the oceans have warmed up over the last 40 years due to the increase of greenhouse gases in the atmosphere (Barnett et al., 2001; Levitus et al., 2001). This suggests that the release of CH3Cl from the oceans could have increased over that
5
period. Although significant for the earth climate system, the global mean sea-surface temperature rise was less than 1◦C over the last century (Levitus et al., 2001). There-fore, we consider the temperature effect on oceanic CH3Cl emissions over the last 20 years to be negligible.
Based on this and other work (Lee-Taylor et al., 2001; Yokouchi et al., 2002) we
10
find that the largest source of CH3Cl is emissions from tropical vegetation. The latest estimates of global forest area cover by the FAO (FAO, 2001) show that the amount of tropical forest has decreased from 210.4 × 10⁷ha in 1980 to 179.1 × 10⁷ha in the year 2000 (corrected for replanted forest area), which equals a decrease of −0.74% yr−1. The trends of CH3Cl, biomass burning and tropical forest cover are presented in Fig. 8.
15
The extrapolated CH3Cl trend between 1980 and the year 2000 is −1.3 pptv yr−1 or −0.2% yr−1 (r = 0.67). Hence, we propose that the strong decrease of tropical for-est cover from anthropogenic activities over the last two decades could explain the observed decrease in global mean methyl chloride. In order to test the relationship be-tween CH3Cl and tropical forest cover more quantitatively, we assume that the yearly
20
global mean atmospheric CH3Cl concentration [CH3Cl]t (of the year t) is composed of the relative fractions (in pptv) of the major sources:
[CH3Cl]t
0=((1−na∆t)(Sa/
X
S)+ (1−nb∆t)(Sb/XS)+ ...) × [CH3Cl]t
1, (4)
where (1 − na∆t) is the relative annual trend n of source a over a period ∆t denoting the number of years between the year t0(1980) and t1(2000); (Sa/P S) is the fraction
25
of source Sarelative to the sum of all sourcesP S.
We assume that global emissions from oceans, wetlands as well as the relatively small contribution from industrial emissions of CH3Cl remained constant over the last
ACPD
3, 5469–5512, 2003Reactive chlorocarbons over the Surinam tropical
rainforest H. A. Scheeren et al. Title Page Abstract Introduction Conclusions References Tables Figures J I J I Back Close
Full Screen / Esc
Print Version Interactive Discussion
© EGU 2003
two decades. For the reference year 2000 we can calculate a [CH3Cl]2000 of 543 (±16) pptv (the measured variability is ±3% yr−1) based on the trend in the Khalil and Rasmussen (1999) data set shown in Fig. 7. Applying a linear trend back in time of −0.6% yr−1for the biomass burning fraction and of+0.74% yr−1for the fraction of trop-ical forests, we can then calculate a [CH3Cl]1980of 566 pptv (Table 5). This value
com-5
pares very well with the [CH3Cl]1980of 567 (±17) pptv based on the observed trend and shows more quantitatively that the clearing of tropical forest can explain the observed decrease of the global mean CH3Cl concentration. Clearly, our hypothesis implies that the atmospheric CH3Cl concentration could have varied strongly in the geological past as a function of climate variability and global forest cover.
10
7. Summary and conclusions
We have presented measurements of reactive chlorocarbons CH3Cl, CH2Cl2, CHCl3 and C2Cl4 in the boundary layer and free troposphere over Surinam during March 1998. The horizontal and vertical distributions have been analyzed with the help of concurrent measurements of CO, CH3CN, and non-methane hydrocarbons, as well as
15
with 10-day back-trajectories. The vertical profiles show enhanced concentrations in the boundary layer and in the free troposphere between 8–12 km. We find that the free troposphere above 8 km altitude was strongly affected by deep convective outflow associated with the ITCZ, which was located a few degrees south of Surinam. Polluted air masses containing enhanced chlorocarbons appear to originate over the populated
20
northwestern part of Brazil. High CH3Cl concentrations correlating with relatively low CO, CH3CN and C2–C6NMHCs seem to come from the Central Amazonia pointing to biogenic sources.
We found a significant positive gradient of the CH3Cl, CHCl3and C2Cl4 concentra-tion in the mixing layer between the Surinam coast and the Brazilian border at 6◦S.
25
No correlation of CH2Cl2with latitude was found. These gradients point to significant biogenic sources and corroborate the findings of Yokouchi et al. (2002). The change of
ACPD
3, 5469–5512, 2003Reactive chlorocarbons over the Surinam tropical
rainforest H. A. Scheeren et al. Title Page Abstract Introduction Conclusions References Tables Figures J I J I Back Close
Full Screen / Esc
Print Version Interactive Discussion
© EGU 2003
chlorocarbon concentration as a function of air mass residence time over the rainforest was used to calculate an emission factor in pptv h−1. For this we used a selection of the data, representing air masses not affected by local biomass burning emissions or urban/industrial pollution. With these emission factors we could calculate fluxes of 7.6 ± 2.7 µg CH3Cl m−2h−1, 1.11 ± 0.22 µg CHCl3m−2h−1, and 0.36 ± 0.067 µg C2Cl4
5
m−2 h−1, representative for the Surinam tropical rainforest ecosystem. Hence, these fluxes encompass emissions from microbiological soil processes, fungal decomposi-tion of wood, as well as direct emission from plants. Extrapolating these fluxes onto a continental scale and using the FAO 2000 tropical forest cover estimates (FAO, 2001), we can estimate annual emission fluxes from the Amazon tropical rainforest of 0.544
10
Tg CH3Cl yr−1, 0.079 Tg CHCl3yr−1, and 0.026 Tg C2Cl4yr−1. The total emission flux estimates from tropical rainforests in South-America, Asia and Africa applying the Suri-nam flux value and the flux value from Yokouchi et al. (2002) for Asian highland tropical forest add up to 2 Tg CH3Cl yr−1. This value compares well with the model estimate of 2.3 Tg yr−1 by Lee-Taylor et al. (2001) and can account for the remaining missing
15
sources in the CH3Cl budget. Our estimate of an annual flux of ∼57 Gg C2Cl4 yr−1 from global forest ecosystems can account for half of the previously missing sources in the budget by Keene et al. (1999).
The important role of tropical vegetation in the global budget of CH3Cl indicates that changes in tropical forest cover could affect the atmospheric concentration. Indeed, we
20
show that there are strong indications that the reduction of tropical forest area over the past 20 years can largely explain the downward trend in atmospheric CH3Cl observed by Khalil and Rasmussen (1999) and Kaspers et al. (2003).
Acknowledgements. We gratefully acknowledge the excellent cooperation with the whole
Cita-tion team and the staff of the Surinam Meteorological Service. We thank P. van Velthoven from
25
the KNMI for providing the 10-day back-trajectories. We are grateful to L. Ganzeveld of the MPI for Chemistry (Mainz, Germany) for model simulations with the single column model version of ECHAM 4.
ACPD
3, 5469–5512, 2003Reactive chlorocarbons over the Surinam tropical
rainforest H. A. Scheeren et al. Title Page Abstract Introduction Conclusions References Tables Figures J I J I Back Close
Full Screen / Esc
Print Version Interactive Discussion
© EGU 2003 References
Artaxo, P. and Hansson, H.C.: Size distribution of biogenic aerosol particles from the Amazon Basin, Atmos. Environ., 29, 393–402, 1995.
Andreae, M. O., Artaxo, P., Fischer, H., Freitas, S. R., Gr ´egoire, Hansel, A., Hoor, P., Kormann, R., Krejci, R., Lange, L., Lelieveld, J., Lindinger, W., Longo, K., Peters, W., de Reus, M.,
5
Scheeren, B., Silva Dias, M. A. F., Str ¨om, J., van Velthoven, P. F. J., and Williams, J.: Trans-port of biomass burning smoke to the upper troposphere by deep convection in the equatorial region, J. Geophys. Lett., 28, 951–954, 2001.
Bill, M., Rhew, R. C., Weiss, R. F., and Goldstein, A. H.: Carbon isotope ratios of methyl bromide and methyl chloride emitted from a coastal salt marsh, Geophys. Res. Lett., 29, doi:
10
10.1029/2001GL012946, 2002.
Barnett, T. P., Pierce, D. W., and Schnur, R.: Detection of anthropogenic climate change in the world’s oceans, Science, 292, 270–274, 2001.
Butler, J. H., Battle, M., Bender, M. L., Montzka, S. A., Clarke, A. D., Saltzman, E. S., Sucher, C. M., Severinghaus, J. P., and Elkins, J. W.: A record of atmospheric halocarbons during
15
the twentieth century from polar firn air, Nature, 399, 749–755, 1999.
Chemosphere: Special Issue on Naturally Produced Organohalogens, 52, 287–537, 2003. Crutzen, P. J., Williams, J., P ¨oschl, U., Hoor, P., Fischer, H., Warneke, C., Holzinger, R., Hansel,
A., Lindinger, W., Scheeren, B., and Lelieveld, J.: High spatial and temporal resolution mea-surements of primary organics and their oxidation products over the tropical forests of
Suri-20
nam, Atmos. Environ., 34, 1161–1165, 2000.
Dimmer, C. H., Simmonds, P. G., Nickless, G., and Bassford, M. R.: Biogenic fluxes of halomethanes from Irish peatland ecosystems, Atmos. Environ., 35, 321–330, 2001. Duncan, B. N., Martin, R. V., Staudt, A. C., Yevich, R., and Logan, J. A.: Interannual and
seasonal variability of biomass burning emissions constrained by satellite observations, J.
25
Geophys. Res., 108, doi:10.1029/2002JD002378, 2003.
Food and Agricultural Organization of the UN (FAO): Forest Resources Assessment 2000, on
http://www.fao.org/forestry/fo/fra/index.jsp, Rome, Italy, 2001.
Formenti, P., Andreae, M. O., Lange, L., Roberts, G., Cafmeyer, J., Rajta, I., Meanhaut, W., Holben, B. N., Artaxo, P., and Lelieveld, J.: Saharan dust in Brazil and Suriname during
30
the Large-Scale Biosphere-Atmosphere Experiment in Amazonia (LBA) – Cooperative LBA Regional Experiment (CLAIRE) in March 1998, J. Geophys. Res., 106, 14 919–14 934, 2001.
ACPD
3, 5469–5512, 2003Reactive chlorocarbons over the Surinam tropical
rainforest H. A. Scheeren et al. Title Page Abstract Introduction Conclusions References Tables Figures J I J I Back Close
Full Screen / Esc
Print Version Interactive Discussion
© EGU 2003
Harper, D. B.: The global chloromethane cycle: biosynthesis, biodegradation and metabolic role, Nat. Prod. Rep., 17, 337–348, 2000.
Haselmann, K. F., Ketola, R. A., Laturnus, F., Lauritsen, F. R., and Grøn, C.: Occurrence and formation of chloroform at Danish forest sites, Atmos. Environ., 34, 187–193, 2000a. Haselmann, K. F., Laturnus, F., Svensmark, B., and Grøn, C.: Formation of chloroform in spruce
5
forest soil results from laboratory incubation studies, Chemosphere, 41, 1769–1774, 2000b. Hoekstra, E. J., Duyzer, J. H., de Leer, E. W. B., and Brinkman, U. A. Th.: Chloroform – concentration gradients in soil air and atmospheric air, and emission fluxes from soil, Atmos. Environ., 35, 61–70, 2001.
Hoekstra, E. J., Verhagen, F. J. M., Field, J. A., de Leer, E. W. B., and Brinkman, U. A. Th.:
10
Natural production of chloroform by fungi, Phytochem., 49, 91–97, 1998.
Holzinger, R., Warneke, C., Hansel, A., Jordan, A., and Lindinger, W.: Biomass burning as a source of formaldehyde, acetaldehyde, methanol, acetonitrile, and hydrogen cyanide, Geo-phys. Res. Lett., 26, 1161–1164, 1999.
Kaspers, K. A., van de Wal, R. S. W., de Gouw, J. A., Hofstede, C. M., van den Broeke, M.
15
R., van der Veen, C., Neubert, R., Meijer, H. A. J., Brenninkmeijer, K. A. M., Karl ¨of, L., and Winther, J.G.: Analyses of firn gas samples from Dronning Maud Land, Antarctica: a study of non-methane hydrocarbons and methyl chloride, J. Geophys. Res., submitted, 2003. Keene, W. C., Khalil, M. A. K., Erickson, D. J., McCulloch, A., Greadel, T. E., Lobert, J. M.,
Aucott, M. L., Gong, S.-L., Harper, D. B., Kleinman, G., Midley, P., Moore, R. A., Seuzaret,
20
C., Sturges, W. T., Benkovitz, C. M., Koropalov, V., Barrie, L. A., and Li, Y. -F.: Composite global emissions of reactive chlorine from anthropogenic and natural sources: The Reactive Chlorine Emissions Inventory, J. Geophys. Res., 104, 8429–8440, 1999.
Khalil, M. A. K.: Reactive halogen compounds in the atmosphere: The Handbook of Environ-mental Chemistry Vol. 4 Part E, edited by: Fabian, P. and Singh, O. N., Springer-Verlag,
25
Berlin Heidelberg, 1999.
Khalil, M. A. K. and Rasmussen, R. A.: Atmospheric methyl chloride, Atmos. Environ., 33, 1305–1321, 1999.
Khalil, M. A. K., Moore, R. M., Harper, D. B., Lobert, J. M., Erickson, D. J., Koropalov, V., Sturges, W. T., and Keene, W. C.: Natural emissions of chlorine-containing gases: Reactive
30
Chlorine Emissions Inventory, J. Geophys. Res., 104, 8333–8346, 1999.
Krejci, R., Str ¨om, J., de Reus, M., Williams, J., and Andreae, M. O.: Spatial and temporal distribution of the atmospheric aerosols in the lowermost troposphere over the Amazonian
ACPD
3, 5469–5512, 2003Reactive chlorocarbons over the Surinam tropical
rainforest H. A. Scheeren et al. Title Page Abstract Introduction Conclusions References Tables Figures J I J I Back Close
Full Screen / Esc
Print Version Interactive Discussion
© EGU 2003
rainforest, Ph.D. thesis – Chapter 2, Stockholm University, Stockholm, Sweden, 2002. Krol, M., van Leeuwen, P. J., and Lelieveld, J.: Global OH trend inferred from methylchloroform
measurements, J. Geophys. Res., 103, 10 697–10 712, 1998.
Krol, M. C., Lelieveld, J., Oram, D. E., Sturrock, G. A., Penkett, S. A., Brenninkmeijer, C. A. M., Gros, V., Williams, J., and Scheeren, H. A.: Continuing emissions of methyl chloroform from
5
Europe, Nature, 421, 131–135, 2003.
Lee-Taylor, J. M., Brasseur, G. P., and Yokouchi, Y.: A preliminary three-dimensional global model study of atmospheric methyl chloride distributions, J. Geophys. Res., 106, 34 221– 34 233, 2001.
Levitus, S., Antonov, J. I., Wang, J., Delworth, T. L., Dixon, K. W., and Broccoli, A. J.:
Anthro-10
pogenic warming of the earth’s climate system, Science, 292, 267–270, 2001.
Li, H. -J., Yokouchi, Y., and Akimoto, H.: Measurements of methyl halides in the marine atmo-sphere, Atmos. Environ., 33, 1881–1887, 1999.
Lindinger, W., Hansel, A., and Jordan, A.: On-line monitoring of volatile organic compounds at pptv level by means of Proton-Tranfer-Reaction Mass Spectrometry (PTR-MS) – Medical
ap-15
plications, food control, and environmental research, Int. J. Mass Spectrom. Ion Processes, 173, 191–241, 1998.
Lobert, J. M., Scharffe, D. H., Hao, W. M., and Crutzen, P. J.: Importance of biomass burning in the atmospheric budgets of nitrogen-containing gases, Nature, 346, 552–554, 1990.
Lobert, J. M., Keene, W. C., Logan, J. A., and Yevich, R.: Global chlorine emissions from
20
biomass burning: Reactive Chlorine Emissions Inventory, J. Geophys. Res., 104, 8373– 8389, 1999.
Martin, C. L., Fitzjarrald, D., Garstang, M., Oliveira, A. P., Greco, S., and Browell, E.: Structure and growth of the mixing layer over the Amazonian rain forest, J. Geophys. Res., 93, 1361– 1375, 1988.
25
McCulloch, A., Aucott, M. L., Benkovitz, C. M., Graedel, T. E., Kleiman, G. K., Midgley, P. M., and Li, Y.-F.: Global emissions of hydrogen chloride and chloromethane from coal combus-tion, incineration and industrial activities: Reactive Chlorine Emission Inventory, J. Geophys. Res., 104, 8391–8403, 1999a.
McCulloch, A., Aucott, M. L., Graedel, T. E., Kleiman, G. K., Midgley, P. M., and Li, Y.-F.:
Indus-30
trial emissions of trichloroethene, tetrachloroethene, and dichloroethane: Reactive Chlorine Emission Inventory, J. Geophys. Res., 104, 8417–8428, 1999b.