https://doi.org/10.1038/s41409-020-0803-y A R T I C L E
Rede
fining and measuring transplant conditioning intensity
in current era: a study in acute myeloid leukemia patients
This article has been corrected since Advance Online Publication and a correction is also printed in this issue Alexandros Spyridonidis 1●Myriam Labopin2●Bipin N. Savani 3●Riitta Niittyvuopio4●Didier Blaise 5●
Charles Craddock6●Gerard Socié 7●Uwe Platzbecker8●Dietrich Beelen9●Noel Milpied10●Jan J. Cornelissen11●
Arnold Ganser12●Anne Huynh13●Laimonas Griskevicius14●Sebastian Giebel15●Mahmoud Aljurf16●Eolia Brissot2●
Florent Malard 2●Jordi Esteve17 ●Zinaida Peric18●Frédéric Baron19●Annalisa Ruggeri20●Christoph Schmid21●
Maria Gilleece 22●Norbert-Claude Gorin2●Francesco Lanza23●Roni Shouval24●Jurjen Versluis12●Gesine Bug25●
Yngvar Fløisand26 ●Fabio Ciceri27●Jamie Sanz 28●Ali Bazarbachi29●Arnon Nagler30●Mohamad Mohty2
Received: 10 October 2019 / Revised: 30 November 2019 / Accepted: 16 January 2020 / Published online: 29 January 2020 © The Author(s), under exclusive licence to Springer Nature Limited 2020
Abstract
To address limitations of the currently used reduced-intensity/myeloablative conditioning (RIC/MAC) classification scheme we aimed to develop a tool that can capture more standardized the conditioning intensity of allogeneic hematopoietic cell transplantation (HCT). We assigned intensity weight scores for frequently used conditioning regimen components and used their sum to generate the transplant conditioning intensity (TCI) score. We retrospectively tested the impact of TCI on 8255 adult (45–65 years) acute myeloid leukemia patients who underwent HCT in first complete remission. A Cox model for early nonrelapse mortality (NRM) yielded a 3-group TCI risk scheme (low, intermediate, high) with respective TCI scores of [1–2], [2.5–3.5] and [4–6]. On multivariate modeling, TCI grouping was highly and better predictive for early (day 100 and 180) NRM, 2-year NRM and relapse (REL) as compared with the RIC/MAC classification. Validation was done on 200 bootstrap samples. Moreover, TCI scoring enabled the identification of a distinct subgroup of RIC and MAC conditioning regimens with an intermediate TCI [2.5–3.5] score that had identical outcomes and which are frequently referred as “reduced toxicity conditioning”. TCI scheme provides an improvement of the RIC/MAC classification. We propose TCI as a new tool to define and measure the conditioning regimen intensity.
Introduction
The pre-transplantation conditioning regimen plays a central role in allogeneic hematopoietic cell transplanta-tion (HCT) since it is essential for the engraftment of the infused graft [1]. Nowadays, a lot of conditioning regi-mens exist which fulfill this requirement but differ sub-stantially in their intensity profile. The latter characteristic is directly related to early morbidity, nonrelapse mortality (NRM) and long term disease control. Transplant regi-mens were initially categorized by their intensity as
“standard” myeloablative conditioning (MAC) and reduced-intensity conditioning (RIC) or nonmyeloablative (NMA) based on the expected duration of the pancyto-penia (irreversible, prolonged, minimal) and on the requirement for stem cell support (essential, required, optional) [2–4]. Since these criteria are rather vague, the European Society for Blood and Marrow Transplantation (EBMT) [5] and the Center for International Blood and Marrow Transplant Research (CIBMTR) [6] proposed in 2009 operational definitions for stratification of transplant conditioning as MAC or RIC based on the total dose of the alkylating agents and/or total body irradiation (TBI) used. Briefly, RIC usually includes a purine analog and an alkylating agent or TBI at a dose which is generally reduced by at least≥30% of the classical MAC regimens [7,8]. The RIC/MAC classification model has served as a reliable clinical tool offering safer transplantation in older and unfit patients and is widely referenced in the scientific literature, but has never been updated or more precisely * Alexandros Spyridonidis
spyridonidis@upatras.gr
Extended author information available on the last page of the article Supplementary informationThe online version of this article (https:// doi.org/10.1038/s41409-020-0803-y) contains supplementary material, which is available to authorized users.
123456789
0();,:
123456789
defined though transplantation practices change and new conditionings are now used.
The limitations of the current RIC/MAC classification scheme in the current era are exemplified by the arbitrary use of terms such as “reduced toxicity conditioning” or “sequential conditioning” by many authors [9, 10]. Novel drugs (e.g., thiotepa and optimized forms of drugs e.g., treosulfan) with reduced nonhematological toxicity are frequently used nowadays and their different toxicity pro-files are not considered in the current RIC/MAC classifi-cation scheme [11,12]. RIC/MAC operational rules ignore the additional intensity of purine analogs used for immu-noablation (e.g., fludarabine, clofarabine) or of disease-specific drugs used to achieve reduction in relapse risk (e.g., cytarabine, etoposide), and thus important prognostic information is lost [13].
Therefore, we sought to develop a tool that can define and standardize the intensity of a conditioning regimen more effectively than existing nomenclature. We assigned intensity weight scores for frequently used conditioning regimen components and used the sum of the individual weights to generate the Transplant Conditioning Intensity (TCI) score. In the present study, we retrospectively tested the TCI in a large cohort of adult acute myeloid leukemia (AML) patients and compared it with the standard RIC/ MAC stratification scheme in predicting outcomes.
Materials and methods
TCI score development
Components for which the myeloablative doses are defined by the EBMT [5] and/or CIBMTR [6] (TBI, busulfan, melphalan, treosulfan and thiotepa) were assigned one of
three dose intensity levels by using the threshold myeloa-blative dose as the intermediate dose level and assigning all doses below or above to the low or high dose level, respectively. For each of these components, we assigned a weighted score of 1 for the lower dose and an extra point for every dose level, except for thiotepa which was assigned an added weighted score of 0.5 for each level because of its reduced nonhematological toxicity [11]. Components for which a “myeloablative dose” definition does not exist, such as purine analogs, carmustine, etoposide and cytar-abine, were considered in terms of the dose ranges used in practice and were assigned an additional weight of 0.5 for each dose level. An international expert panel (listed in authorship) participated in a workshop organized by the Acute Leukemia Working Party (ALWP) of the EBMT and provided scientific and clinical guidance for the TCI score development. Agents and their integer weights are shown in Table1. The TCI score for a specific conditioning regimen is based on the sum of the weights for each component given any day before the graft infusion.
Transplant data
This was a retrospective multicenter analysis. Data were provided by the ALWP of the EBMT registry in which > 500 transplant centers report annually all consecutive HCTs after patient’s authorization via informed consent and approval of the study from ALWP EBMT general assembly. We focused on patients aged between 45 and 65 years with a diagnosis of AML (de novo or secondary) who had received an allogeneic HCT atfirst complete remission (less than 5% bone marrow [BM] blasts at transplant). Other inclusion criteria included time from diagnosis to HCT < 18 months, transplant between 2005 and 2017, peripheral blood stem cell (PBSC) or BM graft from a matched sibling
Table 1 Intensity weighted scores for common components included in transplantation conditioning regimens.
Component Dose level Added points for
each dose level
Low Intermediate High
TBI fractionated (Gray) ≤5 6–8 ≥9 1
Busulphan (mg/kg) ≤6.4 iv & ≤8 po 9.6 iv & 12 po 12.8 iv & 16 po 1
Treosulfan (g/m2) 30 36 42 1 Melphalan (mg/m2) <140 ≥140 ≥200 1 Thiotepa (mg/kg) <10 ≥10 ≥20 0.5 Fludarabine (mg/m2) ≤160 >160 0.5 Clofarabine (mg/m2) ≤150 >150 0.5 Cyclophosphamide (mg/kg) <90 ≥90 0.5 Carmustine (mg/m2) ≤250 280–310 ≥350 0.5 Cytarabine (g/m2) <6 ≥6 0.5 Etoposide (mg/kg) <50 ≥50 0.5
donor (MSD) or 9–10/10 HLA-matched unrelated donor (MUD) and availability of detailed conditioning informa-tion. MAC or RIC status was reported by the transplant centers according to EBMT operational definitions [5] and guidelines (MED-AB Manual, 31/1/2018) and was recon-firmed for every patient.
Statistical analysis
Early nonrelapse mortality (NRM) at day (d) 180 was used as the first endpoint for estimating the impact of TCI. Results of NRM at d 100 were also given as this endpoint is often reported in the literature. Secondary endpoints inclu-ded NRM and relapse incidence (REL) at 2 years, overall survival (OS) and leukemia-free survival (LFS). A grouping scheme based on TCI score was created by merging the underrepresented scores (< 30 patients) with contiguous scores. A Cox proportional hazards model for NRM at day 180 including the TCI score as an ordered variable was used to merge the classes that did not improve the likelihood of the model, using ap value of 0.10. Univariate analyses were performed using the Gray’s test for cumulative incidence functions (NRM, REL) and the log-rank test for OS and LFS. Patient, disease, and transplant-related characteristics for the TCI groups were compared using theχ2statistic for categorical variables and the Kruskal–Wallis test for con-tinuous variables. All variables differing significantly (p < 0.05) between the TCI groups or factors known to be relevant from the literature were included in thefinal Cox model. Internal validation of models was performed using the bootstrap resampling method [14]. The model was refitted for each of the 200 bootstrap samples. Confidence intervals of c-statistics using either TCI or RIC/MAC categorization were estimated from the 200 bootstrap sam-ples and used to calculate ap value for the difference, using the paired t-test. Statistical analyses were performed with SPSS 24.0 (SPSS Inc., Chicago, IL, USA) and R 3.4.0 (R Core Team 2017. R Foundation for Statistical Comput-ing, Vienna, Austria. URL:https://www.R-project.org/).
Results
Patient and transplant characteristics
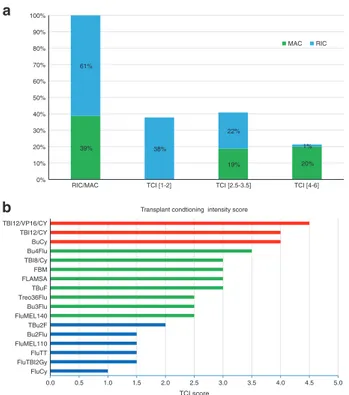
The patient and transplant characteristics of the 8255 AML patients (median age 55.6 years, range 45–65) are shown in Table 2. All patients were transplanted in first complete remission. The conditioning regimens used are listed in Supplementary Table 1 and comprised RIC in 61% and MAC in 39% of the patients (Fig.1a). Acute graft-versus-host disease (GVHD) II-IV occurred in 17.2% (95% con-fidence interval [CI]: 16.3–18.1), acute GVHD III-IV in
8.2% (95% CI: 7.7–8.9), chronic GVHD in 39.1% (95% CI: 38–40.3) and extensive chronic GVHD in 17.3% (95% CI: 16.4–18.2). The 2-year outcomes for the entire cohort were as follows: NRM 17% (95% CI: 16.1–17.8), REL 26.7% (95% CI: 25.7–27.7), LFS 56.4% (95% CI: 55.2–57.5) and OS 61.6% (95% CI: 60.4–62.7). Causes of NRM are given in Supplementary Table 2.
TCI scores
The TCI score ranged from 1 to 6 (median 2.5) with a median of 2 (range, 1–5.5) in the RIC group and 4 (range, 2.5–6) in the MAC group (p < 0.001). Those scores relating to very few patients were pooled with patient groups assigned to subsequent or previous scores: 26 patients with a TCI score of 1 were combined with patients with a score of 1.5 while 42 patients with TCI scores > 4.5 (27, 13 and 2 patients with TCI scores 5.0, 5.5 and 6.0, respectively) were combined with patients with a score equal to 4.5. After merging TCI values that did not improve the likelihood of the Cox model for NRM at d 180 (p ≥ 0.10), three TCI groups (low, intermediate and high) were derived with respective scores of [1,2], [2.5–3.5] and [4–6].
The distribution according to TCI score group was as follows: 38% had a low [1, 2], 41% an intermediate [2.5–3.5] and 21% a high [4–6] TCI score regimen (Fig. 1a). Table 2 shows patient, disease and transplant characteristics of TCI groups. Nearly all patients with a high TCI score [4–6] regimen received MAC (94%) and all low TCI [1,2] patients received RIC (100%), indicative of good concordance between RIC/MAC and low/high TCI score grouping. Notably, the intermediate TCI [2.5–3.5] group included patients with MAC and RIC regimens in about the same fraction (54 and 46%, respectively). As expected, there was an inverse relationship between age and TCI score with a median age of 58.1 years, 56.2 years and 50.7 years for the low, intermediate, and high TCI groups, respectively (p < 0.001). Patients in the low TCI group were more likely to have a low KPS and high HCT-CI (p < 0.0001). Graft failure was low and did not differ between TCI groups (p = 0.68). Figure1b shows the TCI score for classical and commonly used conditioning regimens.
Performance of the TCI
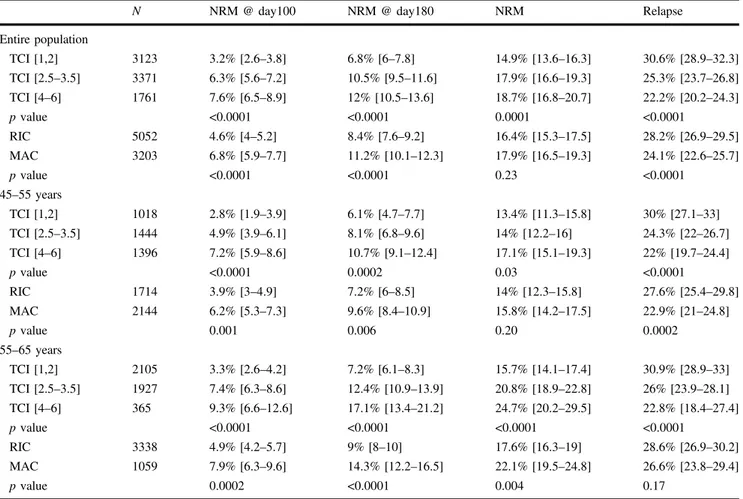
In univariate analysis, d 100 and d 180 NRM for patients in the low TCI [1,2] group was statistically different as com-pared with intermediate TCI [2.5–3.5] (p < 0.0001) and high TCI [4–6] group patients (p < 0.0001) (Table 3). Similar results were found when patients between 45 and 55 years of age (47% of the cohort) and 55–65 years of age (53% of the cohort) were analyzed separately (Fig. 2) or when the analysis was restricted to the group of patients (n = 220)
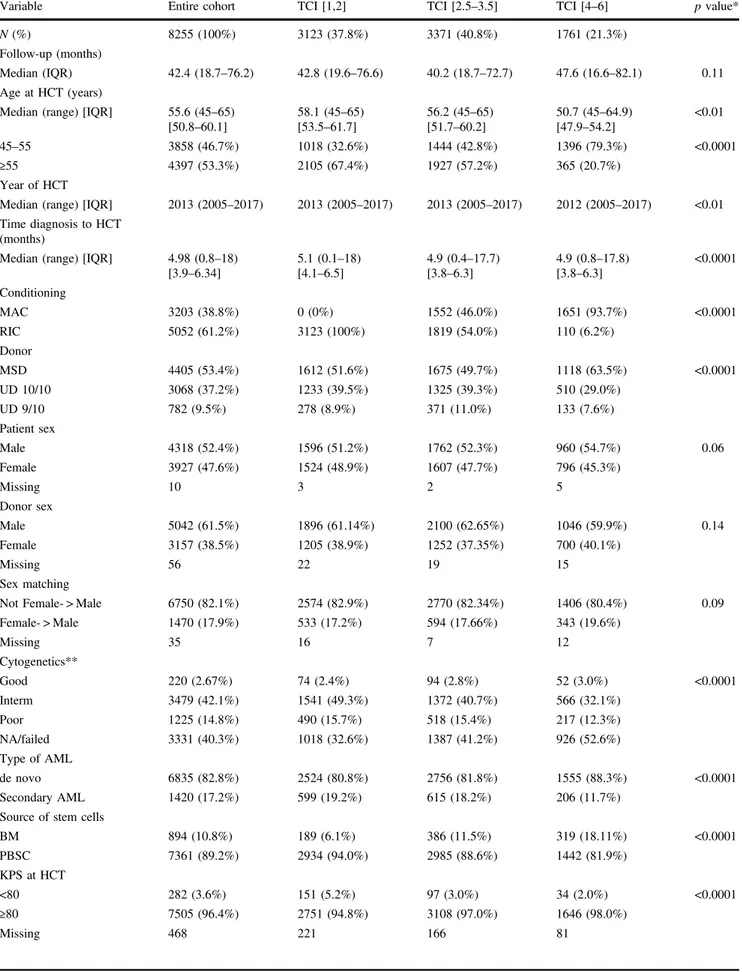
Table 2 Patient and transplant characteristics.
Variable Entire cohort TCI [1,2] TCI [2.5–3.5] TCI [4–6] p value*
N (%) 8255 (100%) 3123 (37.8%) 3371 (40.8%) 1761 (21.3%)
Follow-up (months)
Median (IQR) 42.4 (18.7–76.2) 42.8 (19.6–76.6) 40.2 (18.7–72.7) 47.6 (16.6–82.1) 0.11 Age at HCT (years)
Median (range) [IQR] 55.6 (45–65) [50.8–60.1] 58.1 (45–65) [53.5–61.7] 56.2 (45–65) [51.7–60.2] 50.7 (45–64.9) [47.9–54.2] <0.01 45–55 3858 (46.7%) 1018 (32.6%) 1444 (42.8%) 1396 (79.3%) <0.0001 ≥55 4397 (53.3%) 2105 (67.4%) 1927 (57.2%) 365 (20.7%) Year of HCT
Median (range) [IQR] 2013 (2005–2017) 2013 (2005–2017) 2013 (2005–2017) 2012 (2005–2017) <0.01 Time diagnosis to HCT
(months)
Median (range) [IQR] 4.98 (0.8–18) [3.9–6.34] 5.1 (0.1–18) [4.1–6.5] 4.9 (0.4–17.7) [3.8–6.3] 4.9 (0.8–17.8) [3.8–6.3] <0.0001 Conditioning MAC 3203 (38.8%) 0 (0%) 1552 (46.0%) 1651 (93.7%) <0.0001 RIC 5052 (61.2%) 3123 (100%) 1819 (54.0%) 110 (6.2%) Donor MSD 4405 (53.4%) 1612 (51.6%) 1675 (49.7%) 1118 (63.5%) <0.0001 UD 10/10 3068 (37.2%) 1233 (39.5%) 1325 (39.3%) 510 (29.0%) UD 9/10 782 (9.5%) 278 (8.9%) 371 (11.0%) 133 (7.6%) Patient sex Male 4318 (52.4%) 1596 (51.2%) 1762 (52.3%) 960 (54.7%) 0.06 Female 3927 (47.6%) 1524 (48.9%) 1607 (47.7%) 796 (45.3%) Missing 10 3 2 5 Donor sex Male 5042 (61.5%) 1896 (61.14%) 2100 (62.65%) 1046 (59.9%) 0.14 Female 3157 (38.5%) 1205 (38.9%) 1252 (37.35%) 700 (40.1%) Missing 56 22 19 15 Sex matching
Not Female- > Male 6750 (82.1%) 2574 (82.9%) 2770 (82.34%) 1406 (80.4%) 0.09 Female- > Male 1470 (17.9%) 533 (17.2%) 594 (17.66%) 343 (19.6%) Missing 35 16 7 12 Cytogenetics** Good 220 (2.67%) 74 (2.4%) 94 (2.8%) 52 (3.0%) <0.0001 Interm 3479 (42.1%) 1541 (49.3%) 1372 (40.7%) 566 (32.1%) Poor 1225 (14.8%) 490 (15.7%) 518 (15.4%) 217 (12.3%) NA/failed 3331 (40.3%) 1018 (32.6%) 1387 (41.2%) 926 (52.6%) Type of AML de novo 6835 (82.8%) 2524 (80.8%) 2756 (81.8%) 1555 (88.3%) <0.0001 Secondary AML 1420 (17.2%) 599 (19.2%) 615 (18.2%) 206 (11.7%)
Source of stem cells
BM 894 (10.8%) 189 (6.1%) 386 (11.5%) 319 (18.11%) <0.0001 PBSC 7361 (89.2%) 2934 (94.0%) 2985 (88.6%) 1442 (81.9%) KPS at HCT <80 282 (3.6%) 151 (5.2%) 97 (3.0%) 34 (2.0%) <0.0001 ≥80 7505 (96.4%) 2751 (94.8%) 3108 (97.0%) 1646 (98.0%) Missing 468 221 166 81
with good risk cytogenetics (d 180 NRM= 1.5%, 11.9% and 14.6% in TCI [1,2], [2.5–3.5] and [4–6], respectively, p = 0.02). TCI scores also predicted overall NRM and REL with the differences being observed in both age groups (Table 3). In multivariate analysis, there was a monotonic increase in risk of early NRM with each TCI group from low to high (Table 4). Patients in the intermediate TCI regimen group had a significantly higher NRM at d 100 (HR 2.0; 95% CI, 1.54–2.59, p < 0.0001) and at d 180 (HR 1.63; 95% CI, 1.35–1.98, p < 0.0001) when compared with the low TCI group. The HRs for d 100 and d 180 NRM in patients receiving a high TCI [4–6] score regimen was 3.06 (95% CI, 2.24–4.16, p < 0.0001) and 2.31 (95% CI, 1.83–2.92, p < 0.0001) when compared with low TCI [4–6] and 1.53 (95% CI, 1.19–1.97, p = 0.001) and 1.41 (95% CI, 1.15–1.73, p = 0.0008) when compared with the inter-mediate TCI [2.5–3.5] group, respectively. TCI grouping was also highly significantly associated with overall NRM
and REL (Table4). Compared with low TCI group patients, the relapse risk for patients receiving intermediate and high score TCI regimens was significantly decreased with an HR of 0.81 (95% CI, 0.73–0.89, p < 0.0001) and 0.70 (95% CI, 0.61–0.8, p < 0.0001), respectively. The HRs for NRM for the intermediate (1.27; 95% CI, 1.12–1.44) and the high TCI (1.44; 95% CI 1.22–1.69) groups also remained highly predictive (p = 0.0003 and p < 0.0001 relative to the low TCI group, respectively). We re-run the multivariable Cox model in the patients with available HCT-CI information (n = 4047, 50% of the entire cohort) and TCI remained significantly associated with early NRM, NRM and REL (Supplementary Table 3).
When the RIC/MAC categorization was used in the multivariate model, RIC/MAC also predicted early NRM, overall NRM and REL (Supplementary Table 4). In both classification systems (TCI or RIC/MAC), early NRM was also independently influenced by age, performance status Table 2 (continued)
Variable Entire cohort TCI [1,2] TCI [2.5–3.5] TCI [4–6] p value*
<90 1680 (22.2%) 790 (28.2%) 632 (20.0%) 258 (15.9%) <0.0001 ≥90 5899 (77.8%) 2007 (71.8%) 2524 (80.0%) 1368 (84.1%) Missing 676 326 215 135 HCT-CI score HCT-CI= 0 2305 (57.0%) 763 (52.5%) 1043 (55.8%) 499 (68.6%) <0.0001 HCT-CI= 1 or 2 881 (21.7%) 326 (22.5%) 422 (22.6%) 133 (18.3%) HCT-CI≥ 3 861 (21.3%) 363 (25%) 403 (21.6%) 95 (13.1%) Missing 4208 1671 1503 1034 In vivo TCD No 3459 (42.2%) 1344 (43.2%) 1099 (32.8%) 1016 (58.4%) <0.0001 Yes 4742 (57.8%) 1767 (56.8%) 2251 (67.2%) 724 (41.6%) Missing 54 12 21 21 Patient CMV CMV negative 2398 (29.5%) 1008 (32.7%) 970 (29.2%) 420 (24.5%) <0.0001 CMV positive 5727 (70.5%) 2078 (67.3%) 2353 (70.8%) 1296 (75.5%) Missing 130 37 48 45 Donor CMV CMV negative 3577 (44.5%) 1448 (47.3%) 1471 (44.7%) 658 (38.8%) <0.0001 CMV positive 4469 (55.5%) 1612 (52.7%) 1821 (55.3%) 1036 (61.2%) Missing 209 63 79 67 Engraftment Graft failure 114 (1.4%) 39 (1.3%) 50 (1.5%) 25 (1.4%) 0.68 Engrafted 8035 (98.2%) 3052 (98.4%) 3265 (98.1%) 1718 (98.3%) Graft loss 30 (0.4%) 11 (0.4%) 15 (0.5%) 4 (0.2%) Missing 76 21 41 14
AML acute myeloid leukemia, CMV cytomegalovirus, BM bone marrow, HCT allogeneic hematopoietic cell transplantation, CI HCT-comorbidity index,IQR interquartile ration, KPS Karnofsky Performance Status, MAC myeloablative conditioning, MSD matched sibling donor, NA not available, PBSC peripheral blood stem cells, RIC reduced-intensity conditioning, TCD T-cell depletion, TCI transplant conditioning intensity score,UD unrelated donor.
and donor and overall NRM was in addition predicted by female to male transplant, in vivo T-cell depletion, year of HCT and CMV serostatus (Table 4). Relapse associated with secondary AML, poor cytogenetics, unrelated donor, female to male transplant and a PBSC graft. On multivariate analysis, neither LFS or OS were associated with con-ditioning intensity stratified by TCI (Table4) or RIC/MAC status (Supplementary Table 4).
Validation of the TCI and comparison with RIC/MAC
The TCI continued to be strongly associated with early NRM, overall NRM and REL on 200 bootstrap samples. The predictive ability of the TCI estimated byc-statistics is shown in Table5. Compared with the model including RIC/ MAC with bootstrapping, the c-statistics for early and overall NRM, REL, LFS and OS were significantly better (p < 0.0001 for NRM, REL and LFS, p = 0.007 for OS).
The intermediate TCI [2.5
–3.5] group
We focused on the intermediate TCI [2.5–3.5] group (n = 3371, median age 56.2 years) in which nearly half (54%) of the patients had received MAC and the other 46% received a RIC regimen (Fig.1a). Within this group, the median TCI score of RIC patients was 2.5 (range, 2.5–3.5) and of MAC patients was 3.5 (range, 2.5–3.5) (p < 0.0001). In the uni-variate analysis, d 100 NRM, d 180 NRM, overall NRM, REL, LFS, and OS were not different between patients who had received a TCI [2.5–3.5]-RIC or a TCI [2.5–3.5]-MAC regimen (Table6).
Discussion
Risk assessment for allogeneic HCT is based on scores and indices developed specifically to measure comorbidity burden (e.g., HCT-CI) [15], disease risk (e.g., DRI) [16] and conditioning regimen intensity (RIC/MAC). As transplan-tation practices change, these prognostic tools need to be updated [17]. In this study, we evaluated a new tool for a better and more standardized stratification of transplant conditioning intensity, which we favor to replace the current RIC/MAC classification scheme.
The TCI was developed in a way that refines the currently used RIC/MAC classification system. We used the generally accepted myeloablative threshold doses to define the middle drug intensity [5, 6]. We incorporated in the TCI compo-nents that are not considered in the current RIC/MAC classification (purine analogs, cyclophosphamide, cytar-abine, etoposide and carmustine), but we intentionally gave them a lower integer weighting adhering to the RIC/MAC consensus that these drugs add less to the regimen intensity stratification. All of these agents have a well-documented toxicity and antileukemic activity and thus it is very likely that they influence NRM and REL [13]. Thus, TCI is gen-erally based on consensus RIC/MAC definitions and can be easily and reproducibly calculated for every regimen.
Although TCI scoring stratified the regimens on a con-tinuum (Fig. 1b), it is unlikely that the clinical impact of TCI is linear. We evaluated TCI categories with possible
39% 19% 20% 61% 38% 22% 1% 0% 10% 20% 30% 40% 50% 60% 70% 80% 90% 100%
RIC/MAC TCI [1-2] TCI [2.5-3.5] TCI [4-6] MAC RIC a b 0.0 0.5 1.0 1.5 2.0 2.5 3.0 3.5 4.0 4.5 5.0 FluCy FluTBI2Gy FluTT FluMEL110 Bu2Flu TBu2F FluMEL140 Bu3Flu Treo36Flu TBuF FLAMSA FBM TBI8/Cy Bu4Flu BuCy TBI12/CY TBI12/VP16/CY TCI score Transplant condtioning intensity score
Fig. 1 Distribution of conditioning regimes according to their intensity. aThe graphic shows the distribution of the conditioning regimens used in 8255 patients with AML transplanted atfirst com-plete remission according to their intensity. RIC/MAC is according to EBMT definition. Transplant Conditioning intensity (TCI) score was calculated for each individual transplant and was allocated to the low TCI [1,2], intermediate TCI [2.5–3.5] or high TCI [4–6] group. b The graphic shows the calculated TCI score for classical and commonly used conditioning regimens. The different colors denote the different TCI groups (green: low TCI [1,2], blue: intermediate TCI [2.5–3.5] and red: high TCI [4–6]). TBI(12)/VP16/CY = 12 Gray TBI, Etopo-side 50 mg/kg, Cyclophosphamide 60 mg/kg; TBI(12)/CY= 12 Gray TBI, Cyclophosphamide 120 mg/kg; BuCy= Busulfan 4 days 3.2 mg/ kg/day IV or 4 mg/kg/day oral), Cyclophosphamide 120 mg/kg; Bu(4/ 3/2)Flu= Busulfan 4,3,2 days, Fludarabine 90–150 mg/kg; FBM = Fludarabine 120 mg/kg, Carmustine (BCNU) 300 mg/m2, Melphalan 110 mg/m2; FLAMSA= Fludarabine 120 mg/kg, Busulfan 2 days (or TBI 4 Gray), Aracytine 8 g/m2, Cyclophosphamide 80 mg/kg and Amsacrine 400 mg/m2; TBu(3/2)F= Busulfan 3/2 days, Thiotepa 5 mg/kg, Fludarabine 120–150 mg/kg; Treo36Flu = Treosulfan 36 mg/ m2, Fludarabine 120–150 mg/m2; FluMEL (140/110) = Fludarabine 90–150 mg/kg, Melphalan 110/140 mg/m2; FluTBI (2 Gy) = Fludar-abine 90 mg/kg, TBI 2 Gray; FluTT= Fludarabine 90 mg/kg, Thiotepa 15 mg/kg; FluCy= Fludarabine 90–120 mg/kg, Cyclophosphamide 50 mg/kg.
clinical relevance regarding early NRM, which yielded a 3-group risk scheme. While a concordance between low/high TCI and RIC/MAC groups was observed, the intermediate TCI group, which captured nearly half of the patients,
included both RIC and MAC regimens in the same fraction (Fig. 1a). Thus, TCI and the RIC/MAC grouping schemes differ substantially from each other and can be used as separate classification systems.
Table 3 Univariate analysis of transplant outcomes.
N NRM @ day100 NRM @ day180 NRM Relapse
Entire population TCI [1,2] 3123 3.2% [2.6–3.8] 6.8% [6–7.8] 14.9% [13.6–16.3] 30.6% [28.9–32.3] TCI [2.5–3.5] 3371 6.3% [5.6–7.2] 10.5% [9.5–11.6] 17.9% [16.6–19.3] 25.3% [23.7–26.8] TCI [4–6] 1761 7.6% [6.5–8.9] 12% [10.5–13.6] 18.7% [16.8–20.7] 22.2% [20.2–24.3] p value <0.0001 <0.0001 0.0001 <0.0001 RIC 5052 4.6% [4–5.2] 8.4% [7.6–9.2] 16.4% [15.3–17.5] 28.2% [26.9–29.5] MAC 3203 6.8% [5.9–7.7] 11.2% [10.1–12.3] 17.9% [16.5–19.3] 24.1% [22.6–25.7] p value <0.0001 <0.0001 0.23 <0.0001 45–55 years TCI [1,2] 1018 2.8% [1.9–3.9] 6.1% [4.7–7.7] 13.4% [11.3–15.8] 30% [27.1–33] TCI [2.5–3.5] 1444 4.9% [3.9–6.1] 8.1% [6.8–9.6] 14% [12.2–16] 24.3% [22–26.7] TCI [4–6] 1396 7.2% [5.9–8.6] 10.7% [9.1–12.4] 17.1% [15.1–19.3] 22% [19.7–24.4] p value <0.0001 0.0002 0.03 <0.0001 RIC 1714 3.9% [3–4.9] 7.2% [6–8.5] 14% [12.3–15.8] 27.6% [25.4–29.8] MAC 2144 6.2% [5.3–7.3] 9.6% [8.4–10.9] 15.8% [14.2–17.5] 22.9% [21–24.8] p value 0.001 0.006 0.20 0.0002 55–65 years TCI [1,2] 2105 3.3% [2.6–4.2] 7.2% [6.1–8.3] 15.7% [14.1–17.4] 30.9% [28.9–33] TCI [2.5–3.5] 1927 7.4% [6.3–8.6] 12.4% [10.9–13.9] 20.8% [18.9–22.8] 26% [23.9–28.1] TCI [4–6] 365 9.3% [6.6–12.6] 17.1% [13.4–21.2] 24.7% [20.2–29.5] 22.8% [18.4–27.4] p value <0.0001 <0.0001 <0.0001 <0.0001 RIC 3338 4.9% [4.2–5.7] 9% [8–10] 17.6% [16.3–19] 28.6% [26.9–30.2] MAC 1059 7.9% [6.3–9.6] 14.3% [12.2–16.5] 22.1% [19.5–24.8] 26.6% [23.8–29.4] p value 0.0002 <0.0001 0.004 0.17
Values are given in % and [range].
NRM nonrelapse mortality. Others see Table2.
0.5 a b 0.4 Incidence of NRM 0.3 0.2 0.1 0.0 0 30 60 90
Time from transplant (days) Number of at-risk patients
1018 995 949 890 787 738 701 1444 1409 1360 1300 1174 1107 1055 1396 1361 1302 1214 1080 998 856 2105 2067 1958 1832 1606 1509 1434 1927 1869 1785 1674 1481 1402 1326 365 352 331 313 282 258 243
Number of at-risk patients
120 150 180 0 30 60 90
Time from transplant (days)
120 150 180 [1-2] [2.5-3.5] [4-6] [1-2] [2.5-3.5] [4-6] 0.5 0.4 Incidence of NRM 0.3 0.2 0.1 0.0
Fig. 2 Early nonrelapse mortality (NRM) according to TCI. a Early NRM in the subgroup of patients aged 45–55 years at transplant (n = 3858). b Early NRM in patients aged between 55 and 65 years (n = 4397).
Table 4 Multivariate analysis of transplant outcomes according to TCI strati fi cation of conditioning regimen intensity. Variable NRM @ day100 NRM @ day180 NRM Relapse LFS OS TCI [1,2] 1 (reference) 1 1 1 1 1 [2.5 –3.5] 2 (1.54 –2.59), <0.0001 1.63 (1.35 –1.98), <0.0001 1.27 (1.12 –1.44), 0.0003 0.81 (0.73 –0.89), <0.0001 0.96 (0.89 –1.04), 0.28 1.02 (0.94 –1.1), 0.68 [4 –6] 3.06 (2.24 –4.16), <0.0001 2.31 (1.83 –2.92), <0.0001 1.44 (1.22 –1.69), <0.0001 0.7 (0.61 –0.8), <0.0001 0.93 (0.84 –1.03), 0.17 1 (0.89 –1.11), 0.97 Patient age (per 10 years) 1.34 (1.09 –1.64), 0.005 1.45 (1.24 –1.69), <0.0001 1.43 (1.28 –1.6), <0.0001 1.07 (0.98 –1.17), 0.12 1.2 (1.12 –1.28), <0.0001 1.25 (1.16 –1.34), <0.0001 Year of HCT 0.98 (0.95 –1.01), 0.29 0.99 (0.96 –1.01), 0.29 0.98 (0.96 –0.99), 0.02 1 (0.99 –1.02), 0.70 0.99 (0.98 –1), 0.22 0.99 (0.98 –1), 0.10 Sec. AML 1.07 (0.83 –1.38), 0.59 0.89 (0.72 –1.09), 0.25 1.04 (0.9 –1.19), 0.63 1.27 (1.14 –1.42), <0.0001 1.18 (1.08 –1.28), 0.0002 1.15 (1.05 –1.25), 0.003 Cytogenetics Good 1 (reference) 1 1 1 1 1 Interm 0.80 (0.43 –1.48), 0.48 0.81 (0.51 –1.3), 0.39 0.89 (0.64 –1.26), 0.52 1.54 (1.07 –2.2), 0.02 1.19 (0.93 –1.52), 0.16 1.26 (0.96 –1.65), 0.09 Poor 0.925 (0.48 –1.77), 0.81 0.89 (0.54 –1.46), 0.64 0.99 (0.7 –1.43), 0.99 3.22 (2.24 –4.64), <0.0001 2.02 (1.57 –2.6), <0.0001 2.1 (1.6 –2.77), <0.0001 NA/failed 1.2 (0.65 –2.21), 0.56 1.13 (0.71 –1.79), 0.61 1.14 (0.81 –1.59), 0.46 1.74 (1.21 –2.49), 0.003 1.42 (1.11 –1.81), 0.005 1.53 (1.17 –2), 0.002 KPS at HCT ≥90 0.63 (0.50 –0.79), <0.0001 0.67 (0.57 –0.80), <0.0001 0.72 (0.63 –0.81), <0.0001 0.99 (0.9 –1.11), 0.94 0.87 (0.80 –0.94), 0.0007 0.84 (0.77 –0.91), <0.0001 Donor MSD 1 (reference) 1 1 1 1 1 UD 10/10 1.64 (1.28 –2.09), <0.0001 1.64 (1.36 –1.98), <0.0001 1.52 (1.33 –1.73), <0.0001 0.79 (0.71 –0.87), <0.0001 1.01 (0.93 –1.09), 0.82 1.07 (0.99 –1.17), 0.10 UD 9/10 2.01 (1.45 –2.8), <0.0001 2.25 (1.75 –2.88), <0.0001 1.94 (1.61 –2.34), <0.0001 0.83 (0.70 –0.97), 0.02 1.16 (1.03 –1.31), 0.02 1.27 (1.12 –1.44), 0.0002 Female to male 0.86 (0.65 –1.14), 0.30 1.03 (0.83 –1.26), 0.81 1.28 (1.12 –1.47), 0.0004 0.8 (0.70 –0.9), 0.0003 0.97 (0.88 –1.06), 0.5 1.04 (0.95 –1.14), 0.41 PB vs BM 0.98 (0.72 –1.35), 0.91 1.06 (0.82 –1.36), 0.67 1.16 (0.97 –1.39), 0.11 0.84 (0.73 –0.97), 0.02 0.96 (0.86 –1.07), 0.44 1.02 (0.91 –1.15), 0.69 in vivo TCD 0.97 (0.77 –1.24), 0.82 0.85 (0.71 –1.01), 0.07 0.771 (0.68 –0.88), <0.0001 1.03 (0.93 –1.14), 0.53 0.93 (0.86 –1), 0.06 0.91 (0.84 –0.99), 0.03 Patient CMV 1.04 (0.82 –1.31), 0.76 1.14 (0.95 –1.36), 0.17 1.16 (1.02 –1.32), 0.02 1.02 (0.92 –1.13), 0.68 1.07 (0.99 –1.16), 0.09 1.08 (0.99 –1.17), 0.08 Donor CMV 1.03 (0.83 –1.28), 0.81 1 (0.85 –1.19), 0.96 1.14 (1.02 –1.29), 0.03 0.98 (0.89 –1.08), 0.66 1.04 (0.97 –1.12), 0.30 1.06 (0.98 –1.14), 0.16 Values are given in HR (95% CI), p value. LFS Leukemia-free survival, OS Overall survival. Others see Table 2 .
The TCI proved to be the most important determinant of early and overall NRM with multivariable analysis, also when adjusted for HCT-CI in nearly 4000 cases with available data. The risk groups based on the TCI scores were more evenly distributed and provided better discrimination (based on the c-statistic) of NRM than the risk groups defined by the RIC/MAC classification. This improvement is probably attributed to the use of weighted scores based on the threshold of myeloablative doses, which subdivided the MAC group by placing 19% of the “borderline” MAC regimens in the intermediate TCI group. Moreover, the assignment of weighted scores for all components probably captured a group of patients who received an“intensified” RIC. Indeed, about 15% of the RIC regimens incorporated at least three components instead of the commonly used two in “standard” RIC regimens (Supplementary Table 1).
TCI was highly predictive for relapse risk and performed better than RIC/MAC. The correlation between regimen intensity and relapse in AML has been documented in many retrospective reports [18, 19] and prospective studies [20–22]. Not surprisingly, both TCI and RIC/MAC group-ing had a weak association with LFS and OS on multi-variate analysis. This reflects the contradictory effect of conditioning intensity in NRM and relapse and the strong likelihood of selection bias in the choice of conditioning. Two prospective randomized trials comparing MAC versus RIC in AML [20] and secondary AML or MDS [21] found no significant difference in LFS and OS. Another
randomized trial suggested a better OS in AML patients treated with MAC versus RIC, however, data closure in this study was at 18-months post-transplant and thus additional follow-up is warranted until a definitive conclusion can be done [22].
A large component of the improvement in intensity reclassification achieved by the TCI is that it identifies a distinct subgroup of RIC and MAC regimens that had identical outcomes in all aspects (Table 6). This inter-mediate TCI [2.5–3.5] group probably captured the so called “reduced toxicity conditioning” regimens that were specifically designed by various transplant groups in a way to optimize dose intensity while safely minimizing NRM and which were not readily amenable to the earlier RIC/ MAC approach [7]. This is illustrated in Fig.1b which gives examples of some very commonly used “reduced toxicity conditioning” regimens, such as fludarabine-based regimens which incorporate two alkylating agents in sub-myeloablative doses (e.g., Fludarabine–BCNU–Melphalan [9], Thiotepa–Busuplhan–Fludarabine [23]), the sequential conditioning regimens (e.g., FLAMSA) [10] or the Busulfan–Fludarabine regimen which has lower toxicity
when directly compared with classical MAC
Busulfan–Cyclophosphamide combination [24].
There are limitations in this study. First, weightings were based on scientific and clinical background and not on sta-tistical consideration. However, we used RIC/MAC con-sensus rules to define dose levels and integer weights for Table 6 The intermediate TCI [2.5–3.5] group.
RIC/MAC N NRM @ day 100 NRM @ day 180 NRM Relapse LFS OS
RIC 1819 6.9% [5.8–8.1] 10.9% [9.5–12.4] 18.7% [16.9–20.6] 24.5% [22.4–26.6] 56.8% [54.4–59.3] 62.2% [59.8–64.6] MAC 1552 5.7% [4.6–6.9] 10.1% [8.7–11.7] 17% [15.0–19.0] 26.2% [23.9–28.5] 56.8% [54.2–59.5] 61.2% [58.6–63.8]
p value 0.15 0.43 0.02 0.05 0.92 0.62
Values are given in % and [range].
Table 5 Validation of TCI versus RIC/MAC on 200 bootstrap samples.
NRM @ day 100 NRM @ day 180 NRM Relapse LFS OS
Cox (HR, 95% CI) TCI [1,2] 1 (reference) 1 1 1 1 1 TCI [2.5–3.5] 1.77 (1.38–2.27) 1.63 (1.36–1.97) 1.27 (1.14–1.45) 0.79 (0.71–0.87) 0.94 (0.87–1.03) 1.02 (0.94–1.09) TCI [4–6] 2.97 (2.2–4.06) 2.36 (1.88–2.94) 1.51 (1.28–1.77) 0.7 (0.63–0.82) 0.95 (0.85–1.07) 1 (0.9–1.12) p, TCI [2.5–3.5] vs [1,2] 0.005 0.01 0.03 0.01 0.64 0.94 p, TCI [4–6] vs [1,2] 0.005 0.005 0.005 0.005 0.79 0.95 C-statistic (95% CI) TCI grouping 0.6747 0.6416 0.6201 0.5861 0.5604 0.5779 (0.6729–0.6764) (0.6401–0.6430) (0.6190–0.6212) (0.5852–0.5869) (0.5597–0.5611) (0.5771–0.5787) RIC/MAC 0.6436 0.6219 0.6113 0.5784 0.5595 0.5713 (0.6419–0.6454) (0.6205–0.6234) (0.6102–0.6124) (0.5776–0.5793) (0.5588–0.5602) (0.5705–0.5721) p value <0.0001 <0.0001 <0.0001 <0.0001 <0.0001 0.007
most components, and thus it is likely that the TCI has at least the same validity as the original RIC/MAC scheme. Second, we have attempted to minimize the possible lim-itations inherent in retrospective registry-based studies by studying a large patient cohort, by double-checking the RIC/ MAC information and by using early NRM as primary endpoint for estimating the impact of TCI, an outcome which is very reliable documented in registry databases and is not influenced by events that evolve over time (e.g., chronic GVHD). Third, beyond the internal bootstrap vali-dation used in this study an external valivali-dation in a truly distinct database or, even better, prospectively is warranted [25,26]. Fourth, to confirm generalizability it is necessary to determine in future studies whether the model continues to perform as well across different diseases (except AML) and disease risk groups. However, since NRM is not influenced by disease risk [16], it is very likely that the predictive ability of TCI for early NRM applies to the entire spectrum of HCT patients. Fifth, the applicability and the value of TCI in other age groups, e.g., pediatrics, should be further evaluated. Sixth, one must keep in mind that drugs have differing mechanisms of actions and toxicity profiles and therefore both NRM and relapse may be besides intensity gradient also influenced in a regimen-specific manner [18,27]. The integer weights are given arbitrarily and do not measure such“qualitative” factors (e.g., drug–drug interac-tions, drugs given in targeted doses, pharmacokinetics). In addition, the current TCI does not account for antisera used for GVHD prevention or for drugs given after graft infusion, such as post-transplant cyclophosphamide [28]. Future pro-spective trials including such aspects and the use of machine learning algorithms will be important to strengthen and recalibrate this index [29]. The prototype TCI presented here provides the baseline against which the predictive ability of these refined indices can be compared.
We propose the TCI scheme as a valid improvement on the RIC/MAC stratification system to define and measure transplant conditioning intensity. Compared with RIC/ MAC, TCI provided better assessment of NRM and relapse risk; providedfiner categorization and better discriminating ability; accounts for new regimens that were not readily amenable to the RIC/MAC approach; could be easily and precisely calculated for any patient; and could capture subtle regimen intensity variations (e.g., when reducing the dose of a component due to patient-related factors). TCI was effective in predicting NRM and relapse independently of other validated prognostic factors and thus TCI may be used in association with HCT-CI, DRI and donor type to assess transplant outcome. In every day clinical practice TCI may help to optimize conditioning intensity, thereby providing personalized treatment. We hope that future research will further confirm and validate the TCI in dif-ferent patient groups, will refine the integer weights of each
agent and modify the TCI to improve its sensitivity and specificity. This TCI concept may readily accommodate new conditioning regimen components, rendering it future-proof. We anticipate that the TCI scheme has the potential to become a universal, well-defined and standard termi-nology for use in registry databases, in the literature and in clinical trials, thus facilitating comparative studies.
Acknowledgements We thank Emmanuelle Polge and the ALWP EBMT staff for help with data management. The study was accom-plished thanks to the contributing centers of the EBMT registry which provided patient data; a complete list appears in the Supplementary Appendix. Following EBMT publication rules, co-authorship was offered to centers contributing the highest number of patients. Author contributions AS designed the study, performed research, analyzed data and wrote the paper; ML performed research, ana-lyzed data and edited the paper; BNS, AN and MM designed the study, performed research and edited the paper; RN, DB, CC, GS, UP, DBe, NM, JJC, AG, AH and LG provided patient data and commented on the paper; SG, MA, EB, FM, JE, ZP, FB, AR, CS, MG, NCG, FL, RS, JV, GB, FC, JS and AB designed the study and commented on the paper.
Compliance with ethical standards
Conflict of interest UP declared honoraria and research support by Celgene, Novartis, Amgen, Janssen. DB declared honoraria for con-sultancy and advisory board membership, travel support by medac GmbH, Wedel, Germany. The other authors have no disclosures related to the study.
Publisher’s note Springer Nature remains neutral with regard to jurisdictional claims in published maps and institutional affiliations.
References
1. Vriesendorp HM. Aims of conditioning. Exp Hematol. 2003;31:844–54.
2. Champlin R, Khouri I, Komblau S, Molidrem J, Giralt S. Rein-venting bone marrow transplantation. Nonmyeloablative pre-parative regimens and induction of graft-vs-malignancy effect. Oncology (Williston Park). 1999;13:621–8.
3. Bacigalupo A. Third EBMT/AMGEN Workshop on reduced-intensity conditioning allogeneic haemopoietic stem cell trans-plants (RIC-HSCT), and panel consensus. Bone Marrow Trans-plant. 2004;33:691–6.https://doi.org/10.1038/sj.bmt.1704416. 4. Slavin S, Nagler A, Naparstek E, Kapelushnik Y, Aker M,
Civi-dalli G, et al. Nonmyeloablative stem cell transplantation and cell therapy as an alternative to conventional bone marrow trans-plantation with lethal cytoreduction for the treatment of malignant and nonmalignant hematologic diseases. Blood. 1998;91:756–63. 5. Bacigalupo A, Ballen K, Rizzo D, Giralt S, Lazarus H, Ho V, et al. Defining the intensity of conditioning regimens: working definitions. Biol Blood Marrow Transplant. 2009;15:1628–33. https://doi.org/10.1016/j.bbmt.2009.07.004.
6. Giralt S, Ballen K, Rizzo D, Bacigalupo A, Horowitz M, Pasquini M, et al. Reduced-intensity conditioning regimen workshop: defining the dose spectrum. Report of a workshop convened by the center for international blood and marrow transplant research. Biol Blood Marrow Transplant. 2009;15:367–9. https://doi.org/ 10.1016/j.bbmt.2008.12.497.
7. Gyurkocza B, Sandmaier BM. Conditioning regimens for hema-topoietic cell transplantation: one size does not fit all. Blood. 2014;124:344–53.https://doi.org/10.1182/blood-2014-02-514778. 8. Sengsayadeth S, Savani BN, Blaise D, Malard F, Nagler A, Mohty
M. Reduced intensity conditioning allogeneic hematopoietic cell transplantation for adult acute myeloid leukemia in complete remission - a review from the Acute Leukemia Working Party of the EBMT. Haematologica. 2015;100:859–69.https://doi.org/10. 3324/haematol.2015.123331.
9. Marks R, Potthoff K, Hahn J, Ihorst G, Bertz H, Spyridonidis A, et al. Reduced-toxicity conditioning with fludarabine, BCNU, and melphalan in allogeneic hematopoietic cell transplantation: particular activity against advanced hematologic malignancies. Blood. 2008;112:415–25. https://doi.org/10.1182/blood-2007-08-104745.
10. Schmid C, Schleuning M, Ledderose G, Tischer J, Kolb HJ. Sequential regimen of chemotherapy, reduced-intensity con-ditioning for allogeneic stem-cell transplantation, and prophylactic donor lymphocyte transfusion in high-risk acute myeloid leukemia and myelodysplastic syndrome. J Clin Oncol. 2005;23:5675–87. https://doi.org/10.1200/jco.2005.07.061.
11. Bacigalupo A, Raiola AM, Lamparelli T, Gualandi F, Occhini D, Bregante S, et al. Thiotepa-based reduced intensity conditioning regimen: a 10 year follow up. Bone Marrow Transplant. 2007;40:1091–3.https://doi.org/10.1038/sj.bmt.1705863. 12. Shimoni A, Labopin M, Savani B, Hamladji RM, Beelen D, Mufti
G, et al. Intravenous busulfan compared with treosulfan-based conditioning for allogeneic stem cell transplantation in acute myeloid leukemia: a study on behalf of the acute leukemia working party of european society for blood and marrow trans-plantation. Biol Blood Marrow Transplant. 2018;24:751–7. https://doi.org/10.1016/j.bbmt.2017.12.776.
13. Langenhorst JB, van Kesteren C, van Maarseveen EM, Dorlo TPC, Nierkens S, Lindemans CA, et al. Fludarabine exposure in the conditioning prior to allogeneic hematopoietic cell transplan-tation predicts outcomes. Blood Adv. 2019;3:2179–87.https://doi. org/10.1182/bloodadvances.2018029421.
14. Steyerberg EW, Harrell FE Jr., Borsboom GJ, Eijkemans MJ, Vergouwe Y, Habbema JD. Internal validation of predictive models: efficiency of some procedures for logistic regression analysis. J Clin Epidemiol. 2001;54:774–81.
15. Sorror ML, Maris MB, Storb R, Baron F, Sandmaier BM, Mal-oney DG, et al. Hematopoietic cell transplantation (HCT)-specific comorbidity index: a new tool for risk assessment before allo-geneic HCT. Blood. 2005;106:2912–9. https://doi.org/10.1182/ blood-2005-05-2004.
16. Armand P, Gibson CJ, Cutler C, Ho VT, Koreth J, Alyea EP, et al. A disease risk index for patients undergoing allogeneic stem cell transplantation. Blood. 2012;120:905–13.https://doi.org/10.1182/ blood-2012-03-418202.
17. Potdar R, Varadi G, Fein J, Labopin M, Nagler A, Shouval R. Prognostic scoring systems in allogeneic hematopoietic stem cell transplantation: where do we stand? Biol Blood Marrow Trans-plant. 2017;23:1839–46. https://doi.org/10.1016/j.bbmt.2017.07. 028.
18. Eapen M, Brazauskas R, Hemmer M, Perez WS, Steinert P, Horowitz MM, et al. Hematopoietic cell transplant for acute myeloid leukemia and myelodysplastic syndrome: conditioning regimen intensity. Blood Adv. 2018;2:2095–103.https://doi.org/ 10.1182/bloodadvances.2018021980.
19. Martino R, de Wreede L, Fiocco M, van Biezen A, von dem Borne PA, Hamladji RM, et al. Comparison of conditioning regimens of various intensities for allogeneic hematopoietic SCT using HLA-identical sibling donors in AML and MDS with <10% BM blasts: a report from EBMT. Bone Marrow Transplant. 2013;48:761–70.https://doi.org/10.1038/bmt.2012.236.
20. Bornhauser M, Kienast J, Trenschel R, Burchert A, Hegenbart U, Stadler M, et al. Reduced-intensity conditioning versus standard conditioning before allogeneic haemopoietic cell transplantation in patients with acute myeloid leukaemia in first complete remission: a prospective, open-label randomised phase 3 trial. Lancet Oncol. 2012;13:1035–44. https://doi.org/10.1016/s1470-2045(12)70349-2.
21. Kroger N, Iacobelli S, Franke GN, Platzbecker U, Uddin R, Hubel K, et al. Dose-reduced versus standard conditioning followed by allogeneic stem-cell transplantation for patients with myelodys-plastic syndrome: a prospective randomized phase III study of the EBMT (RICMAC trial). J Clin Oncol. 2017;35:2157–64.https:// doi.org/10.1200/jco.2016.70.7349.
22. Scott BL, Pasquini MC, Logan BR, Wu J, Devine SM, Porter DL, et al. Myeloablative versus reduced-intensity hematopoietic cell transplantation for acute myeloid leukemia and myelodysplastic syndromes. J Clin Oncol. 2017;35:1154–61. https://doi.org/10. 1200/jco.2016.70.7091.
23. Saraceni F, Labopin M, Hamladji RM, Mufti G, Socie G, Shimoni A, et al. Thiotepa-busulfan-fludarabine compared to busulfan-fludarabine for sibling and unrelated donor transplant in acute myeloid leukemia infirst remission. Oncotarget. 2018;9:3379–93. https://doi.org/10.18632/oncotarget.23273.
24. Ben-Barouch S, Cohen O, Vidal L, Avivi I, Ram R. Busulfan fludarabine vs busulfan cyclophosphamide as a preparative regi-men before allogeneic hematopoietic cell transplantation: sys-tematic review and meta-analysis. Bone Marrow Transplant. 2016;51:232–40.https://doi.org/10.1038/bmt.2015.238.
25. Collins GS, Reitsma JB, Altman DG, Moons KG. Transparent reporting of a multivariable prediction model for individual prognosis or diagnosis (TRIPOD). Ann Intern Med. 2015;162:735–6.https://doi.org/10.7326/l15-5093-2.
26. Shouval R, Fein JA, Shouval A, Danylesko I, Shem-Tov N, Zlotnik M, et al. External validation and comparison of multiple prognostic scores in allogeneic hematopoietic stem cell trans-plantation. Blood Adv. 2019;3:1881–90.https://doi.org/10.1182/ bloodadvances.2019032268.
27. Fein JA, Shimoni A, Labopin M, Shem-Tov N, Yerushalmi R, Magen H, et al. The impact of individual comorbidities on non-relapse mortality following allogeneic hematopoietic stem cell transplantation. Leukemia. 2018;32:1787–94. https://doi.org/10. 1038/s41375-018-0185-y.
28. Battipaglia G, Labopin M, Kroger N, Vitek A, Afanasyev B, Hilgendorf I, et al. Posttransplant cyclophosphamide vs antithy-mocyte globulin in HLA-mismatched unrelated donor transplan-tation. Blood. 2019;134:892–9. https://doi.org/10.1182/blood. 2019000487.
29. Shouval R, Labopin M, Bondi O, Mishan-Shamay H, Shimoni A, Ciceri F, et al. Prediction of allogeneic hematopoietic stem-cell transplantation mortality 100 days after transplantation using a machine learning algorithm: a european group for blood and marrow transplantation acute leukemia working party retro-spective data mining study. J Clin Oncol. 2015;33:3144–51. https://doi.org/10.1200/JCO.2014.59.1339.
Affiliations
Alexandros Spyridonidis 1●Myriam Labopin2●Bipin N. Savani 3●Riitta Niittyvuopio4●Didier Blaise 5●
Charles Craddock6●Gerard Socié 7●Uwe Platzbecker8●Dietrich Beelen9●Noel Milpied10●Jan J. Cornelissen11●
Arnold Ganser12●Anne Huynh13●Laimonas Griskevicius14●Sebastian Giebel15●Mahmoud Aljurf16●Eolia Brissot2●
Florent Malard 2●Jordi Esteve17 ●Zinaida Peric18●Frédéric Baron19●Annalisa Ruggeri20●Christoph Schmid21●
Maria Gilleece 22●Norbert-Claude Gorin2●Francesco Lanza23●Roni Shouval24●Jurjen Versluis12●Gesine Bug25●
Yngvar Fløisand26 ●Fabio Ciceri27●Jamie Sanz 28●Ali Bazarbachi29●Arnon Nagler30●Mohamad Mohty2
1 Department of Internal Medicine, Bone Marrow Transplantation Unit, University Hospital of Patras, Patras, Greece
2 Service d’ Hématologie Clinique et Thérapie Cellulaire, Hospital Antoine, Sorbonne Université, Centre de Recherche Saint-Antoine (CRSA), Paris, France
3 Long term Transplant Clinic, Vanderbilt University Medical Center, Nashville, TN, USA
4 HUCH Comprehensive Cancer Center, Stem Cell Transplantation Unit, Helsinki, Finland
5 Centre de Recherche en Cancérologie de Marseille, Institut Paoli Calmettes, Marseille, France
6 University Hospital Birmingham NHS Trust, Birmingham, UK 7 Department of Hematology-BMT, Hospital St. Louis,
Paris, France
8 Hematology and Cellular Therapy, University Hospital, Leipzig, Germany
9 Department of Bone Marrow Transplantation, West German Cancer Center, University Hospital of Essen, Essen, Germany 10 CHU Bordeaux, Hospital Haut-Leveque, Pessac, France 11 Erasmus MC Cancer Institute, Department of Hematology,
Erasmus University Medical Center, Rotterdam, The Netherlands 12 Department of Hematology, Hemostasis, Oncology and Stem Cell Transplantation, Hannover Medical School, Hannover, Germany 13 CHU - Institut Universitaire du Cancer Toulouse, Oncopole, I.U.
C.T-O, Toulouse, France
14 Hematology, Oncology & Transfusion Center, Vilnius University Hospital Santaros Klinikos, Vilnius University, Vilnius, Lithuania 15 Department of Bone Marrow Transplantation and
Oncohematology, Maria Sklodowska-Curie Memorial Cencer Center and Institute of Oncology, Gliwice, Poland
16 Oncology Center, King Faisal Specialist Hospital & Research Center, Riyadh, Saudi Arabia
17 Hematology Department, IDIBAPS, Hospital Clinic, Barcelona, Spain
18 Department of Internal Medicine, University Hospital Centre Zagreb, School of Medicine, Zagreb, Croatia
19 GIGA-I3 Hematology, University and CHU of Liège, Liège, Belgium
20 Department of Pediatric Hematology and Oncology, IRCCS Bambino Gesù Children’s Hospital, Roma, Italy
21 Department of Hematology and Oncology, Universitäts-Klinikum Augsburg, Augsburg, Germany
22 Leeds Teaching Hospitals Trust, Leeds, UK
23 Hematology and Romagna Metropolitan Transplant Network, Hospital of Ravenna, Ravenna, Italy
24 Adult BMT Service, Memorial Sloan Kettering Cancer Center, New York, NY, USA
25 Department of Medicine 2, Hematology and Oncology, University Hospital, Goethe University, Frankfurt, Germany
26 Department of Hematology, Oslo University Hospital, Rikshospitalet, Oslo, Norway
27 Hematology and BMT Unit, IRCCS San Raffaele Scientific Institute, Milan, Italy
28 Hematology Department, University Hospital La Fe, Valencia, Spain
29 Bone Marrow Transplantation Program, American University of Beirut, Medical Center, Beirut, Lebanon
30 Hematology Division, BMT and Cord Blood Bank, Chaim Sheba Medical Center, Tel-Hashomer, Israel