HAL Id: hal-00330299
https://hal.archives-ouvertes.fr/hal-00330299
Submitted on 14 Oct 2008HAL is a multi-disciplinary open access
archive for the deposit and dissemination of sci-entific research documents, whether they are pub-lished or not. The documents may come from teaching and research institutions in France or abroad, or from public or private research centers.
L’archive ouverte pluridisciplinaire HAL, est destinée au dépôt et à la diffusion de documents scientifiques de niveau recherche, publiés ou non, émanant des établissements d’enseignement et de recherche français ou étrangers, des laboratoires publics ou privés.
Short-term temporal variations of heterotrophic
bacterial abundance and production in the open NW
Mediterranean Sea
G. Mével, Marc Vernet, J. F. Ghiglione
To cite this version:
G. Mével, Marc Vernet, J. F. Ghiglione. Short-term temporal variations of heterotrophic bacterial abundance and production in the open NW Mediterranean Sea. Biogeosciences Discussions, European Geosciences Union, 2008, 5 (3), pp.1899-1932. �hal-00330299�
BGD
5, 1899–1932, 2008 Short-term variation in bacterial abundance and production G. M ´evel et al. Title Page Abstract Introduction Conclusions References Tables Figures ◭ ◮ ◭ ◮ Back CloseFull Screen / Esc
Printer-friendly Version Interactive Discussion
Biogeosciences Discuss., 5, 1899–1932, 2008 www.biogeosciences-discuss.net/5/1899/2008/ © Author(s) 2008. This work is distributed under the Creative Commons Attribution 3.0 License.
Biogeosciences Discussions
Biogeosciences Discussions is the access reviewed discussion forum of Biogeosciences
Short-term temporal variations of
heterotrophic bacterial abundance and
production in the open NW Mediterranean
Sea
G. M ´evel1,2,3, M. Vernet1,2,3, and J. F. Ghiglione4,5
1
CNRS, UMR 7144, Equipe de Chimie Marine, Station Biologique de Roscoff, 29682 Roscoff, France
2
UPMC, Univ. Paris 06, UMR 7144, Station Biologique de Roscoff, 29682 Roscoff, France
3
UBO, Institut Universitaire Europ ´een de la Mer, 29280 Plouzan ´e, France
4
CNRS, UMR 7621, Laboratoire d’Oc ´eanographie Biologique de Banyuls, Avenue Fontaul ´e, BP44, 66650 Banyuls sur mer, France
5
UPMC, Univ. Paris 06, UMR 7621, Laboratoire ARAGO, Avenue Fontaul ´e, BP 44, 66650 Banyuls sur mer, France
Received: 26 March 2008 – Accepted: 7 April 2008 – Published: 8 May 2008 Correspondence to: G. M ´evel ([email protected])
BGD
5, 1899–1932, 2008 Short-term variation in bacterial abundance and production G. M ´evel et al. Title Page Abstract Introduction Conclusions References Tables Figures ◭ ◮ ◭ ◮ Back CloseFull Screen / Esc
Printer-friendly Version Interactive Discussion Abstract
We present the vertical and temporal dynamics of total vs. particle-attached bacterial abundance and activity over a 5 week period under summer to autumn transition in NW Mediterranean Sea. By comparison to previous investigations in the same area but during different seasons, we found that total bacterial biomass and production
val-5
ues were consistent with the hydrological conditions of the summer-fall transition. At a weekly time scale, total bacterial biomass and production in the euphotic layers was significantly correlated with phytoplanktonic biomass. At an hourly time scale, total bac-terial biomass responded very rapidly to chlorophyll-a fluctuations, suggesting a tight coupling between phytoplankton and bacteria for resource partitioning during
summer-10
autumn transition. In contrast, no influence of diel changes on bacterial parameters was detected. Episodic events such as coastal water intrusions had a significant pos-itive effect on total bacterial abundance and production, whereas we could not detect any influence of short wind events whatever the magnitude. Finally, we show that particle-attached bacteria can represent a large proportion (until 49%) of the total
bac-15
terial activity in the euphotic layer but display rapid and sporadic changes at hourly time scales. This study underlines the value of large datasets covering different temporal scales to clarify the biogeochemical role of bacteria in the cycling of organic matter in open seawater.
1 Introduction
20
Marine bacteria represent the most abundant, biogeochemical important organisms in the oceans. At concentrations ranging between 104–106cells ml−1, one-half of oceanic primary production on average is channelled via bacteria into the microbial loop an es-timated 20–50% of marine primary productivity is channeled through bacterioplankton assemblages (Azam et al., 1983; Cole et al., 1988). In oligotrophic systems,
het-25
BGD
5, 1899–1932, 2008 Short-term variation in bacterial abundance and production G. M ´evel et al. Title Page Abstract Introduction Conclusions References Tables Figures ◭ ◮ ◭ ◮ Back CloseFull Screen / Esc
Printer-friendly Version Interactive Discussion
greater (Robarts et al., 1996; Socal et al., 1999). Microbes consume an estimated 75% of the sinking particulate organic carbon flux in the upper 500 m (Karl et al., 1988; Cho and Azam, 1990). Beyond bulk abundance and activity estimates, the qualitative attributes and activities of the bacterioplankton are crucial to ecosystem function, and an especially key role of the microbial loop is as a major pathway of carbon transfer
5
in marine systems (Azam et al., 1983). The fate of dissolved organic carbon (DOC) pool is mainly determined by the activity of heterotrophic bacteria, which act as a link or sink of DOC for higher trophic levels. The fraction of primary production used by bacteria is highly variable over various time and space scales (Ducklow, 1993). Re-cently, a network of “Microbial Observatories” has been developed in different habitats
10
and across environmental gradients to explore the magnitude and the variation scales of the fluxes driven by microorganisms. However, marine microbial observatories gen-erally rely on coastal areas. Indeed, numerous studies have shown that bacterial abun-dance and activity vary at a seasonal scale in a large number of coastal waters (Shiah and Ducklow, 1994; Pinhassi and Hagstr ¨om, 2000; Gerdts et al., 2004; Pearce et al.,
15
2007; Sapp et al., 2007), but considerably less information is available in open Ocean (Wikner and Hagstr ¨om, 1999; Lem ´ee et al., 2002). Substrate availability and, to a lesser extent, temperature have been to be the main driving forces of bacterial abun-dance and production at a seasonal scale (Wikner and Hagstr ¨om, 1999; Lem ´ee et al., 2002). Short time scale variations of bacterial abundance and production have been
20
explored in more detail in both coastal and open oceans. Examples of significant diel variations of bacterioplankton activity in response to varying photosynthetic rates have been reported from various marine environments (Turley and Lochte, 1986; Herndl and Malacic, 1987; Gasol et al., 1998; Kuipers et al., 2000; Ghiglione et al., 2007). While these studies indicate that phyto- and bacterio-plankton activities can change on
25
the scale of hours, cell abundance and biomass are often more constant, suggesting an efficient recycling mechanism of carbon and nutrients within the microbial food web during such diel cycles. To our knowledge, the effect of episodic events in open oceans, such as salinity changes due to coastal water intrusion or wind events has been poorly
BGD
5, 1899–1932, 2008 Short-term variation in bacterial abundance and production G. M ´evel et al. Title Page Abstract Introduction Conclusions References Tables Figures ◭ ◮ ◭ ◮ Back CloseFull Screen / Esc
Printer-friendly Version Interactive Discussion
investigated. These interactive and successive rapid processes frequently occur during the seasonal transition period. For example, if a storm is sufficiently strong, it may in-duce a vertical mixing by increasing the depth of the surface mixed layer and upwelling NO−3 from the deep reservoir. The nitrate so entrained could stimulate photosynthesis then secondary production in the euphotic zone (Platt et al., 1992; Wu et al., 2007).
5
In this study, we present the vertical and temporal dynamics of heterotrophic bacte-ria under summer-autumn transition at a site located near the DYFAMED station (NW Mediterranean Sea). This site was chosen because (i) it is far enough away from the Ligurian Current to be sufficiently protected from lateral transport, thereby permitting a 1D study and (ii) it is very close to the JGOFS time-series station DYFAMED, which
10
means that long time series data set of biological, biogeochemical and physical param-eters is available. The seasonal variations of the biogeochemical production regimes have been well studied in this area: deep convection occurs during winter leading to a spring bloom; oligotrophic conditions prevail during summer while perturbations in the meteorological forcing generate a secondary bloom in fall (Marty, 2002). However,
15
the variation of heterotrophic bacterioplankton abundance and activity from seasonal to hourly time scales through the water column are still missing. Moreover, because of their significant contribution to the total bacterial activity (Simon et al., 2002), we pay a particular attention to the particle-attached fraction of the bacterioplankton. Our study aims to provide a large set of data on the vertical and temporal dynamics of total
20
vs. particle-attached bacterial abundance and activity within the 0–1000 m depth and during 5 weeks under summer-autumn transition at a site very close to the JGOFS-Dyfamed station in NW Mediterranean Sea. A companion paper (Ghiglione et al., 2008) explored the community composition of the bacterioplankton along the depth gradient.
BGD
5, 1899–1932, 2008 Short-term variation in bacterial abundance and production G. M ´evel et al. Title Page Abstract Introduction Conclusions References Tables Figures ◭ ◮ ◭ ◮ Back CloseFull Screen / Esc
Printer-friendly Version Interactive Discussion
2 Materials and methods
2.1 Study site and samplings
Sampling took part during the cruise DYNAPROC-2 (DYNAmics of the rapid PRO-Cesses in the water column) conducted from 14 September (julian day, JD 258) to 17 October 2004 (JD 291) at an offshore station located near the permanent
DY-5
FAMED station (28 miles offshore, 43◦25 N, 8◦00 E) in the NW Mediterranean Sea on
the RV “Thalassa”. Samples were collected with a rosette system equipped with twelve 24-l Niskin bottles and a conductivity-temperature-fluorescence-depth profiler (CTD –
SeaBird SBE 911 plus). For studies at week-time scales, samples were taken at least
every day at noontime at 6 depths (5, 20, 40, 60, 80, 150 m) from JD261 to JD273 and
10
from JD277 to JD289. For studies at hourly time-scales, samples were taken every 6 h at the same depths from JD268 to JD273 and from JD284 to JD289. In addition, sur-face to 1000 m depth profiles (5, 20, 40, 60, 80, 150, 200, 400, 500, 750, 1000 m) were performed at day and night several times during the cruise (18–19 and 26 September = JD262–263 and JD270 and 5–6 and 12 October = JD279–280 and JD286). In situ
15
fluorescence was converted to chlorophyll-a (Chl-a) using a regression between in situ fluorescence and measurements of the water column a concentrations (mg
Chl-am−3) from selected depths (Chl-a=2.0740×Fluo (R=+0.970, p<0.01, n=453) from
JD 261–273 and Chl-a=1.7807×Fluo (R=+0.960, p<0.01, n=466) (Andersen et al., 20081). Chl-a concentrations were converted into carbon equivalents by applying the
20
average conversion factors 32.5 for the upper mixed layer, 18.5 for the upper part of deep chlorophyll maximum (DCM) and 12.7 below (Van Wambeke et al., 2002).
1
Andersen, V., Prieur, L., and Goutx, M.: Hydrology, biology and biogeochemistry during autumn transition period (Sept. 14–0ct. 17), at a central point in the Ligurian sea, NW Mediter-ranean: overview of the DYNAPROC2 (DYNAmics of the rapid PROCesses) study, Biogeo-sciences Discuss., to be submitted, 2008.
BGD
5, 1899–1932, 2008 Short-term variation in bacterial abundance and production G. M ´evel et al. Title Page Abstract Introduction Conclusions References Tables Figures ◭ ◮ ◭ ◮ Back CloseFull Screen / Esc
Printer-friendly Version Interactive Discussion
2.2 Bacterial abundance and biomass
1.5 ml sub-samples for total bacteria counts were put in a cryo-vial, fixed for at least 20 min at room temperature with 1% (v/v) glutaraldehyde (final concentration), frozen in liquid nitrogen and later stored at −80◦C freezer for delayed analysis ashore. Bacteria
cells were enumerated using SYBR Green staining and flow cytometry according to
5
the method described by Marie et al. (1997). Briefly, glutaraldehyde-fixed sub-samples were thawed and incubated with SYBR Green (Molecular Probes, Eugene, OR, USA) at a final concentration of 10−4(v/v) for 15 min at room temperature in the dark.
Analy-ses were performed with a FAC Sort flow cytometer (Becton Dickinson, San Jose, CA, USA) equipped with an air-cooled argon laser (488 nm, 15 mW). Samples were run at
10
low speed (approx. 20 µl min−1) and data were acquired in log mode until around 10
000 events had been recorded. We added 10 µl per samples of a 106ml−1solution of yellow-green fluorescent micro spheres (0.95 µm diameter beads – Polysciences Inc., Warrington, Pa) as an internal standard.
Total bacteria were detected by their signature in a cytogram of side scatter (SSC)
15
versus green fluorescence (FL1). In the same cytograms, two main bacterioplank-ton groups can be discriminated: HNA bacteria with high nucleic acid content (high FL1 value) and LNA bacteria with low nucleic content (low FL1 value). The SSC/FL1 cytogram for each sample was individually inspected, and HNA and LNA regions man-ually moved to conform to the appropriate areas of the bacterial dot-plot. Cytometric
20
noise was discarded both by setting a threshold on FL1 and by manually separating noise from cells in the FL1 versus FL3 plot (Gasol et al., 1999). Data acquisition was performed with the Cell Quest system (Becton Dickinson) and data analysis with a custom-designed software CYTOWIN version 4.3 (Vaulot, 1989). HNA bacteria abun-dance was expressed as the percentage of total bacteria population.
25
Bacteria attached to particles were enumerated in the >0.8 µm size fraction. Imme-diately after collection, 5 ml samples were filtered onto 0.8 µm pore-size polycarbonate membranes (Isopore Filters, Millipore). Then, filters were put in 5 ml glutaraldehyde
BGD
5, 1899–1932, 2008 Short-term variation in bacterial abundance and production G. M ´evel et al. Title Page Abstract Introduction Conclusions References Tables Figures ◭ ◮ ◭ ◮ Back CloseFull Screen / Esc
Printer-friendly Version Interactive Discussion
(2% final concentration) and conserved as described above. In return to lab, the thawed filters were sonicated (306 µm amplitude, 50% duty cycle, 2 min, Cooling in water bath) with a Sonifier 250 (Branson Ultrasonics Corp., Danburry, CO, USA) to disperse bacteria from the particles (Velji and Albright, 1993). Then, bacteria con-tained in the >0.8 µm size fractions (attached bacteria) were enumerated using SYBR
5
Green staining and flow cytometry as described above. Attached bacteria abundance was expressed as the percentage of the total bacteria population. Four deep profiles (11 levels between 0–1000 m) were studied using both epifluorescence microscopic method (Hobbie et al., 1977) and flow cytometry. The microscopic observations have shown a good dispersion of bacteria and tolerance to sonication process. In addition,
10
counts by both methods showed similar results and were closely correlated (R=+0.68,
p<0.01, n=44) that confirmed the validity of using sonication before flow cytometric enumerations as shown previously (Riemann and Winding, 2001; Worm et al., 2001).
Bacterial biomass (BB) was calculated by using a carbon content per cell of 15 fg C cell−1(Fuduka et al., 1998; Caron et al., 1999).
15
2.3 Bacterial production
Bacterial heterotrophic production (BP) was estimated from 3H-leucine (Amersham, 161 Ci mmol−1) incorporation rates into bacterial proteins as described by Kirchman et
al. (1985). The centrifugation method (Smith and Azam, 1992) was used routinely to estimate total bacterial production (TBP) in all profiles (0–150 and 0–1000 m) whereas
20
the classical filtration method (Kirchman, 1993) was used to estimate bacterial produc-tion of particle-attached bacteria (ABP). For TBP, 1.5 ml samples were dispersed into four 2 ml screw cap micro-centrifuge tubes. A mixture of3H-leucine and non-radioactive leucine was added to final concentrations of 16 and 4 nM, respectively. These concen-trations were experimentally determined to be a saturation concentration in all depths.
25
One of the replicates had already received trichloroacetic acid (TCA) to give a 5% final concentration and acted as the dead control. Samples were incubated in the dark at the in situ temperature for 2 to 8 h, depending on sampling depth. Previous experiments
BGD
5, 1899–1932, 2008 Short-term variation in bacterial abundance and production G. M ´evel et al. Title Page Abstract Introduction Conclusions References Tables Figures ◭ ◮ ◭ ◮ Back CloseFull Screen / Esc
Printer-friendly Version Interactive Discussion
had shown leucine incorporation to be linear over these time periods (data not shown). Incubations were stopped by the addition of 50% TCA (5% final concentration). The samples were centrifuged at 16.000 g for 10 min. The supernatant was discarded and 1.5 ml of 50% TCA was added. The samples were shaken vigorously using a vortex mixer and centrifuged again. The supernatant was discarded and 1.5 ml of scintillation
5
cocktail (NBCS 104, Amersham) was added.
In the filtration method, three replicates (10 to 30 ml according to sampling depth) and one control pre-killed with formalin (2% final concentration), received 20 nM leucine mix (2 nM 3H-leucine and 18 nM cold leucine). Samples were incubated like in the centrifugation method and the incubations were stopped using formalin (2% final
con-10
centration). The samples were filtered through 0.2 µm cellulose ester filters (Millipore, type GS) and were extracted with 5% TCA for 10 min followed by three 3 ml rinses with 5% TCA. Filters were then placed in scintillation vials and dissolved with 0.5 ml ethyl acetate prior to the addition of 5 ml of NBCS 104 Amersham scintillation cocktail. Because TCA passed through 0.8 µm pore-size filters during the protein extraction, a
15
direct estimation of Bacterial Production by attached bacteria (ABP) was not possi-ble. Consequently, two samples sets were incubated for each measurement: a first set was treated as above for estimation of total BP and an additional set was filtered through 0.8 µm after incubation and stop with formalin. The proteins extracted from the
<0.8 µm fraction permitted to estimate the free-living bacterial production. The ABP
20
was calculated as the difference between TBP and BP by free-living bacteria.
Radioactivity of all micro-centrifuge tubes and 0.2 µm filters were counted on a tri-CARB 1500 Packard liquid scintillation counter. Quenching was corrected by internal standard and control counts were subtracted. The mean coefficient of variation of the triplicate measurements was 8.7 and 12.5% for centrifugation and filtration method,
25
respectively. Rates of bacterial production (BP) were calculated from leucine incorpo-ration rates using a conversion factor of 1.5 kg C mol−1 leucine (Kirchman, 1993) and
were expressed as ng C l−1h−1. The per-cell specific activity was calculated from the BP/BA ratio and expressed as fg C cell−1day−1.
BGD
5, 1899–1932, 2008 Short-term variation in bacterial abundance and production G. M ´evel et al. Title Page Abstract Introduction Conclusions References Tables Figures ◭ ◮ ◭ ◮ Back CloseFull Screen / Esc
Printer-friendly Version Interactive Discussion
2.4 Statistical analyses
Statistical analyses were performed with STATISTICA software. With the exception of the percentages of HNA and attached bacteria, all variables were log-transformed in order to attain normality and homogeneity of variables. The relationships between variables were explored by use of Pearson’s correlation coefficient. A long-term trend
5
was determined by linear regression of parameters with time and a F-test on slopes was performed. Student’s t-test was used to assess significant differences between paired means. The whole integrated values were calculated according to the classical trapezoidal method. All data were reported as means ± SD.
3 Results
10
3.1 Environmental conditions
The main hydro-biological characteristics of the studied site during the Dynaproc-2 cruise (14 September – JD258 to 17 October 2004 – JD291) are presented by An-dersen et al. (2008)1. Briefly, this seasonal transition period was marked by a strong water column stratification partially disrupted at the end of the cruise and low nutrients
15
stocks. The apparent stability of the hydro-biological structure of the water column prevailing during the five week sampling period was disturbed by various episodic me-teorological events. The most outstanding events were the intrusion of low salinity wa-ter masses (LSW) (<38.2‰) occurring below the thermocline (between 40 and 80 m) during 10 days from JD264 and for 5 days from JD282. The increase of LSW
percent-20
age in the 20-70 m water column is depicted by the index of low salinity water (see
http://www.obs-vlfr.fr/proof/vt/op/ec/peche/pec.htm). Three strong wind events (speed
>20 nds) took place for 12, 24 and 60 h on JD269, JD284 and JD286, respectively. The two last wind events induced a strong decrease of air temperature, a beginning of de-stratification and the mixed layer deepened (Andersen et al., 20081). At the
BGD
5, 1899–1932, 2008 Short-term variation in bacterial abundance and production G. M ´evel et al. Title Page Abstract Introduction Conclusions References Tables Figures ◭ ◮ ◭ ◮ Back CloseFull Screen / Esc
Printer-friendly Version Interactive Discussion
ning of the cruise, two deep-chlorophyll maxima (DCM, 50–60 m and 90 m depth) were detected, resulting in a phytoplankton biomass exceptionally high for the time period (Chl-a concentration of 35–40 mg m−2). After JD263, only one DCM was observed at 40–50 m depth with Chl-a concentration of 20–25 mg m−2(Marty et al., 20082).
3.2 Temporal variation scales of bacterial abundance and production within 0–150 m
5
depths
3.2.1 Seasonal values of total bacterial abundance and production
The results we obtained during the September–October 2004 sampling period were compared to those obtained for two previous cruises conducted at the same site in March and June 2003 (Table 1). In spring condition (March 2003), total
bacte-10
rial biomass (TBB) was 5.9 and 3.8 time more important, total bacterial production (TBP) was 2.6 and 1.8 time more important and total specific activity (TSA) was 2.6 and 1.8 time less important than in summer (June 2003) and summer-autumn (September–October 2004) conditions, respectively. Then, September–October 2004 bacterial parameter values were much closer to the oligotrophic summer 2003 than the
15
mesotrophic spring 2003 conditions.
3.2.2 Weekly variation of total bacterial abundance and production
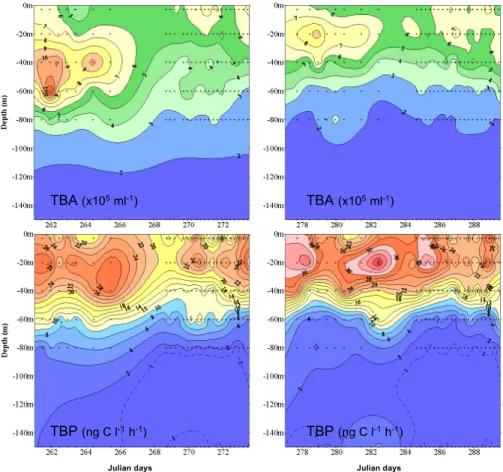
Over the entire five week period, total bacterial abundance (TBA) generally increased from surface to the DCM and decreased below (Fig. 1). TBA ranged from a min-imum of 6.4×10⁵cells ml−1 in subsurface to a maximum of 14.8×10⁵cells ml−1 at
20
the DCM and decreasing to a minimum of 2.1×10⁵cells ml−1 at 150 m (mean =
6.1±2.4×10⁵cells ml−1, n=324). We found a good correlation between TBA and Chl-2
Marty, J. C., Garcia, N., and Raimbault, P.: Phytoplankton dynamics and primary production under late summer conditions (DYNAPROC II cruise Sep./Oct. 2004, NW Mediterranean Sea), Deep-Sea Res. I, in revision, 2008.
BGD
5, 1899–1932, 2008 Short-term variation in bacterial abundance and production G. M ´evel et al. Title Page Abstract Introduction Conclusions References Tables Figures ◭ ◮ ◭ ◮ Back CloseFull Screen / Esc
Printer-friendly Version Interactive Discussion a integrated concentration in the first 150 m depth (R=+0.44, p<0.05, n=54). Total
bacterial production (TBP) generally increased from surface to 20 m and decreased below, ranging from a minimum of 10.6 ng C l−1h−1 in the subsurface to a maximum
of 38.6 ng C l−1h−1 at 20 m and decreasing to a minimum of 0.3 ng C l−1h−1 at 150 m depth (mean = 15.01±10.16 ng C l−1h−1, n=324) (Fig. 1). TBP variability with depth
5
and time was higher compared to TBA (CV=68 and 40%, respectively, n=324) and these two parameters were strongly linked during the entire sampling period (r=+0.59,
p<0.01, n=324).
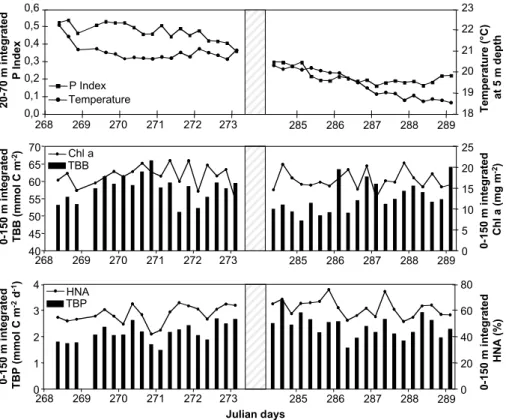
Integrated total bacterial biomass (TBB) and production (TBP), as well as the rel-ative contribution of cells with high nucleic acid content (HNA expressed in % of
10
TBA) and total bacterial biomass to autotrophic biomass ratio (TBB/AB) were calcu-lated on for the euphotic layer (0–150 m) (Fig. 2). Integrated TBB values showed a slight decrease from 95.9 to 72 mmol C m−2 from JD261 to JD265 and remained al-most stable during the rest of the sampling period (mean = 57.17±5.04 mmol C m−2, n=47). Integrated TBP values ranged from 1.49 to 3.37 mmol C m−2day−1 (mean =
15
2.40±0.46 mmol C m−2day−1, n=54). The relative contribution of HNA bacteria to TBA was rather stable during the 5 weeks sampling period (from 44 to 59%, mean = 49±3%,
n=54) as well as the ratio TBB/AB (from 1.45 to 2.87, mean=2.00±0.29, n=54). By
us-ing linear regression, we did not find any significant influence of time on these 0–150 m depth integrated parameters through the 5 week sampling period (p>0.05, variance
20
analysis F-test).
3.2.3 Diel variation scale of total bacterial abundance and production
In order to evaluate the influence of diel and episodic meteorological events (strong wind or intrusion of low salinity water masses), short time changes of the TBB and TBP were investigated. Samples were taken in the euphotic layer by sampling every
25
6 h during 120 h in two periods (JD268–273 and JD284–289) and at 6 depths lev-els from surface to 150 m depth. 20–70 m depth integrated P Index (proxy of salinity anomalies) values indicated that the first coastal water intrusion that appeared from
BGD
5, 1899–1932, 2008 Short-term variation in bacterial abundance and production G. M ´evel et al. Title Page Abstract Introduction Conclusions References Tables Figures ◭ ◮ ◭ ◮ Back CloseFull Screen / Esc
Printer-friendly Version Interactive Discussion
JD264 to JD273 was more important than the second (from JD282 to JD286) (Fig. 3). The temperature of the surface water (5 m) remained relatively stable during the first study period (JD268–273) except for the first days and decreased with time during the second period (JD284–289) in accordance to the strong wind period occurring in the middle of this sampling period.
5
During the two periods, 0–150 m integrated parameters (TBB0−150 m, TBP0−150 m, Chl-a0−150 mand HNA0−150 m%) showed strong variations on short-time scales (Fig. 3). No clear diel periodicity of these parameters could be detected. Interestingly,
TBB0−150 m variations during the two 120 h periods presented the same pattern that
Chl-a0−150 m variations (R=+0.48, p<0.05, n=19 for the first period and R=+0.39,
10
p<0.05, n=20 for the second period) (Fig. 3). In addition, TBP0−150 m variations were significantly correlated with the relative abundance of the high nucleic acid content bacteria (HNA%) (R=+0.71, p<0.01, n=19 and R=+0.47, p<0.05, n=20, for the first (JD268–273) and second (JD284–289) study period, respectively) and these relation-ships were better than TBP/TBB (R=+0.36, p<0.05, n=19 and R=+0.23, p<0.05,
15
n=20 for the two periods respectively). Finally, significant negative correlations were
found between the P index (proxy of salinity anomalies) and both 0–150 m depth inte-grated TBA and TBP. These relationships were stronger during the first water intrusion from JD264 to JD273 (R=−0.85, p<0.01 and R=−0.47, p<0.05, n=19 for TBA and TBP, respectively) compared to the second from JD282 to JD 286 (R=−0.36, p<0.05,
20
n=20 only for TBA) when the low salinity water mass was lower, as shown by the index P values (Fig. 3).
BGD
5, 1899–1932, 2008 Short-term variation in bacterial abundance and production G. M ´evel et al. Title Page Abstract Introduction Conclusions References Tables Figures ◭ ◮ ◭ ◮ Back CloseFull Screen / Esc
Printer-friendly Version Interactive Discussion
3.3 Temporal variation scales of total vs. particle-attached bacterial abundance and production
3.3.1 Weekly to diel variation scales of total vs. particle-attached bacterial abundance and production in the 0–1000 m water column
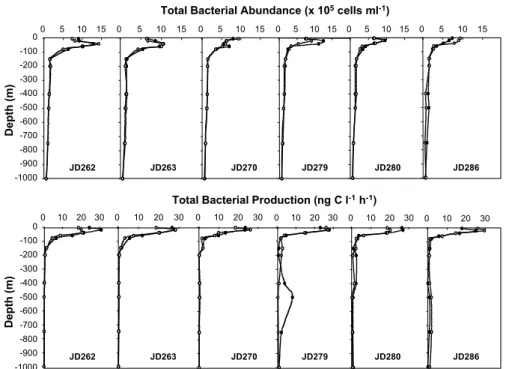
Twelve 0–1000 m depth profiles were done every day and night by sampling at 11
5
depth levels to follow weekly to diel changes in the vertical distribution of the total and particle-attached bacterial abundance and production in the water column (Figs. 4 and 5). TBA exhibited a pronounced vertical gradient with maxima at 40 m depth at the beginning of the sampling period moving up to 5 m at the end of the sampling period with concentration values of 14.4 to 7.4×10⁵cells ml−1, respectively (Fig. 4). TBA
de-10
creased drastically in the mesopelagic layers (150–1000 m) with lowest values at the 1000 m depth, ranging from 0.5 to 0.7×10⁵cells ml−1. No significant difference was
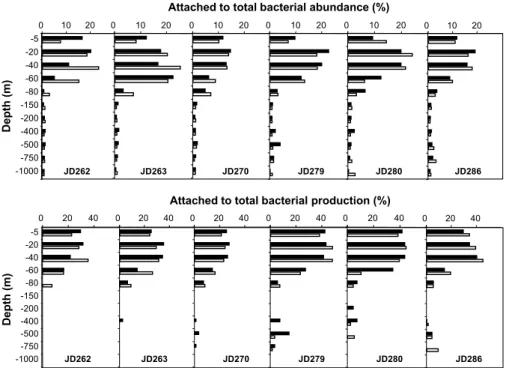
ob-served between noontime and midnight. The abundance of particle-attached bacteria followed a similar pattern with a strong vertical gradient and t-test showed no significant changes between day and night (Fig. 5). The main contribution of the attached
bac-15
teria to the TBA was observed in the euphotic layers (0–150 m), with maximal values ranging from 14 and 25% of the TBA at the DCM, whereas their contribution was very low in the mesopelagic layer (less than 4% of the TBA).
TBP exhibited also a pronounced vertical gradient with maximum values established at 20 m during the whole cruise, ranging from 20.3 and 30.9 ng C l−1h−1, and minima at
20
1000 m depth, ranging from 0.03 to 0.08 ng C l−1h−1(Fig. 4). One exception was found
on JD279, when a relatively high TBP (8.10 ng C l−1h−1) was observed at 500 m during
the night. Other deep production peaks occurred in the 400–500 m layer during the second part of the sampling period but they do not appear on the graphs because of the low x-scale. The contribution of the particle-attached fraction on the TBP varied also
25
drastically with depth, with no significant changes between day and night. The particle-attached bacterial production followed a similar trend with a strong vertical gradient and no significant changes between day and night during the 5 weeks sampling period
BGD
5, 1899–1932, 2008 Short-term variation in bacterial abundance and production G. M ´evel et al. Title Page Abstract Introduction Conclusions References Tables Figures ◭ ◮ ◭ ◮ Back CloseFull Screen / Esc
Printer-friendly Version Interactive Discussion
as showed by t-test (Fig. 5). The maximal contribution of the attached fraction reached values up to 49% of TBP, and generally situated between 20–40 m (DCM layer). In the mesopelagic waters, the contribution of attached bacteria to the TBP was generally negligible (<2%), with some exceptions found between 400 and 750 m depths (from 8 to 15% of TBP).
5
3.3.2 Hourly of total vs. particle-attached bacterial abundance and production at the subsurface
The influence of episodic meteorological events (strong wind or intrusion of low salinity water) on total vs. particle-attached bacterial abundance, production and specific activ-ity was investigated by sampling every 6 h during 120 h in two periods (JD268–273 and
10
JD284–289) (Fig. 6). For all of these parameters, both total vs. attached bacteria ex-hibited sporadic temporal variations with neither diel pattern nor any clear relation with the salinity or temperature events (Fig. 6). The contribution of the attached fraction rep-resented from 7 to 17% of the TBA (mean = 11±3%) in the first period (JD268–273), while the dynamic of the attached fraction varied inversely to TBA (R=−0.47, p<0.05,
15
n=19). In the second period (JD284–289), the contribution of the attached fraction
exhibited the same pattern than TBA and varied from 11 to 21% (mean = 15.8±2.8%) of TBA.
The contribution of the attached fraction to the TBP fluctuated from 25 to 55% (mean = 34.7±9.8%) and from 18 to 63% (mean = 37.7±13.2%) during the first and second
20
periods, respectively. Particle-attached bacteria were around 3 times more active than the free-living bacteria whereas they represented less than 21% of the total bacteria abundance.
The ratio between bacterial production and bacterial abundance, namely specific activities (SA) was generally more important for the attached
frac-25
tion compared to the total fraction. SA averaged from 1.82±0.93 and 2.03±1.01 fg C cell−1day−1 for the attached fraction, while total SA averaged from
BGD
5, 1899–1932, 2008 Short-term variation in bacterial abundance and production G. M ´evel et al. Title Page Abstract Introduction Conclusions References Tables Figures ◭ ◮ ◭ ◮ Back CloseFull Screen / Esc
Printer-friendly Version Interactive Discussion
As well as for bacterial production, total and particle-attached bacterial SA exhibited similar pattern with time, with higher BP and SA one the second period.
4 Discussion
4.1 Seasonal to hourly variation in bacterial abundance and production in the 0– 150 m depth layer
5
One of the main contributions of our study is provision of a complete time series data set on heterotrophic bacterial abundance and production at seasonal to hourly scales at a central point in the Ligurian Sea close to the French JGOFS-DYFAMED station. To the best of our knowledge this is the first time that such a complex dataset is analyzed to unravel the temporal scales of variations in bacterioplankton abundance and activity
10
in the NW Mediterranean Sea.
To evaluate the dynamics of total heterotrophic bacterial abundance and activity at a seasonal scale, data from this study (summer-autumn transition) were compared with previous data from two cruises leaded at the same site but one year before and under spring bloom and summer stratification conditions (Lem ´ee et al., 2002; Ghiglione et al.,
15
2007) (Table 1). As expected, total bacterial biomass and production values obtained in this study present slightly higher values than under summer oligotrophic condition but drastically lower values than under spring bloom conditions. This observation is in good agreement with the summer to autumn transition period characterizing the sampling period of the present study and with the strong seasonal variability of hydrological
20
structures prevailing in this area (Andersen and Prieur, 2000; Vidussi et al., 2000). During the 5 week sampling period, total heterotrophic bacterial abundance and ac-tivity showed large fluctuation in the euphotic layer, and especially in relation to the deep chlorophyll maxima depths (Fig. 1). For example at 60 m depth, TBA varied from 14.8×10⁵cells ml−1to 2.5×10⁵cells ml−1 in relation to drastic changes in the
Chl-25
BGD
5, 1899–1932, 2008 Short-term variation in bacterial abundance and production G. M ´evel et al. Title Page Abstract Introduction Conclusions References Tables Figures ◭ ◮ ◭ ◮ Back CloseFull Screen / Esc
Printer-friendly Version Interactive Discussion
Previous investigations have shown that when bacterial biomass is limited solely by phytoplankton nutrients, a strong correlation is observed between bacterial biomass and phytoplankton biomass (Cole et al., 1988) and between bacterial abundance and production (Billen et al., 1990). In our study, heterotrophic bacterial biomass was calculated by applying a bacterial abundance to carbon conversion value generally
5
used in oligotrophic ecosystems (Caron et al., 1999), and conversion factors taking into account photoacclimatation were used to evaluate the autotrophic biomass (Van Wambeke et al., 2002). Integrated 0–150 m depth values of bacterial biomass to au-totrophic biomass ratios remained relatively constant and always >1 (Fig. 2). Such domination of bacterial biomass relative to autotrophic biomass is in accordance with
10
other results in open Ocean (Ducklow and Carlson, 1992). These authors suggested that such situation occurs when phytoplankton biomass is low (Chl-a<1 mg m−3) and
when bacteria are sustained by phytodetritus or by-products from grazing. In our study, we found a significant correlation between 0–150 m integrated bacterial biomass and Chl-a concentration (R=+0.44 p<0.05, n=54). In addition, bacterial abundance and
15
bacterial production measured into the six upper layers, were also strongly linked dur-ing the entire sampldur-ing period (R=+0.59, p<0.01, n=324). These results suggest that bacterial biomass and production were regulated by nutrient releases by primary pro-ducers. In addition, our regression slopes <1 suggests that bacterial responses to resource availability tend to be attenuated by predation or viral pressure (Ducklow and
20
Carlson, 1992; Dufour and Torreton 1996; Christaki et al., 2004). Thus, in our con-ditions both bottom-up and top-down processes were controlling bacterial populations inhabiting the euphotic layer. Further studies are needed to determine the relative importance of bottom-up and top-down control in such conditions.
Investigations at hour time scales allowed us to enlighten the influence of diel and
25
episodic events (coastal water intrusions and wind events) on total bacterial abun-dance and production (Fig. 3). By sampling every 6 h during 5 days within two periods at 9 days intervals, we did not found any diel periodicity on the 0–150 m integrated total bacterial abundance and production. We did not expect such result since diel
BGD
5, 1899–1932, 2008 Short-term variation in bacterial abundance and production G. M ´evel et al. Title Page Abstract Introduction Conclusions References Tables Figures ◭ ◮ ◭ ◮ Back CloseFull Screen / Esc
Printer-friendly Version Interactive Discussion
changes of bacterial production were observed in several open ocean, including the NW Mediterranean Sea (Gasol et al., 1998; Kuipers et al., 2000; Winter et al., 2004). At the studied station, diel changes in bacterial production was also observed during spring phytoplanktonic bloom (Ghiglione et al., 2007), but not during spring to summer transition (Van Wambeke et al., 2001). Such discrepancy can result from seasonal
5
factors or meteorological conditions (rain, cloudy days, wind) that could superimpose their effects on diel variability and consequently, probably prevent us from obtaining re-producible diel patterns (Coffin et al., 1993). This is probably the case in our study, as shown by the influence of episodic events on the bacterial compartment during sum-mer to autumn transition conditions. First, desalted water intrusions occurred twice
10
during our sampling period as described by the P index, a proxy of salinity anomalies (Andersen et al., 20081). We found a significant negative relationship between the 0– 150 m integrated total bacterial abundance and production and the P index (Fig. 3). These relationships were stronger during the first water intrusion compared to the sec-ond when the desalted water mass was lower, suggesting a proportional impact of
15
salinity anomalies on total bacterial abundance and activity together with the magni-tude of the low salinity water masses intrusion. The effect of wind events on total bacterial abundance and production was not detectable in our conditions. We did not found any significant correlation between total bacterial abundance and production nei-ther following low magnitude (<10 nds) or stronger (>20 nds) wind events. During the
20
second period of our hour scale sampling (JD284–289), the strong wind created an important decrease of temperature and the upper-mixed layer moved down from 20 to 40 m depth (see Andersen et al., 20081). Several authors suggested that such wind events could result in changes in total bacterial abundance and production, as a result of an increase of NO−3 availability, biomasses and particle fluxes in the euphotic layer
25
(Haury et al., 1990; Marra et al., 1990; Kiorboe, 1993). Because of cruise logistics, the hour scale sampling was stopped three days after the stronger wind event, when the euphotic layer de-stratification begins. Thus, even if we did not found any influence of low magnitude wind events (<10 nds) on total bacterial abundance and production,
BGD
5, 1899–1932, 2008 Short-term variation in bacterial abundance and production G. M ´evel et al. Title Page Abstract Introduction Conclusions References Tables Figures ◭ ◮ ◭ ◮ Back CloseFull Screen / Esc
Printer-friendly Version Interactive Discussion
our results suggest also that the response of the bacterial compartment may take more than three days to react to stronger wind events (>20 nds).
4.2 Temporal evolution of high nucleic acid content cells in the euphotic layer
In aquatic systems, it is possible to distinguish populations with high (HNA cells) and low nucleic acid content (LNA cells) by flow cytometry. In our study, the percentage
5
of HNA cells to the total bacterial count (% HNA) varied from 44% to 59% (average = 49±3%, n=324) and remained stable within the whole euphotic layer (Fig. 3). These values are in accordance with previous results found in various oceans (Sherr et al., 2006; Zubkov et al., 2006) and in the NW Mediterranean (Scharek and Latasa, 2007). The relative contribution of HNA bacteria to total abundance slightly fluctuated during
10
our sampling period (CV=14%) but neither temporal trend nor depth significant pattern was observed. In our large set of samples (n=324), we found a significant and positive correlation between the percentage of HNA in the total bacterial population and the total bacterial production (R=+0.75, p<0.01) and a strongest relationship was observed between total bacterial abundance and production (R=+0.59, p<0,01). HNA cells are
15
generally considered to represent active members of the bacterial community, whereas LNA may be dead or dying cells (Gasol et al., 1999; Lebaron et al., 2002; Servais et al., 2003). However, more recent studies question the use of HNA cell abundance as a proxy for activity in natural systems (Longnecker et al., 2005, 2006; Sherr et al., 2006; Bouvier et al., 2007; Moran et al., 2007). Such discrepancies could be explained by the
20
variability in the cytometric characteristics of HNA/LNA linked to different ecosystems (Bouvier et al., 2007). In our study the dichotomous view of HNA and LNA appears reasonable as all observations were made at the same location. As the HNA cells, were strongly correlated with total bacterial production, they can be considered as the active members of the bacterial community in our study site.
BGD
5, 1899–1932, 2008 Short-term variation in bacterial abundance and production G. M ´evel et al. Title Page Abstract Introduction Conclusions References Tables Figures ◭ ◮ ◭ ◮ Back CloseFull Screen / Esc
Printer-friendly Version Interactive Discussion
4.3 Dynamics of total bacterial abundance and production in the mesopelagic layer (150–1000)
As already reported, we found that total bacterial abundance and production linearly decreased with depth in the mesopelagic layer (Turley and Stutt, 2000; Tanaka and Rassoulzadegan, 2004). Organization of bacterial diversity with depth was also
ob-5
served by Ghiglione et al. (2008) during this cruise. Compared to previous studies at the same JGOFS-Dyfamed station, total bacterial abundance and production val-ues measured during the sampling period (0.53 to 1.83×10⁵cells ml−1 and 0.07 to
8.10 ng C l−1h−1 for total bacterial abundance and production, respectively; Fig. 4) are comparable to the previous studies driven in the mesopelagic layers of the NW
10
Mediterranean Sea (Turley and Stutt, 2000; Harris et al., 2001; Tamburini et al., 2002; Tanaka and Rassoulzadegan, 2004). The magnitude of depth-dependent decrease of total bacterial abundance calculated in our study (the slope of log-log linear regres-sion) is slightly smaller (mean slope = −0.50±0.07, n=12) compared to those pre-viously described in the same water layer (0–1000 m) and similar site (mean slope
15
= −0.66±0.13, n=10 in Tanaka and Rassoulzadegan, 2004). The mean magnitude of depth-dependent decrease of BP (mean slope = −0.73±0.49, n=12) found in our study is clearly lower that values already obtained by the same authors (−1.15±0.30,
n=5), probably because of greater variations of the depth-dependent decrease in bac-terial production observed in our study (CV=+68%) and also because of episodic deep
20
peaks of production found between 400 to 750 m depth. Interestingly, such episodic deep peaks of bacterial production were already reported in the NW Mediterranean (Misic and Fabiano, 2006). Given the mean SD of triplicate BP measurements (12.5%) these deep peaks show a real bacterial production. They suggest a rapid adaptation of bacteria to the episodic occurrence of organic matter probably originated from
zoo-25
BGD
5, 1899–1932, 2008 Short-term variation in bacterial abundance and production G. M ´evel et al. Title Page Abstract Introduction Conclusions References Tables Figures ◭ ◮ ◭ ◮ Back CloseFull Screen / Esc
Printer-friendly Version Interactive Discussion
4.4 Temporal trends in total vs. particle-attached bacterial abundance and production in the 0–1000 m water column
We defined the terms “free-living” and “particle-attached” bacteria on the basis of a 0.8-µm-pore-size filter fractionation. This barrier is mainly operational and should in-clude most microscopic and macroscopic aggregates (Simon et al., 2002). A similar
5
cut-off was used by several authors (Hollibaugh et al., 2000; Ghiglione et al., 2007) but some authors used also GF/C filters with a nominal pore size of 1.2 µm (Gasol and Mor ´an, 1999; Marty et al., 2002). The contribution of attached bacteria to total bacte-rial abundance varied from 5 to 25% (average = 15±5%, n=48) in the first 60 m depth and remained in the same range during the 5 weeks studied period (Fig. 5). These
val-10
ues are consistent with previous reports on various pelagic environments (see review by Simon et al., 2002). We found a significant correlation between attached to total bacterial abundance ratio and Chl-a concentration in the first 150m depth (R=+0.54,
p<0.05, n=72), suggesting a tight coupling between the vertical distribution of the at-tached bacteria and phytoplankton biomass. However, no significant relation was found
15
between the contribution of attached bacterial abundance and diel or episodic events (Fig. 6). In the water column, the contribution of the attached fraction to total bacterial abundance decreased rapidly in the mesopelagic layer (<4%), as already described in other studies (see review by Simon et al., 2002).
The contribution of the attached fraction to the total bacterial production varied from
20
11 to 49% of the total bacterial production in the first 60 m depth with higher values at the end of the sampling period (Fig. 5). These results are in between the highest and lowest values reported in spring and summer 2003 (80% and 5%, respectively) at the same station (Ghiglione et al., 2007), but lower values (<30%) are usually reported in marine systems (see review by Simon et al., 2002). Such discrepancy could be due
25
to differences in the studied systems (mainly in the size, nature and concentration of particles) or in protocols used to separate attached bacteria from free-living cells. In mesopelagic waters, the contribution of the attached fraction to the total bacterial
pro-BGD
5, 1899–1932, 2008 Short-term variation in bacterial abundance and production G. M ´evel et al. Title Page Abstract Introduction Conclusions References Tables Figures ◭ ◮ ◭ ◮ Back CloseFull Screen / Esc
Printer-friendly Version Interactive Discussion
duction was generally low (less than 2%), except in some occasion (maximum of 18% at 500 m depth), but without any relation to exceptional increase of total bacterial pro-duction described above. At a shorter time scale, the contribution of attached fraction to the total bacterial production varied rapidly and significantly (from 18 to 63% within a few days) when samples were taken every 6 hours. We did not find any significant
5
relation between the contribution of attached fraction to the total bacterial production or the attached bacterial specific activity and diel or episodic events (Fig. 6). These results suggest that such indirect parameters were not sufficient to explain the rapid and chaotic variation of the total vs. attached bacterial production at hour time scale. These results reinforce the biogeochemical role of attached bacteria in the cycling of
10
organic matter and reveal rapid and sporadic changes in their activity at hour time scale that influence drastically the total bacterial production in the NW Mediterranean Sea.
Acknowledgements. This work was supported by PROOF-PECHE grant (Production and
Ex-portation of Carbon: control by HEterotrophic organisms at small time scales). We are grateful to our cruise and project leader V. Andersen. We thank the captains and crews of the RV
15
Thalassa for ship operations. We thank also the scientists who provided data for this paper, particularly L. Prieur for hydrobiological data, the microbiologist team enlisted in the program and J. Noirbenne and V. Tosser, students in our lab for their technical contribution. We are grateful to John Dolan, Madeleine Goutx and France Van Wambeke for helpful comments on the manuscript.
20
References
Andersen, V. and Prieur, L.: One-month study in the open NW Mediterranean Sea (DYNAPROC experiment, May 1995): overview of the hydrobiological structures and effects of wind events, Deep-Sea Res. I, 47, 397–422, 2000.
Azam, F., Fenchel, T., Field, J. G., Gray, J. S., Meyer-Reil, L. A., and Thingstad, F.: The
ecolog-25
ical role of water-column microbes in the sea, Mar. Ecol. Prog. Ser., 10, 257–263, 1983. Bouvier, T., del Giorgio, P. A., and Gasol, J. M.: A comparative study of the cytometric
character-BGD
5, 1899–1932, 2008 Short-term variation in bacterial abundance and production G. M ´evel et al. Title Page Abstract Introduction Conclusions References Tables Figures ◭ ◮ ◭ ◮ Back CloseFull Screen / Esc
Printer-friendly Version Interactive Discussion istics of high and low nucleic-acid bacterioplankton cells from different aquatic ecosystems,
Environ. Microbiol., 9, 2050–2066, 2007.
Caron, D. A., Peele, E. R., Lim, E. R., and Dennett, M. R.: Picoplankton and nanoplankton and their trophic coupling in surface waters of the Sargasso Sea South of Bermuda, Limnol. Oceanogr., 44, 259–272, 1999.
5
Cho, B. C. and Azam, F.: Biogeochemical significance of bacterial biomass in the ocean’s euphotic zone, Mar. Eco. Prog. Ser., 63, 253–259, 1990.
Christaki, U., Van Wambeke, F., and Bianchi, M.: Heterotrophic bacterial growth and substrate utilization in the oligotrophic Eastern Mediterranean (Aegean Sea), Mediter. Mar. Sc., 4, 23– 39, 2004.
10
Coffin, R. B., Connolly, J. P., and Harris, P. S.: Availability of dissolved organic carbon to bacte-rioplankton examined by oxygen utilization, Mar. Ecol. Prog. Ser., 9, 9–22, 1993.
Cole, J. J., Findlay, S., and Pace, M. L.: Bacterial production in fresh and saltwater ecosystems: a cross-system overview, Mar. Ecol. Prog. Ser., 43, 1–10, 1988.
Ducklow, H. W. and Carlson, C. A.: Oceanic bacterial production, in: Advances in microbial
15
ecology, edited by: Marshall, K. C., Plenum Press, New York, 113–181, 1992.
Ducklow, H. W., Kirchman, D. L. Quinby, H. L., Carlson, C. A., and Dam, H. G.: Stocks and dynamics of bacterioplankton carbon during the spring phytoplankton bloom in the eastern North Atlantic Ocean, Deep-Sea Research II, 40, 245–263, 1993.
Dufour, P. and Torreton, J. P.: Bottom-up control of bacterioplankton from eutrophic to
olig-20
otrophic sites in the North-Eastern tropical Atlantic Ocean, Deep-Sea Res., 43, 1305–1320, 1996.
Fuduka, R., Ogawa, H., Nagata, T., and Koike, I.: Direct determination of carbon and nitrogen contents of natural bacterial assemblages in marine environments, Appl. Environ. Microbiol., 64, 3352–3358, 1998.
25
Gasol, J. M., Doval, M. D., Pinhassi, J., Calderon-Paz, J. I., Guixa-Boixareu, N., Vaqu ´e, D., and Pedros-Alio, C.: Diel variations in bacterial heterotrophic activity and growth in the north-western Mediterranean Sea, Mar. Ecol. Prog. Ser., 164, 107–124, 1998.
Gasol, J. M. and Mor ´an, X. A. G.: Effects of filtration on bacterial activity and picoplankton community structure as assessed by flow cytom ´etrie, Aquat. Microb. Ecol., 16, 251–264,
30
1999.
Gasol, J. M., Zweifel, U. L., Peters, F., Fuhrman, J. A., and Hagstr ¨om, A.: Significance of size and nucleic acid content heterogeneity as measured by flow cytometry in natural planktonic
BGD
5, 1899–1932, 2008 Short-term variation in bacterial abundance and production G. M ´evel et al. Title Page Abstract Introduction Conclusions References Tables Figures ◭ ◮ ◭ ◮ Back CloseFull Screen / Esc
Printer-friendly Version Interactive Discussion bacteria, Appl. Environ. Microbiol., 65, 4475–4483, 1999.
Gerdts, G., Wichels, A., D ¨opke, H., Klings, K. W., Gunkel, W., and Sch ¨utt, C.: 40-year long-term study of microbial parameters near Helgoland (German Bight, North Sea): historical view and future perspectives, Helgol. Mar. Res., 58, 230–242, 2004.
Ghiglione, J. F., M ´evel, G., Pujo-Pay, M., Mousseau, L., Lebaron, P., and Goutx, M.: Diel and
5
seasonal variations in abundance, activity and community structure of particle-attached and free-living bacteria in NW Mediterranean Sea, Microb. Ecol., 54, 217–231, 2007.
Ghiglione, J. F., Palacios, C., Marty, J. C., Mevel, G., Labrune, C., Conan, P., Pujo-Pay, M., Garcia, N., and Goutx, M.: Role of environmental factors for the vertical distribution (0– 1000 m) of marine bacterial communities in the NW Mediterranean Sea, Biogeosciences
10
Discuss., in press, 2008.
Harris, J. R. W., Stutt, E. D., and Turley, C. M.: Carbon flux in the northwest Mediterranean estimated from microbial production, Deep Sea Res. I, 48, 2631–2644, 2001.
Haury, L. R., Yamazaki, H., and Itsweire, E. C.: Effects of turbulent shear flow on zooplankton distribution, Deep-Sea Res. II, 37, 447–461, 1990.
15
Herndl, G. J. and Malacic, V.: Impact of the pycnocline layer on bacterioplankton diel and spatial variations in microbial parameters in the stratified water column of the Gulf of Trieste (Northern Adriatic Sea), Mar. Ecol. Prog. Ser., 38, 295–303, 1987.
Hollibaugh, T., Wong, P. S., Murrell, M. C.: Similarity of particle-associated and free-living bacterial communities in northern San Francisco Bay, California, Aquat. Microb. Ecol., 21,
20
102–114, 2000.
Hobbie, J. E., Daley, R. J., and Jasper, J.: Use of nucleopore filters for counting bacteria by fluorescence microscopy, Appl. Environ. Microbiol., 33, 1225–1228, 1977.
Karl, D. M., Knauer, G. A., and Martin, J. H.: Downward flux of particulate organic matter in the ocean: a particle decomposition paradox, Nature, 332, 438–441, 1988.
25
Kiørboe, T.: Turbulence, phytoplankton cell size and the structure of pelagic food webs, Adv. Mar. Biol., 29, 1–72, 1993.
Kirchman, D. L.: Leucine incorporation as a measure of biomass production by heterotrophic bacteria, in: Handbook of methods in aquatic microbial ecology, edited by: Kemp, P. F., Sherr, B. F., Sherr, E. B., and Cole, J. J., Lewis, Boca Raton, 509–512, 1993.
30
Kirchman, D. L., K’Ness, E., and Hodson, R.: Leucine incorporation and its potential as a measure of protein synthesis by bacteria in natural aquatic systems, Appl. Environ. Microbio., 49, 599–607, 1985.
BGD
5, 1899–1932, 2008 Short-term variation in bacterial abundance and production G. M ´evel et al. Title Page Abstract Introduction Conclusions References Tables Figures ◭ ◮ ◭ ◮ Back CloseFull Screen / Esc
Printer-friendly Version Interactive Discussion Kuipers, B., Noort, G. J., Vosjan, J. H., and Herndl, G. J.: Diel periodicity of bacterioplankton
in the euphotic zone of the subtropical Atlantic Ocean, Mar. Ecol. Prog. Ser., 201, 13–25, 2000.
Lebaron, P., Servais, P., Baudoux, A. C., Bourrain, M., Courties, C., and Parthuisot, N.: Vari-ations of bacterial-specific activity with cell size and nucleic acid content assessed by flow
5
cytometry, Aquat. Microb. Ecol., 28, 131–140, 2002.
Lem ´ee, R., Rochelle-Newall, E., Van Wambeke, F., Pizay, M. D., Rinaldi, P., and Gattuso, J. P.: Seasonal variation of bacterial production, respiration and growth efficiency in the open NW Mediterranean Sea. Aquat. Microb. Ecol., 29, 227–237, 2002.
Longnecker, K., Sherr, B. F., and Sherr, E. B.: Activity and phylogenetic diversity of bacterial
10
cells with high and low nucleic acid content and electron transport system activity in an upwelling ecosystem, Appl. Environ. Microbiol., 71, 7737–7749, 2005.
Longnecker, K., Sherr, B. F., and Sherr, E. B.: Variation in cell-specific rates of leucine and thymidine incorporation by marine bacteria with high and with low nucleic acid content off Oregon coast, Aquat. Microb. Ecol., 43, 113–125, 2006.
15
Marie, D., Partensky, F., Jacquet, S., and Vaulot, D.: Enumeration and cell cycle analysis of natural populations of marine picoplankton by flow cytometry using the nucleic acid stain SYBR Green I, Appl. Environ. Microbiol., 63, 186–193, 1997.
Marra, J., Bidigare, R. R., and Dickey, T. D.: Nutrients and mixing, chlorophyll and phytoplankton growth, Deep-Sea Res. II, 37, 127–143, 1990.
20
Marty, J. C.: Studies at the DYFAMED (France JGOFS) Time-Series Station, N.W. Mediter-ranean Sea, Deep Sea Res. II, 49, special issue, 2002.
Marty, J. C., Chiav ´erini, J., Pizay, M. D., and Avril, B.: Seasonal and interannual dynamics of nutrients and phytoplankton pigments in the western Mediterranean Sea at the DYFAMED time-series station (1991–1999), Deep-Sea Res. II, 49, 1965–1985, 2002.
25
Misic, C. and Fabiano, M.: Ectoenzymatic activity and its relationship to chlorophyll-a and bac-teria in the Gulf of Genoa (Ligurian Sea, NW Mediterranean), J. Mar. Systems, 60, 193–206, 2006.
Mor ´an, X. A. G., Bode, A., Su ´arez, L. A., and Nogueira, E.: Assessing the relevance of nucleic acid content as an indicator of marine bacterial activity, Aquat. Microb. Ecol., 46, 141–152,
30
2007.
Pearce, I., Davidson, A. T., Bell, E. M., and Wright, S.: Seasonal changes in the concentration and metabolic activity of bacteria and viruses at an Antarctic coastal site, Aquat. Microb.
BGD
5, 1899–1932, 2008 Short-term variation in bacterial abundance and production G. M ´evel et al. Title Page Abstract Introduction Conclusions References Tables Figures ◭ ◮ ◭ ◮ Back CloseFull Screen / Esc
Printer-friendly Version Interactive Discussion Ecol., 47, 11–23, 2007.
Pinhassi, J. and Hagstr ¨om, A.: Seasonal succession in marine bacterio-plankton, Aquat. Mi-crob. Ecol., 21, 245–256, 2000.
Platt, T., Sathyendranath, S., Edwards, A. M., Broomhead, D. S., and Ulloa, O.: Nitrate supply and demand in the mixed layer of the ocean, Mar. Ecol. Prog. Ser., 254, 3–9, 2003.
5
Platt, T., Sathyendranath, S., Ulloa, O., Harrison, W. G., Hoepffner, N., and Goes, J.: Nutrient control of phytoplankton photosynthesis in the western North-Atlantic, Nature, 356, 229–231, 1992.
Riemann, L. and Winding, A.: Community dynamics of free-living and particle-associated bac-terial assemblages during a freshwater phytoplankton bloom, Microb. Ecol., 42, 274–285,
10
2001.
Robarts, R. D., Zohary, T., Waiser, M. J., and Yacobi, Y. Z.: Bacterial abundance, biomass and production in relation to phytoplankton biomass in the Levantine Basin of the southeastern Mediterranean Sea, Mar. Ecol. Prog. Ser., 137, 273–281, 1996.
Sapp, M., Wichels, A., Wiltshire, K. H., and Gerdts, G.: Bacterial community dynamics during
15
the winter-spring transition in the North Sea, FEMS Microbiol. Ecol., 59, 622–637, 2007. Scharek, R. and Latasa, M.: Growth, grazing and carbon flux of high and low nucleic acid
bacteria differ in surface and deep chlorophyll maximum layers in the NW Mediterranean Sea, Aquat. Microb. Ecol., 46, 153–161, 2007.
Servais, P., Casamayor, E. O., Courties, C., Catala, P., Parthuisot, N., and Lebaron, P.: Activity
20
and diversity of bacterial cells with high and low nucleic acid content, Aquat. Microb. Ecol., 33, 41–51, 2003.
Sherr, E. B., Sherr, B. F., and Longnecker, K.: Distribution of bacterial abundance and cell-specific nucleic acid content in the Northeast Pacific Ocean, Deep-Sea Res. I, 53, 713–725, 2006.
25
Shiah, F. K. and Ducklow, H. W.: Temperature regulation of heterotrophic bacterioplankton abundance, production and specific growth rate in Chesapeake Bay, Limnol. Oceanogr., 39, 1243–1258, 1994.
Simon, M., Grossart, H. P., Schweitzer, B., and Ploug, H.: Microbial ecology of organic aggre-gates in aquatic ecosystems, Aquat. Microb. Ecol., 28, 175–211, 2002.
30
Smith, D. C. and Azam, F.: A simple, economical method for measuring bacterial protein syn-thesis rates in seawater using3H-leucine, Mar. Microb. Food Webs, 6, 107–114, 1992. Socal, G., Boldrin, A., Bianchi, F., Civitarese, A., Rabitti, S., Totti, C., and Turchetto, M.:
Nutri-BGD
5, 1899–1932, 2008 Short-term variation in bacterial abundance and production G. M ´evel et al. Title Page Abstract Introduction Conclusions References Tables Figures ◭ ◮ ◭ ◮ Back CloseFull Screen / Esc
Printer-friendly Version Interactive Discussion ent, particulate matter and phytoplankton variability in the photic layer of the Otranto strait,
J. Mar. Systems, 20, 381–398, 1999.
Tamburini, C., Garcin, J., Ragot, M., and Bianchi, A.: Biopolymer hydrolysis and bacterial production under ambient hydrostatic pressure through a 2000 m water column in the NW Mediterranean, Deep-Sea Res. II, 49, 2109–2123, 2002.
5
Tanaka, T. and Rassoulzadegan, F.: Vertical and seasonal variations of bacterial abundance and production in the mesopelagic layer of the NW Mediterranean Sea: bottom-up and top-down controls, Deep-Sea Res. I, 51, 531–544, 2004.
Turley, C. and Lochte, K.: Diel changes in the specific growth rate and mean cell volume of natural bacterial communities in two different water masses in the Irish Sea, Microb. Ecol.,
10
12, 271–282, 1986.
Turley, C. M. and Stutt, E. D.: Depth-related cell-specific bacterial leucine incorporation rates on particles and its biogeochemical significance in the Northwest Mediterranean, Limnol. Oceanogr., 45, 419–425, 2000.
Van Wambeke, F., Christaki, U., Bianchi, M., Psarra, S., and Tselepides, A.: Heterotrophic
15
bacterial production in the Cretan Sea (NE Mediterranean, Prog. Oceanogr., 46, 205–216, 2000.
Van Wambeke, F., Goutx, M., Striby, L., Semp ´er ´e, R., and Vidussi, F.: Bacterial dynamics during the transition from spring bloom to oligotrophy in the northwestern Mediterranean Sea: relationships with particulate detritus and dissolved organic matter, Mar. Ecol. Prog.
20
Ser., 212, 89–105, 2001.
Van Wambeke, F., Heussner, S., Diaz, F., Raimbault, P., and Conan, P.: Small-scale variability in the coupling/uncoupling of bacteria, phytoplankton and organic carbon fluxes along the continental margin of the Gulf of Lions, Northwestern Mediterranean Sea, J. Mar. Systems, 33–34, 411–429, 2002.
25
Vaulot, D.: CYTOPC: Processing software for flow cytometric data, Signal and Noise, 2, p. 8, 1989.
Velji, M. I. and Albright, L. J.: Improved sample preparation for enumeration of aggregated aquatic substrate bacteria, in: Handbook of methods in aquatic microbial ecology, edited by: Kemp, P. F., Sherr, B. F., Sherr, E. B., and Cole, J. J., Lewis, Boca Raton, 139–142, 1993.
30
Vidussi, F., Marty, J. C., and Chiaverini, J.: Phytoplankton pigment variations during the tran-sition from spring bloom to oligotrophy in the Northwestern Mediterranean Sea, Deep-Sea Res. I, 47, 423–445, 2000.
BGD
5, 1899–1932, 2008 Short-term variation in bacterial abundance and production G. M ´evel et al. Title Page Abstract Introduction Conclusions References Tables Figures ◭ ◮ ◭ ◮ Back CloseFull Screen / Esc
Printer-friendly Version Interactive Discussion Wikner, J. and Hagstr ¨om, ˚A.: Bacterioplankton intra-annual variability: importance of
hydrogra-phy and competition, Aquat. Microb. Ecol., 20, 245–260, 1999.
Winter, C., Herndl, G., and Weinbauer, M. G.: Diel cycles in viral infection of bacterioplankton in the North Sea, Aquat. Microb. Ecol., 35, 207–216, 2004.
Worm, J., Gustavson, K., Garde, K., Borch, N. H., and Søndergaard, M.: Functional similarity
5
of attached and free-living bacteria during freshwater phytoplankton blooms, Aquat. Microb. Ecol., 25, 103–111, 2001.
Wu, Y., Platt, T., Tang, C. C. L., and Sathyendranath, S.: Short-term changes in chlorophyll distribution in response to a moving storm: a modeling study, Mar. Ecol. Prog. Ser., 335, 57–68, 2007.
10
Zubkov, M. V., Tarran, G. A., and Burkill, P. H.: Bacterioplankton of low and high DNA content in the suboxic waters of the Arabian Sea and the Gulf of Oman: abundance and amino acid uptake, Aquat. Microb. Ecol., 43, 23–32, 2006.
BGD
5, 1899–1932, 2008 Short-term variation in bacterial abundance and production G. M ´evel et al. Title Page Abstract Introduction Conclusions References Tables Figures ◭ ◮ ◭ ◮ Back CloseFull Screen / Esc
Printer-friendly Version Interactive Discussion
Table 1. Seasonal evolution of total bacteria biomass (TBB), total bacterial production (TBP) and total specific activity (TSA) in the euphotic layer (0–150 m) at the Dyfamed site. The data (mean ± SD) are integrated over the upper 0–150 m depth. N = number of samples analysed.
TBB TBP TSA
(mmol C m−2) (mmol C m−2h−1) (fg C cell−1day−1)
March 2003 (N=24) 229.8±6.8 4.4±1.4 0.29±0.08
June 2003 (N=24) 39.4±17.6 1.7±0.3 0.75±0.46
BGD
5, 1899–1932, 2008 Short-term variation in bacterial abundance and production G. M ´evel et al. Title Page Abstract Introduction Conclusions References Tables Figures ◭ ◮ ◭ ◮ Back CloseFull Screen / Esc
Printer-friendly Version Interactive Discussion
TBA (x105 ml-1) TBA (x105 ml-1)
TBP (ng C l-1 h-1) TBP (ng C l-1 h-1)
Julian days Julian days
Fig. 1. Five week variations of total bacterial abundance (TBA) and total bacterial production (TBP) in the euphotic zone (0–150 m depth). Crosses indicate sampling times and depths.
BGD
5, 1899–1932, 2008 Short-term variation in bacterial abundance and production G. M ´evel et al. Title Page Abstract Introduction Conclusions References Tables Figures ◭ ◮ ◭ ◮ Back CloseFull Screen / Esc
Printer-friendly Version Interactive Discussion H N A ( % ) T B B /A B T B P ( m m o l C m -2 d -1) T B B ( m m o l C m -2) 0 20 40 60 80 100 120 260 265 270 275 280 285 290 0 1 2 3 4 5 260 265 270 275 280 285 290 30 40 50 60 260 265 270 275 280 285 290 0 1 2 3 4 260 265 270 275 280 285 290
Julian days Julian days
Fig. 2. Evolution of bacterial parameters integrated over the upper 0–150 m. TBB = total
bacterial biomass; TBP = total bacterial production; HNA = relative abundance of cells with high nucleic acid content to the total bacterial abundance; TBB/AB = TBB to autotrophic biomass ratio.