HAL Id: inserm-00484804
https://www.hal.inserm.fr/inserm-00484804
Submitted on 19 May 2010
HAL is a multi-disciplinary open access
archive for the deposit and dissemination of
sci-entific research documents, whether they are
pub-lished or not. The documents may come from
teaching and research institutions in France or
abroad, or from public or private research centers.
L’archive ouverte pluridisciplinaire HAL, est
destinée au dépôt et à la diffusion de documents
scientifiques de niveau recherche, publiés ou non,
émanant des établissements d’enseignement et de
recherche français ou étrangers, des laboratoires
publics ou privés.
Architecture and callosal connections of visual areas 17,
18, 19 and 21 in the ferret (Mustela putorius).
Giorgio Innocenti, Paul Manger, Italo Masiello, Isabelle Colin, Laurent Tettoni
To cite this version:
Giorgio Innocenti, Paul Manger, Italo Masiello, Isabelle Colin, Laurent Tettoni. Architecture and
callosal connections of visual areas 17, 18, 19 and 21 in the ferret (Mustela putorius).. Cerebral
Cortex, Oxford University Press (OUP), 2002, 12 (4), pp.411-22. �inserm-00484804�
Visual areas 17, 18, 19 and 21 of the ferret can be distinguished on the grounds of cytoarchitecture, myeloarchitecture and cytochrome oxidase reactivity, and with transneuronal tract-tracing from the eye. Each visual area contains callosally connected, as well as acallosal, regions. The callosal connections originate mainly from layers 2 and 3 and, more widely, from layer 6. Callosally projecting neurons and callosal terminals are organized in three roughly medio-laterally oriented bands. The posterior and intermediate bands straddle the 17/18 and 19/21 border, respectively; the third band extends along the medial bank of the lateral suprasylvian sulcus. These bands are linked by a variable number of bridges of connections that demarcate acallosal islands. The distribution of callosal connections predicts the existence of vertical meridian representations corresponding to each of the bands and of non-isotropic representations of the visual field within the bridges and islands.
Introduction
In recent years, the ferret (Mustela putorius) has been increas-ingly used as an experimental animal for studies of development and plasticity of the central ner vous system, particularly of the visual system (Dehay et al., 1980; Linden et al., 1981; McConnell, 1985; Chapman et al., 1996; Cramer et al., 1996; Chalupa and Snider, 1998; Chapman and Bonhoeffer, 1998; Pallas et al., 1999). One reason for this interest is the assumption that the organization of the ferret’s visual system resembles that of the cat, which has been well characterized. Morover, in comparison with other mammals, the ferret is born at an early stage of neurogenesis (Clancy et al., 2001). Therefore, certain developmental events that occur in utero in other mammals can be studied postnatally in the ferret.
Our long-term goals are to understand the degree of early specification of cortical areas [for a debate see (Rakic, 1988; O’Leary et al., 1994; Ragsdale and Grove, 2001)] and the role of transient cortical projections in the developmental plasticity of cerebral cortex (Innocenti et al., 1977; Innocenti, 1995). Because of normative data already available in several species, the visual system appears most appropriate for addressing these issues. However, the number, location and properties of extra-striate visual areas are unknown in the ferret.
In this paper we have begun a systematic definition of extrastriate visual areas of the ferret using cytoarchitecture, myeloarchitecture and cytochrome oxidase reactivity. Addi-tionally we have investigated the distribution of callosal connections as this approach has provided cues to the location and retinotopic organization of the visual areas in other species (van Essen and Zeki, 1978). These traditional anatomical methods were used to facilitate comparisons with data in other species.
Additional motivation for this work is that the only carnivore whose extrastriate visual areas have been investigated is the cat (Hubel and Wiesel, 1965, 1969; Palmer et al., 1978; Tusa et al., 1979; Tusa and Palmer, 1980; Sherk, 1986; Updyke, 1986;
Dreher et al., 1996). Homologies have been drawn between cat and primate extrastriate visual areas (Payne, 1993). These hom-ologies, however, need to be tested by studying other species of the same Order.
In a companion paper (Manger et al., 2002) the same areas were defined from electrophysiological recordings and the results compared with the anatomical features described here.
Materials and Methods
This study was performed on five adult female ferrets (Mustela putorius) from Marshall Farms (North Rose, N Y) processed in Lausanne (Switzer-land). Fourteen additional female ferrets purchased from a Swedish breeder were processed in Stockholm. A ll procedures conformed to National and EC regulations.
Anesthesia
For cortical/intraocular injections, animals were anesthetized with intramuscular doses of ketamine hydrochloride (Ketalar, 10 mg/kg) and medetomidin hydrochloride (Domitor, 0.08mg/kg), supplemented with atropine sulphate (0.15 mg/kg). The animals were placed in a stereotaxic frame, and maintained on gas anesthesia (1.5% isof lurane in a mixture of 1:1 nitrous oxide and oxygen). Throughout the experiment the anesthetic level was monitored by measuring heart rate, respiratory rate and the pinch ref lex.
At the end of the survival period the animals were euthanized with Nembutal (150 mg/kg, i.p.) and perfused through the heart with protocol-appropriate fixatives (see below).
Tracer Injections
In three animals, processed in Stockholm, one eye was injected with 10–15µl of 5% wheat germ agglutinin–horseradish peroxidase (WGA-HRP) in distilled water (3 day survival period).
In the other 12 animals the entire visual cortex of one hemisphere was exposed. In the five Lausanne animals, 5–6 × 0.5µl injections of 30% HRP (Boehringer, Mannheim, Germany) with 10% WGA-HRP (Sigma) dis-solved in phosphate buffer (0.1 M, pH 7.35) were delivered by pressure into the lateral gyrus, with glass pipettes of∼30µm tip diameter (3 day sur vival period). Injection coverage was estimated by the extent of labeling in the ipsilateral dorso-lateral geniculate nucleus (dLGN).
In the Stockholm animals we used biotinylated dextran amine (BDA; 5% in 0.1 M phosphate buffer, Molecular Probes) (five animals) or f luorescent red beads (Lumaf luor) (two animals). Using a Hamilton syringe, 20–30 injections were made throughout the visual cortex of one hemisphere (2 week sur vival period). The two ferrets injected with beads also had intraocular injections (above), 3 days before being euthanized. The five animals injected with BDA were also used for electro-physiological mapping experiments (Manger et al., 2002) conducted on the opposite hemisphere. Antibiotics were administered in all cases (Tetramycin, 40 mg/kg, each day for 3–5 days).
Processing and Histology
Four non-experimental animals were euthanized and perfused with 4% paraformaldehyde. Their brains were cryoprotected in 30% sucrose in 0.1 M phosphate buffer (at 4°C), and 1 in 4 series of frozen, parasagittal sections (50 µm thick) were stained with 1% cresyl violet, myelin (Gallyas, 1979), cytochrome oxidase (CO) (Carroll and Wong-Riley, 1984) and 1% toluidine blue.
Architecture and Callosal Connections of
Visual Areas 17, 18, 19 and 21 in the Ferret
(Mustela putorius)
Giorgio M. Innocenti1,2, Paul R. Manger1, Italo Masiello1,
Isabelle Colin1,2,3and Laurent Tettoni2
1Division of Neuroanatomy and Brain Development,
Department of Neuroscience, Karolinska Institutet, S-17177 Stockholm, Sweden and2Institute of Cell Biology and
Morphology, University of Lausanne, Lausanne, Switzerland
3Current address: INSERM U29 163, rte de Luminy, B.P.13,
The five animals with WGA-HRP injections were perfused trans-cardially with phosphate-buffered saline (PBS, 0.06 M, pH 7.35), followed by paraformaldehyde 1.5% and glutaraldehyde 1.25% (or by paraformalde-hyde 3% alone) in PBS, and a postwash with PBS–sucrose 20%. The brains were immersed in PBS–sucrose 30% overnight and then cut parasagittally at 75µm on a cryostat. Alternate sections were processed for HRP histo-chemistry with tetramethyl benzidine (TMB) as the chromogen (Mesulam and Brushart, 1979), toluidine-blue and CO staining.
The animals with f luorescent bead injections, and those with intraocular injections of WGA-HRP (2 with both) were perfused with 3% paraformaldehyde. Their brains were cut frozen at 50µm, in semi-f lattened preparations (see below); 1 in 2 or 1 in 3 sections were mounted on gel-coated slides and obser ved uncoverslipped with f luorescent excitation, the other sections were reacted for HRP or CO.
All the animals injected with BDA were perfused initially with 0.9% saline solution (4°C, 500 ml/kg), followed by 4% paraformaldehyde in 0.1 M phosphate buffer (4°C, 1000 ml/kg). The brain was post-fixed overnight in the same solution, cryoprotected in 30% sucrose in 0.1 M phosphate buffer (at 4°C), and sectioned at 50µm. During the freezing process the dorso-lateral surface of the hemisphere was f lattened using a clean glass slide. This caused some distortion along the medio-lateral axis, as the natural curvature of the ferret cerebral hemisphere became f lat.
A lternate sections were stained for CO or reacted for BDA. BDA visualization involved incubating sections in 0.5% bovine serum albumin (BSA) in 0.05 M Tris buffer for 1 h. This was followed by incubation in an avidin–HRP solution for 3 h. A 10 min preincubation in 0.2% NiNH4SO4 preceded the addition of H2O2(200µl/l) to this solution, at which time the sections were monitored visually for the reaction product. The reac-tion was stopped by placing the secreac-tions in 0.05 M Tris buffer. All secreac-tions were mounted on gel-coated slides, dehydrated, cleared in xylene and coverslipped.
Analysis of Material
For WGA-HRP material, the injection sites, labeled neurons and trans-thalamic transport in the cortex were documented with camera lucida drawings and photomicrographs. Selected sections were charted with a computerized image-combining microscope (Glaser et al., 1983) (Neurolucida, MicroBrightField Inc., Colchester, VT). The distribution of callosal neurons was correlated with area architectonic borders. In each section, the cortex was delineated by its pial and white-matter outlines, and infra- and supra-granular cells charted.
For 3-D or f lattened computer reconstructions, markers were placed at relevant locations (17/18and 18/19 borders, lateral and suprasylvian sulci, and the crown of gyri). The 3-D reconstructions were obtained from sections digitized with a graphic tablet and analyzed by software developed at the University of Lausanne.
In order to obtain f lattened views, we defined in each section a curvilinear axis located at mid-cortical depth. The location of cells and markers were projected onto the axis, in a direction radial to the cortical surface, and the cur vilinear axis straightened. This was repeated for ever y section and the resulting tangential distributions were plotted sequentially, aligned on the crown of the lateral gyrus and separated by the slice thickness.
In the BDA/f luorescent beads material, the labeled cell bodies were examined under light or f luorescent illumination and plotted using the Neurolucida (as above). Outlines of the section, sulcal patterns, electrode tracks and blood vessels were used to align the sections. All sections were aligned and a complete map of the interhemispheric connections was generated for each case.
The three types of rendering used — 3-D ‘transparent’ reconstruc-tion, computer-f lattened reconstruction and tangential sections after manual f lattening — have different advantages and disadvantages. The 3-D reconstruction allows visualization of labeled neurons at all cortical depths. The computer-f lattened reconstruction disambiguates the depth relations of neurons at different brain locations or in sulci, but it intro-duces distortions of the brain surfaces. The tangential sections allow appreciation of the distribution of the labeled neurons in the absence of major deformations. For this reason it was found particularly useful in combined anatomical and electrophysiological experiments (Manger et
al., 2002).
Results
Architectonic Areas of the Lateral and Suprasylvian Gyri of the Ferret
The thickness of layers 1, 3, 4 and 6, neuronal size in layers 3 and 5, and the cellular organization of layer 6 are the cytoarchi-tectonic differences between areas. For myeloarchitecture, differences are in the overall density of staining, the organization of radial fascicles, and the abundance and distribution of tangential fibers. Sections stained with either CO or intra-ocular tracers were useful for determining the extent of areas 17 and 18. Some architectonic differences are subtle and gradual, others are striking and sharper. All are consistent, and allow identi-fication of area borders with an accuracy of∼200µm. The extent of the various areas is shown in Figure 1.
Area 17
In Nissl stains (Figs 2A and 3A), layers are easily delineated. Layer 2 consists of small, round cell bodies, more densely packed than in layer 3, which is characterized by both small and medium-sized pyramidal cells. Layer 4 is thick and can be subdivided into 4a and 4b, characterized by large granule cells, and 4c, which is thinner and consists of smaller granule cells. Layer 5 has the lowest cell density and contains large pyramidal neurons. In
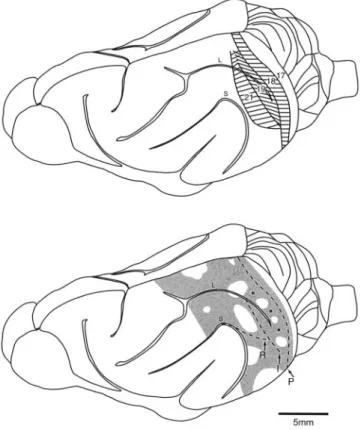
Figure 1. Top, schematic view of the ferret hemisphere showing the location of areas
17, 18, 19 and 21 as determined by architectonic criteria in the present study. Note that each area appears as a mediolaterally oriented strip, 1–1.5 mm wide. Area 18 lies anterior to area 17 and posterior to the lateral sulcus. Area 19 lies anterior to the middle 9–10 mm of area 18 and extends over both banks of the lateral sulcus. Area 21, anterior to area 19, exhibits similar dimensions and lies on the convexity of the suprasylvian gyrus, posterior to the suprasylvian sulcus. Bottom, schematic showing the distribution of callosal connections (shaded). The dashed lines mark the posterior (P), intermediate (I) and anterior (R) bands of callosal connections; asterisks mark some of the callosal bridges. Note that the P and I bands straddle the 17/18 and 19/21 borders; the R band extends into the suprasylvian sulcus, as shown in Figure 7. L: lateral sulcus; S: supra-sylvian sulcus.
layer 6 the cell density increases again and the neurons are organized in distinct, radially oriented palisades, 2–3 cell bodies thick.
In myelin preparations (Figs. 2C,D and 3E) area 17 is characterized by a high density of thick radial fascicles. These fibers predominate in layer 4, and are mixed in other layers with the less prominent tangentially oriented fibers. In layer 2 there were only radial fibers, and in superficial layer 1, which is myelin rich in comparison to that of the extrastriate areas, there are again tangentially running fibers.
With CO staining (Fig. 2B) layer 4 is clearly identifiable as an intensely labeled band,∼200µm thick, with a sharp border with layers 3 and 5.
Area 18
Differences in cytoarchitectonics and CO staining can be seen between areas 17 and 18(Rockland, 1985; Grigonis et al., 1992). Rockland also reported that area 18is characterized by the dis-appearance of an acetylcholinesterase poor band, characteristic of area 17. Moreover, we identified differences in myelination between these two areas.
In Nissl-stained sections (Figs 2A and 3B), layer 3 becomes thicker in area 18and can be subdivided into a superficial region, consisting of small pyramidal cells (sublayers 3a and 3b, which cannot be differentiated), and a characteristic deeper sublayer (3c) with prominent medium-sized pyramidal cells, larger than in area 17. Also, compared with area 17, layer 4 is thinner and the palisades in layer 6 consist of rows of individual cells.
In myelin-stained sections (Figs 2C,D and 3E,F), the radial fascicles become less dense than in area 17, and the number of tangential fibers increases in layers 5 and 6. A particularly robust criterion is that superficial layer 1 becomes less heavily myelinated than in area 17, although it remains more myelinated than in further rostral areas.
The CO band (Fig. 2B) is slightly thicker than in area 17 (∼300µm). It maintains a sharp border with layer 5, but its upper boundary is blurred and is located in layer 3.
The anterior border of area 18is defined by the near disappearance of the CO band in layer 4. The medial-most 1–1.5 mm of area 18abuts a parietal field characterized by lower CO and myelin. The middle 9–10 mm of the border abuts area 19 (below), and the lateral 1–1.5 mm a temporal region character-ized by particularly low CO and myelin staining.
Retino-geniculo-cortical Projections to Areas 17 and 18 Areas 17 and 18can be defined by the transgeniculate transport of intraocularly injected WGA-HRP (Fig. 4). The contralateral eye occupies a crescent-shaped territory on the dorsal aspect of the hemisphere, posterior to the lateral sulcus. This territory corresponds to the CO-rich region that characterizes areas 17 and 18(compare Fig. 4A and B). Regions of more intense and less intense labeling alternate. The latter presumably corresponds to the termination of axons pertaining to the ipsilateral, non-injected eye and the pattern is similar to the ocular dominance pattern described by others (Law et al., 1988; Redies et al., 1990; White et al., 1999). A prominent mediolateral band of lighter staining appears to correspond to that described by White et al.
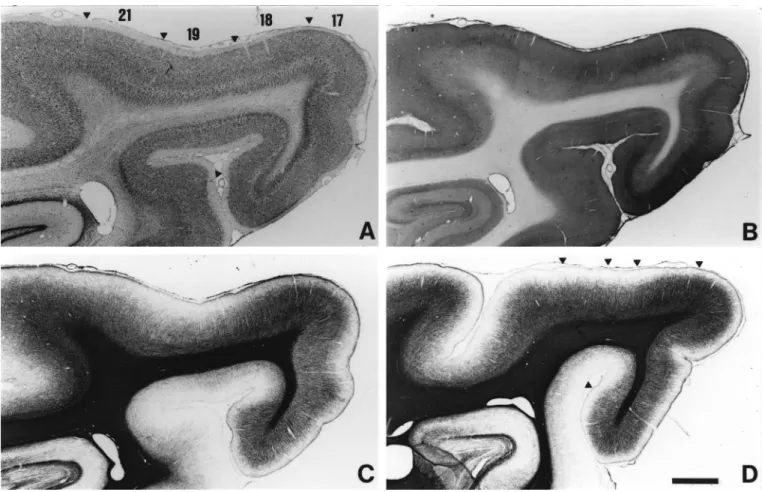
Figure 2. Architecture of areas 17, 18, 19 and 21. Photomicrographs of adjacent parasagittal sections stained with cresyl violet (A), CO (B) and myelin (C). An additional, more lateral,
myelin-stained section is shown in (D). Note that the band of intense CO reactivity corresponds to area 17 layer 4, and layers 3 and 4 of area 18. Area 19 appears as a region of low myelination. Note the reduction in the antero-posterior extent of areas 19 and 21 in the more lateral section (D). Posterior is to the right, dorsal is up. Scale bar = 1 mm.
(White et al., 1999), thus its posterior border presumably marks the 17/18 transition.
Area 19
The architectonic features of this area are exaggerated by the
local pattern of gyration (Welker, 1990), but are clearly related to the existence of a distinct representation of the contralateral visual hemifield (Manger et al., 2002).
In preparations stained for cell bodies (Figs 2A and 3C) the lamination is indistinct in layers 2–5. Compared with area 18,
Figure 3. Architecture of areas 17 (A, E), 18 (B, F), 19 (C, G) and 21 (D, H). Photomicrographs of details from sections stained with cresyl violet (A–D) or myelin (E–H). Layer
layer 1 is thicker, and the sublamination is absent. Layer 4 is less distinct and thinner, and the palisades of layer 6 are thicker, being several cell diameters across, as in area 17, but are less orderly.
Area 19 is the least myelinated of all the areas (Figs 2C,D and 3C,G). The radial fascicles are shorter, thinner and less dense than other areas, and layer 1 is almost myelin free. A striking feature of this area is the predominance and density of tangential fibres in layers 5 and 6.
There is very low CO staining, and the CO band in layers 3–4 is weak and inconsistent (Fig. 2B).
The anterior border of area 19 abuts area 21. The medial-most extension of area 19 blends somewhat with area 21 and is bordered by the more heavily myelinated parietal visual areas.
Area 21
In comparison with area 19 (Figs 2A and 3D), layer 4 becomes more prominent, with large pyramidal cells in layer 5. The palisades of layer 6 are one cell wide, as in area 18, but less orderly. Myelin density (Figs 2C and 3H) increases but not to the density of area 18. The radial fascicles remain thin, but their
density is higher and they span layers 2–5. The tangential fibers are as numerous as the radial ones in most layers.
Area 21 is CO poor and the band in layer 3–4 is absent (Fig. 2B).
The anterior border of area 21 abuts parietal cortex medially and suprasylvian cortex laterally (Manger et al., 2002), and is characterized by a slight increase in myelination and CO staining, and the appearance of pyramidal neurons in layer 3c. The lateral border of area 21 abuts temporal cortex, which is particularly low in CO (Fig. 4A) and myelin staining.
Distribution of Interhemispheric Connections Extent of Injection Sites
Five animals received varying WGA-HRP injections in the visual areas of one hemisphere. The largest injection site (Fig. 5A) included most of area 17 dorso-ventrally, most of area 18and the posterior part of area 19. The dLGN contained labeled neurons throughout its volume. The smallest injection site spared the lateral part of area 17. The dLGN was labeled only in its ventral third. The size and location of the injection sites in the other animals was between those mentioned above. In all animals the
Figure 4. Semi-flattened sections through the caudal part of the ferret hemisphere in which CO (A) and transgeniculate WGA-HRP transported from the contralateral eye (B) were
visualized. Arrows indicate the anterior border of area 18 in (A), denoted by the limit of CO reactivity, and in (B), denoted by the anterior limit of the WGA-HRP stained region, and the 17/18 border. Note that regions with high and low WGA-HRP staining alternate, indicating contralateral and ipsilateral eye domains. L and S mark the lateral and suprasylvian sulci. Orientation arrows point medially and anteriorly.
core of the injection sites covered the representation of the zero meridian at the 17/18 border.
The injection sites of the BDA or f luorescent beads series were widely distributed over the lateral and suprasylvian gyri, and typically involved parts of area 17, the whole of areas 18, 19 and 21, and beyond. Consequently, the majority of the dLGN and
nucleus lateralis posterior were labeled. The different tech-niques provided similar results and will be described together. Radial Distribution and Morphology of Callosally Projecting Neurons
Labeled neurons were distributed in two laminae, separated by a
Figure 5. HRP injections and labeling. (A) Dorsal view of the brain. The dots on the right hemisphere and dashed line indicate the injection sites and spread in this case. The
white rectangle on the left hemisphere delimits the region that contains labeled callosally projecting neurons. Interrupted lines indicate the locations of the sections shown in C1 and
D1. (B1) Photomicrograph of a parasagittal section through the dLGN ipsilateral to the injection site (toluidine blue). (B2) TMB visualization of transported WGA-HRP in a section
adjacent to B1. (C1, D1) WGA-HRP labeling in parasagittal sections from the hemisphere contralateral to the injections. The black squares delimit the regions magnified in C2 and D2. Note that mostly pyramidal neurons of layers 2/3 and 6 are labeled. lat: lateral sulcus; s syl: suprasylvian sulcus. Scale bar (shown in D2): 1 mm in B1, B2, C1 and D1, 160µm in C2 and D2.
lamina with few or no labeled neurons. The more superficial lamina (the supragranular zone) corresponds to layer 3, with a few neurons in layers 2 and 4. The deep lamina corresponds to layer 6 (the infragranular zone), but a few neurons were also found in layer 5. The neuron-poor lamina corresponds to layers 4 and 5.
In all animals the neurons were more widely distributed infragranularly than supragranularly. This was particularly true in rostral visual areas, where the infragranular neurons were both more widely distributed and more numerous (Figs 6 and 7). The dendrites were sufficiently labeled to show that the majority of callosally projecting neurons were small or medium-sized pyramidal cells in the supragranular layers, or polymorph neurons in layer 6.
Tangential Distribution of Projecting Neurons
In the WGA-HRP series, the tangential distribution of the callosally projecting neurons was studied with 3-D ‘transparent’ reconstructions and computer-f lattened reconstructions (Fig. 7) from parasagittal sections. The BDA and f luorescent beads series were studied in tangential sections after manual partial f latten-ing (Figs 8and 9). These three types of renderlatten-ing provide complementary information.
Labeled neurons were found over a larger territory than that covered by the injection sites, indicating that the visual areas receive callosal projections from both corresponding (homo-topic) and non-corresponding (hetero(homo-topic) locations. A fter injections restricted to the caudal part of the hemisphere, the heterotopic connections originated mainly from the infra-granular layers of the rostralmost areas.
Callosal connections were organized in three bands, partially interconnected by bridges of labeled neurons and separated by acallosal islands (Fig. 1). In the f lattened reconstructions of the WGA-HRP series, the different width and distribution of the bands in the supra- and infragranular layers could also be appreciated (Fig. 7).
The most posterior band was oriented medio-laterally on the dorsal aspect of the hemisphere and straddled the 17/18 border. In supragranular layers, this band was 1–2 mm wide, with one-third or less of its width in area 17. The band was broader in infragranular layers and mainly in area 18. Thus, the contribution of area 17 is relatively minor, most neurons being located within area 18(Figs 6–9).
The intermediate band corresponded laterally to the fundus, and more medially to the posterior bank of the lateral sulcus and extended medially beyond this sulcus. This band was more variable in its thickness and length than the posterior band with which it tended to blend both laterally and medially. It was also somewhat discontinuous in the supragranular layers. This band was seen to straddle the 19/21 border, and in supragranular layers it extended for∼0.5 mm on either side.
A third, most rostral band of labeled neurons, originated from the intermediate band laterally, and ran obliquely along the medial bank and fundus of the suprasylvian sulcus. The connec-tion between this band and the intermediate band was a large patch of labeled neurons in area 21.
The bands were interconnected by bridges of labeled neurons and separated by acallosal islands — irregularly circular regions, 1–3 mm in diameter, devoid of labeled neurons. Typically, the 17/18and 19/21 bands were interconnected by 2–4 bridges. Therefore, the bridges extend across areas 18and 19, with the islands centered on the 18/19 border. The posterior and lateral part of the suprasylvian gyrus (area 21) contained 2–3 bridges, separated by one or two acallosal islands. The anterior border of
area 21 intersects these acallosal islands. Taken together, bands, bridges, and islands give the distribution of callosal connections a honeycomb appearance (Figs 7–9). Dense callosal connec-tions are also found anterior to area 21, in the posterior parietal cortex (Fig. 8).
In addition to the dorsal region of labeling described above, labeled neurons were found in the ventral aspect of the hemi-sphere outside areas 17 and 18. Regions containing callosally projecting neurons also contained callosal terminals, usually more densely distributed (Fig. 9).
Individual Variability of Callosal Connections
The distribution of labeling differed across individual animals. Some of these differences related to differences in the location of the injections. The labeling was clearly most extensive in the animals of the WGA-HRP series with the largest injection sites. The 17/18band was more strongly labeled in the WGA-HRP series than the BDA/f luorescent beads series due to the more rostral location of injections in the latter. The BDA/ f luorescent beads series revealed the existence of heavily
Figure 6. Computer-aided charts of HRP-labeled callosal neurons (dots) in three
sections from F1 (a is medial, c is lateral) and in F2. F1a and b are 225µm from sections
C1 and D1 of Figure 5. Area borders are marked. Note that the labeled neurons occupy
two zones corresponding to layers 2/3 and 6, and are separated by a less densely labeled zone (layers 4 and 5; see Fig. 5). Note the labeling in the ventral part of the brain in section F1c (possibly corresponding to a splenial visual area) and in section F2a (ventral border of 17). Posterior is to the right, dorsal is up.
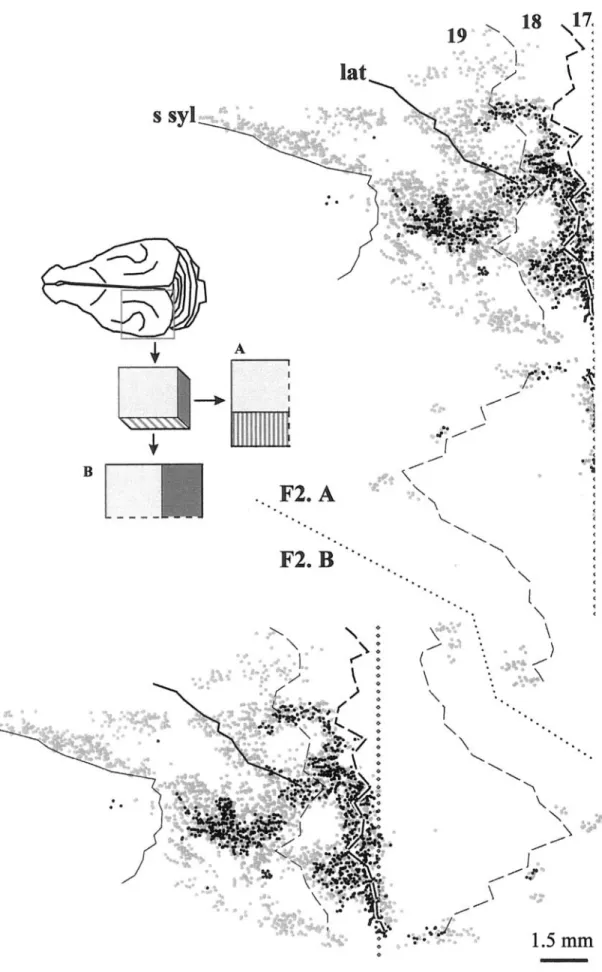
Figure 7. Computer-flattened reconstruction of the distribution of callosal neurons in ferret F2. Mediolateral unfolding (A) and anteroposterior unfolding (B) — see insert — are used
connected regions rostral to area 21 and medial to the supra-sylvian sulcus. These findings suggest that callosal connections in the ferret, as in the cat (Innocenti, 1980; Houzel et al.,
1994), are roughly point-to-point, at least in the supragranular layers.
Residual differences in the distributions of labeled neurons
Figure 8. Distribution of callosally projecting neurons in a semi-flattened section. Each labeled neuron is represented by a dot. A thin line corresponds to the anterior border of area
18, based on the pattern of CO reactivity (see Fig. 4A). Other thin lines denote the location of somatosensory area 3b, the first auditory area (A1) and temporal visual cortex (area 20). vis and som, indicate regions from which mainly visual, or mainly somatosensory responses could be recorded (Manger et al., 2002). Note the existence of a mediolaterally oriented band of callosal connections (see Fig. 1) corresponding to the 19/21 border, and the existence of acallosal islands at the 18/19 border and in area 21. Orientation arrows point anteriorly (A) and medially (M).
are probably due to genuine interindividual variability of the interhemispheric connections. They concern the precise loca-tion of the callosally connected bands, bridges, and acallosal islands (compare Figs 8 and 9).
Discussion
Cytoarchitectonic and myeloarchitectonic criteria, reactivity to CO and transport of WGA-HRP injected into the eye allow us to identif y three extrastriate visual areas in the ferret. These areas are connected, through the corpus callosum (see below), to corresponding regions of the contralateral hemisphere. The callosal connections relate to areal borders and predict aspects of the retinotopy of the region. There are both similarities and differences in the organization of extrastriate areas in ferret and other species.
Architectonics of Visual Areas in Cats and Ferrets Difficulties parcellating the occipital cortex of cat using cyto-architecture are documented by the varying descriptions and localization of fields (Gurewitsch and Chatschaturian, 1928; Otsuka and Hassler, 1962; Sanides and Hoffman, 1967). The greatest difficulties were in the identification of areas 19 and 21. These were redefined by Heath and Jones (Heath and Jones, 1971), who relied upon connectional criteria to localize areas 19 and 21. We have used multiple anatomical criteria to distinguish areas 17, 18, 19 and 21 of the ferret. The differences, sometimes subtle, are consistent, and allow identification of area borders with uncertainties of <200µm.
The architectonic features of area 17 of the ferret resemble those of the cat (Rockland, 1985). In the ferret, the 17/18 border
is characterized by a thinning of layer 4, and a thickening and sublamination of layer 3, which also acquires numerous medium-sized pyramidal cells (the origin of the callosal projections). The transition is further evidenced by a thickening of the layer 4 CO band that extends into layer 3 and acquires an indistinct upper boundary (Rockland, 1985). Similar features were described for the 17/18transition in the cat (Gurewitsch and Chatschaturian, 1928; Otsuka and Hassler, 1962; Sanides and Hoffmann, 1967; Price, 1985). The 18/19 transition in the ferret is characterized by a further thinning of layer 4 and near-absent CO reactivity, as in the cat (Gurewitsch and Chatschaturian, 1928; Sanides and Hoffmann, 1967; Price, 1985).
The myelinated striae of Baillarger, which are used as areal landmarks in the cat and the monkey, were not prominent. The 18/19 transition was characterized by a substantial decrease in myelination, as in the cat (Otsuka and Hassler, 1962). In the cat, differences in the cytoarchitecture of layer 6 between areas 17, 18and 19 (Otsuka and Hassler, 1962), and in myelination between areas 18 and 19 (Otsuka and Hassler, 1962; Sanides and Hoffmann, 1967), are in part compatible with those reported here. As in the ferret, layer 6 in area 19 of the cat does not show the same orderly lay out of neuronal palisades as area 17 (Otsuka and Hassler, 1962).
The cytoarchitectonic descriptions of cat area 21 are scant and insufficiently detailed and/or contradictory, as mentioned by Heath and Jones (Heath and Jones, 1971). Our description of the ferret concurs with that of Gurewitsch and Chatschaturian (Gurewitsch and Chatschaturian, 1928), who report area 21 as having a thin, distinct layer 4 and larger pyramidal cells in the infragranular than the supragranular layers. According to these
Figure 9. Distribution of callosally projecting neurons (A) and terminals (B) in semi-flattened sections. The location of injection sites in the contralateral hemisphere is shown in (C).
authors, cat area 21 appears to extend further rostrally than ferret area 21.
The Visual Callosal Connections of the Ferret
The interhemisperic projections we described probably course through the corpus callosum, not the anterior commissure. The connections of the anterior commissure in the cat (Jouandet, 1982) occupy the ventral half of the hemisphere up to the middle and posterior ectosylvian gyri. The lateral and the suprasylvian gyri are interconnected via the corpus callosum. The origin of the anterior commissure is not known in the ferret, thus we consider ‘callosal’ and ‘interhemispheric’ to be synonymous.
For the ferret, as in all species, the majority of callosal neurons are pyramidal cells, although, as in the cat, a few spiny stellate cells are found in layer 4 and polymorphic neurons in layer 6 (Innocenti, 1980, 1986). The callosal neurons occupy two laminae, supragranular and infragranular, separated by a lamina with few or no projecting neurons (Rockland, 1985; Grigonis et al., 1992). With tracer injections limited to areas 17, 18and 19, the relative contribution of the infragranular layers to callosal projections increases rostrally, in area 21 and the suprasylvian region. This may be because mainly heterotopic feedback projections were labeled in the rostral areas, as reported for the cat (Shatz, 1977; Innocenti, 1980; Keller and Innocenti, 1981).
One important difference from cats is that in ferrets, callosally projecting neurons of infragranular layers predominate numeric-ally in all areas, and occupy more of areas 18and 19. This distribution is reminiscent of the rat (Olavarria and Van Sluyters, 1985). This difference might be related to the more lateral location of the eyes in the ferret and rat as compared with the cat.
The absence of serial section reconstructions in the studies of Rockland and Grigonis et al. (Rockland, 1985; Grigonis et al., 1992) did not allow appreciation of the overall distribution of callosal connections. We found that the tangential distribution of callosal connections in the ferret resembles that of the cat, where the 17/18border projects callosally, while the rest of area 17, and islands of areas 18and 19, are acallosal. This close relation-ship between callosal connections and the 17/18border is common to all species, including the rhesus monkey (Van Essen and Zeki, 1978) [reviewed by Innocenti (Innocenti, 1986)]. Nevertheless, the qualitative impression is that there are fewer callosally projecting neurons in ferret area 17 than in cat, the majority being in area 18. As in the cat, acallosal islands in areas 18and 19 alternate with regions traversed by callosal bridges; the bridges merge with another major callosal band that corres-ponds to the 19/21 border. The size and location of the acallosal islands, and of the callosal bridges, vary somewhat across cases. Furthermore, the callosal band corresponding to the 19/21 border varies in length and is often discontinuous. Variability in the pattern of callosal connections has been observed before (Olavarria and Van Sluyters, 1995). It probably ref lects true individual differences as the topography of callosal connections matches that of the visual field representation, which is also individually variable (Manger et al., 2002). Presumably, such individual variability of callosal connections is a consequence of their exuberance and modifiability in ontogenesis (Innocenti, 1995).
That callosal connections are more dense in area 18than in area 17 suggests that they may be particularly strong in regions receiving input from the ipsilateral eye, which is represented in posterior area 18(Fig. 4) (White et al., 1999). This seems in keeping with a strong involvement of callosal input in the responses to the ipsilateral eye. In the ferret, the callosum might
contribute to binocular responses in regions where dLGN input is predominantly from the ipsilateral eye.
In most species, the callosal connections correspond to the representation of visual field locations near the vertical meridian, with visual field periphery acallosal [reviewed by Innocenti, and Payne and Sivek (Innocenti, 1986; Payne and Sivek, 1991)]. Thus, the callosality or acallosality of a cortical site may predict its retinotopy. In most species, the borders between visual areas often correspond to reversals of retinotopic maps around the vertical meridian or periphery of the visual field. The callosal connections of the ferret predict reversals in the visual field representation around the vertical meridian at the 17/18and 19/21 borders, and around the band in the depth of the supra-sylvian sulcus. Two other reversals around the peripheral visual field representation should occur at the 18/19 border and the anterior border of area 21, which correspond to the acallosal islands.
The alternation of acallosal islands and callosal bridges in areas 18, 19 and 21, and the relation between callosal connections and retinotopy, suggest that the visual field is represented in a complex way in extrastriate areas. Many of the above predictions were met in combined anatomical and electrophysiological experiments (Manger et al., 2002), where we found that the acallosal islands are indicative of regions of peripheral visual field representation embedded into areas of expanded repre-sentation of the central visual field.
Notes
Supported by the Swiss National Science Foundation (Grant PNR38, no. 4038-043990) and by the Swedish Medical Research Foundation (Grant no. 12549). We wish to thank Laurence Grollimund and Jenny Hedin for the high quality of their histological work, and Daniel Kiper for having participated in the tracing experiments.
Address correspondence to Giorgio M. Innocenti, Department of Neuroscience, Division of Neuroanatomy and Brain Development, Karolinska Institutet, Retzius väg 8, S-17177, Stockholm, Sweden. Email: giorgio.innocenti@neuro.ki.se.
References
Carroll EW, Wong-R iley MTT (1984) Quantitative light and electron microscopic analysis of cytochrome oxidase-rich zones in the striate cortex of the squirrel monkey. J Comp Neurol 222:1–17.
Chalupa LM, Snider CJ (1998) Topographic specificity in the retinocollicular projection of the developing ferret: an anterograde tracing study. J Comp Neurol 392:35–47.
Chapman B, Bonhoeffer T (1998) Overrepresentation of horizontal and vertical orientation preferences in developing ferret area 17. Proc Natl Acad Sci USA 95:2609–2614.
Chapman B, Stryker MP, Bonhoeffer T (1996) Development of orientation preference maps in ferret primar y visual cortex. J Neurosci 16: 6443–6453.
Clancy B, Darlington RB, Finlay BL (2001) Translating time across mammalian species. Neuroscience 105:7–17.
Cramer KS, Angelucci A, Hahm J-O, Bogdanov MB, Sur M (1996) A role for nitric oxide in the development of the ferret retinogeniculate projection. J Neurosci 16:7995–8004.
Dehay C, Kennedy H, Meissirel C (1980) A transient pathway inter-connecting the cerebral hemispheres via the anterior commissure in the neonatal ferret. J Physiol 400:45P.
Dreher B, Wang C, Turleski KJ, Djavadian RL, Burke W (1996) Areas PMLS and 21a of cat visual cortex: two functionally distinct areas. Cereb Cortex 6:585–599.
Gallyas F (1979) Silver staining of myelin by means of physical develop-ment. Neurol Res 1:203–209.
Glaser EM, Tagamets M, McMullen NT, Van der Loos H (1983) The image-combining computer microscope — an interactive instrument for morphometry of the nervous system. J Neurosci Methods 8:17–32. Grigonis A M, Rayos RB, Del Sol-Padua, Murphy EH (1992) Visual callosal
Gurewitsch M, Chatschaturian A (1928) Zur cytoarchitektonik der großhirnrinde der feliden. J Psychol Neurol 35:283–312.
Heath CJ, Jones EG (1971) The anatomical organization of the supra-sylvian gyrus of the cat. Ergebn Anat Entw Gesch 45:1–64.
Houzel J-C, Milleret C, Innocenti G (1994) Morphology of callosal axons interconnecting areas 17 and 18 of the cat. Eur J Neurosci 6:898–917. Hubel DH, Wiesel TN (1965) Receptive fields and functional architecture in two non-striate visual areas (18and, 19) of the cat. J Neurophysiol 28:229–289.
Hubel DH, Wiesel TN (1969) Visual area of the lateral suprasylvian gyrus (Clare-Bishop area) of the cat. J Physiol 202:251–260.
Innocenti GM (1980) The primar y visual pathway through the corpus callosum: morphological and functional aspects in the cat. Arch Ital Biol 118:124–188.
Innocenti GM (1986) General organization of callosal connections in the cerebral cortex. In: Cerebral cortex, vol. 5. Sensor y-motor areas and aspects of cortical connectivity (Jones EG, Peters A, eds), pp. 291–353. New York: Plenum Press.
Innocenti GM (1995) Exuberant development of connections, and its possible permissive role in cortical evolution. Trends Neurosci 18:397–402.
Innocenti GM, Fiore L, Caminiti R (1977) Exuberant projection into the corpus callosum from the visual cortex of newborn cats. Neurosci Lett 4:237–242.
Jouandet ML (1982) Neocortical and basal telencephalic origins of the anterior commissure of the cat. Neuroscience 7:1731–1752. Keller G, Innocenti GM (1981) Callosal connections of suprasylvian visual
areas in the cat. Neuroscience 6:703–712.
Law MI, Zahs KR, Str yker MP (1988) Organization of primar y visual cortex (area 17) in the ferret. J Comp Neurol 278:157–180.
Linden DC, Guillery RW, Cucchiaro J (1981) The dorsal lateral geniculate nucleus of the normal ferret and its postnatal development. J Comp Neurol 203:189–211.
Manger PR, Kiper D, Masiello I, Murillo L, Tettoni L, Hunyadi Z, Innocenti GM (2002) The representation of the visual field in three extra-striate areas of the ferret (Mustela putorius) and the relationship of retinotopy and field boundaries to callosal connectivity. Cereb Cortex 12:423–437.
McConnell SK (1985) Migration and differentiation of cerebral cortical neurons after transplantation into the brains of ferrets. Science 229: 1268–1271.
Mesulam M-M, Brushart TM (1979) Transganglionic and anterograde transport of horseradish peroxidase across dorsal root ganglia: a tetramethylbenzidine method for tracing central sensory connections of muscles and peripheral nerves. Neuroscience 4:1107–1117. O’Leary DDM, Schlaggar BL, Tuttle R (1994) Specification of neocortical
areas and thalamocortical connections. A nnu Rev Neurosci 17: 419–439.
Olavarria J, Van Sluyters RC (1985) Organization and postnatal development of callosal connections in the visual cortex of the rat. J Comp Neurol 239:1–26.
Olavarria J, Van Sluyters RC (1995) Overall pattern of callosal connections in visual cortex of normal and enucleated cats. J Comp Neurol 363:161–176.
Otsuka R, Hassler R (1962) Über aufbau und gliederung der corticalen sehsphäre bei der katze. Arc Psychiat Zeitschrift Neurol 203:212–234. Pallas SL, Littman T, Moore DR (1999) Cross-modal reorganization of callosal connectivity without altering thalamocortical projections. Proc Natl Acad Sci USA 96: 8751–8756.
Palmer LA, Rosenquist AC, Tusa RJ (1978) The retinotopic organization of lateral suprasylvian visual areas in the cat. J Comp Neurol 177: 237–256.
Payne BR (1993) Evidence for visual cortical area homologs in cat and macaque monkey. Cereb Cortex 3:1–25.
Payne BR, Siwek DF (1991) Visual-field map in the callosal recipient zone at the border between areas 17 and 18in the cat. Visual Neurosci 7:221–236.
Price DJ (1985) Patterns of cytochrome oxidase activity in areas 17, 18and 19 of the visual cortex of cats and kittens. Exp Brain Res 58:125–133.
Ragsdale CW, Grove EA (2001) Patterning the mammalian cerebral cortex. Curr Opin Neurobiol 11:50–58.
Rakic P (1988) Specification of cerebral cortical areas. Science 241: 170–176.
Redies C, Diksic M, R imi H (1990) Functional organization in the ferret visual cortex: a double-label 2-deoxyglucose study. J Neurosci 10:2791–2803.
Rock land KS (1985) A natomical organization of primar y visual cortex (area 17) in the ferret. J Comp Neurol 241:225–236.
Sanides F, Hoffmann J (1967) Cyto- and myeloarchitecture of the visual cortex of the cat and the surrounding integration cortices. J Hirnforsch 1:79–104.
Shatz CJ (1977) Anatomy of interhemispheric connections in the visual system of Boston Siamese and ordinar y cats. J Comp Neurol 173: 497–518.
Sherk H (1986) Location and connections of visual cortical areas in the cat’s suprasylvian sulcus. J Comp Neurol 247:1–31.
Tusa RJ, Palmer LA (1980) Retinotopic organization of areas 20 and 21 in the cat. J Comp Neurol 193:147–164.
Tusa RJ, Rosenquist AC, Palmer LA (1979) Retinotopic organization of areas 18 and 19 in the cat. J Comp Neurol 185:657–678.
Updyke BV (1986) Retinotopic organization within the cat’s posterior suprasylvian sulcus and gyrus. J Comp Neurol 246:265–280. Van Essen DC, Zeki SM (1978) The topographic organization of rhesus
monkey prestriate cortex. J Physiol 277:193–226.
Welker W (1990) Why does the cerebral cortex fissure and fold? A review of determinants of gyri and sulci. In: Cerebral cortex, vol. 8B. Comparative structure and evolution of cerebral cortex, part II (Jones EG, Peters A, eds), pp. 3–138. New York: Plenum Press.
White LE, Bosking WH, Williams SM, Fitzpatrick D (1999) Maps of central visual space in ferret V1 and V2 lack matching input from the two eyes. J Neurosci 19:7089–7099.