HAL Id: hal-00301283
https://hal.archives-ouvertes.fr/hal-00301283
Submitted on 4 Jun 2004HAL is a multi-disciplinary open access
archive for the deposit and dissemination of sci-entific research documents, whether they are pub-lished or not. The documents may come from teaching and research institutions in France or abroad, or from public or private research centers.
L’archive ouverte pluridisciplinaire HAL, est destinée au dépôt et à la diffusion de documents scientifiques de niveau recherche, publiés ou non, émanant des établissements d’enseignement et de recherche français ou étrangers, des laboratoires publics ou privés.
Noctilucent clouds and the mesospheric water vapour:
the past decade
U. von Zahn, U. Berger, J. Fiedler, P. Hartogh
To cite this version:
U. von Zahn, U. Berger, J. Fiedler, P. Hartogh. Noctilucent clouds and the mesospheric water vapour: the past decade. Atmospheric Chemistry and Physics Discussions, European Geosciences Union, 2004, 4 (3), pp.3045-3076. �hal-00301283�
ACPD
4, 3045–3076, 2004Noctilucent clouds and the mesospheric
water vapour
U. von Zahn et al.
Title Page Abstract Introduction Conclusions References Tables Figures J I J I Back Close
Full Screen / Esc
Print Version Interactive Discussion
© EGU 2004
Atmos. Chem. Phys. Discuss., 4, 3045–3076, 2004 www.atmos-chem-phys.org/acpd/4/3045/
SRef-ID: 1680-7375/acpd/2004-4-3045 © European Geosciences Union 2004
Atmospheric Chemistry and Physics Discussions
Noctilucent clouds and the mesospheric
water vapour: the past decade
U. von Zahn1, U. Berger1, J. Fiedler1, and P. Hartogh2
1
Leibniz-Institute of Atmospheric Physics, K ¨uhlungsborn, Germany
2
Max-Planck-Institute for Aeronomy, Katlenburg-Lindau, Germany
Received: 13 April 2004 – Accepted: 24 May 2004 – Published: 4 June 2004 Correspondence to: U. von Zahn ([email protected])
ACPD
4, 3045–3076, 2004Noctilucent clouds and the mesospheric
water vapour
U. von Zahn et al.
Title Page Abstract Introduction Conclusions References Tables Figures J I J I Back Close
Full Screen / Esc
Print Version Interactive Discussion
© EGU 2004
Abstract
The topic of this paper is the expected (from modelling) and observed sensitivity of the brightness β of noctilucent clouds (NLC) on the ambient water vapour mixing ra-tio f (H2O). Firstly, we show that state-of-the-art models of NLC layer formation predict that in the Arctic summer, a 10% increase of f (H2O) in the upper mesosphere should
5
lead to a 22% increase in β. Secondly, we review observations of episodic changes in f (H2O) and those in β, the former being available since 1992, the latter since 1979. We also add a new series of observations of f (H2O) in the Arctic summer, performed at the ALOMAR observatory (69◦N). Thirdly, we show that an increase in daily aver-aged f (H2O) observed in the Arctic summer since 1996, when introduced into the NLC
10
models, comes close to explaining the observed increase in β. In contrast to this grati-fying situation for the summer means of f (H2O) and β (the latter being available only in summer anyway), the behaviour of annual means of f (H2O) is quite different. Those in-dicate that since 1996 significant decreases of annually averaged upper mesospheric water vapour have occurred at low, mid, and high latitude which can not be used to
15
explain the observed near-stability in NLC brightness over this time period. We close with comments on the very different character of decadal variations in NLC brightness and occurrence rate.
1. Introduction
The brightness of noctilucent clouds (NLC) is observed to exhibit variability on time
20
scales which range at least from minutes to centuries. For the following, we consider in particular variations with interannual and decadal time scales (to our knowledge, there exists no generally accepted definition of a “long term” time scale). These variations involve both increases and decreases of NLC parameters and those need be neither linear with time nor periodic. They may be best described as “episodic” in character
25
ACPD
4, 3045–3076, 2004Noctilucent clouds and the mesospheric
water vapour
U. von Zahn et al.
Title Page Abstract Introduction Conclusions References Tables Figures J I J I Back Close
Full Screen / Esc
Print Version Interactive Discussion
© EGU 2004
clouds (PMC) to be the same geophysical phenomenon.
Our current theoretical understanding of the microphysics and life cycle of NLC par-ticles makes us believe that the brightness β of a NLC layer is primarily controlled by the ambient temperature T and the partial water vapour pressure p(H2O) to which the layer is exposed. As regards temperature changes, L ¨ubken (2000) has shown that at
5
69◦N no changes of temperatures T on decadal time scales are so far detectable in the mesosphere (“zero trend”). Against this background, it has become common practice to make the following assumption (e.g. Thomas et al., 1989, 2003): Episodic changes of NLC brightness are produced exclusively by changes in the water vapour mixing ratio in the mesopause region. The point to be made in the current paper is, however,
10
that over the past 7 years the average brightness of NLCs as observed by one set of satellite-borne instruments in the Northern hemisphere has shown hardly any signifi-cant change while during the same period a signifisignifi-cant decrease of upper mesosphere water vapour abundances has occurred. The latter statement needs an important qual-ification, though. The observational results on upper mesospheric water vapour have
15
been published so far exclusively as annual or sliding means over all data available. Here we will show, however, that if means for separate seasons are considered, the picture changes remarkably. We evaluate in particular the data on water vapour in the summer Arctic which in fact show increases of water vapour as long as the observation series exist. This allows for the first time to reconcile observed episodic changes of
20
NLC brightness and water vapour in the NLC region with our model predictions of NLC brightness.
To make the discussion of this scenario as quantitative as possible, we will take the following approach:
– In a first step, we will take a look at the results of 3-d and 2-d models on the
25
dependence of NLC brightness β on the ambient H2O mixing ratio f (H2O).
– The second step is to briefly review the results of observations of the H2O mixing ratio f (H2O) in the upper mesosphere and of the NLC brightness β.
ACPD
4, 3045–3076, 2004Noctilucent clouds and the mesospheric
water vapour
U. von Zahn et al.
Title Page Abstract Introduction Conclusions References Tables Figures J I J I Back Close
Full Screen / Esc
Print Version Interactive Discussion
© EGU 2004
– In a third step, we will compare two types of NLC values: On the one hand,
β-values which have been observed by satellite-borne instruments and on the other hand, β-values which are predicted by model calculations based on observed
f (H2O)-values. This comparison will lead us to the conclusion already briefly drawn above.
5
Finally, we will tender an explanation for the initially surprising fact that the decadal variations of the NLC albedo (brightness) and of the NLC occurrence rate each exhibit very different characters.
2. Modelling
Various aeronomic parameters are in use to quantify the instantaneous brightness of
10
a NLC layer. For ground-based visual observers, the brightness of a NLC has always been an elusive parameter which was characterized at times by sampling into a number of pre-defined categories or brightness classes (e.g. Romejko et al., 2003). In the case of ground-based lidar soundings, the brightness of a NLC is measured by its absolute volume backscatter coefficient and/or the backscatter ratio at the peak of the
15
NLC layer (Fiedler et al., 2003; Thayer et al., 2003; Chu et al., 2003). In the case of satellite-based NLC observations, the scattering geometries are more complex and the sample volumes much less defined than in case of ground-based lidar soundings of NLC. In the analysis of satellite data, a number of different parameters has been used for quantifying the brightness of a NLC layer. Examples are the slant radiance
20
and vertical optical depth (Donahue et al., 1972), maximum directional albedo (Jensen and Thomas, 1988), integrated directional albedo (Thomas et al., 1991; DeLand et al., 2003; Shettle et al., 2003), volume emission rates in the mid-IR (O’Neil et al., 2001), or the limb scatter ratio (Merkel et al., 2003).
Our expectations on how the brightness of NLC should vary with changes of the
mix-25
ACPD
4, 3045–3076, 2004Noctilucent clouds and the mesospheric
water vapour
U. von Zahn et al.
Title Page Abstract Introduction Conclusions References Tables Figures J I J I Back Close
Full Screen / Esc
Print Version Interactive Discussion
© EGU 2004
models of the life cycle of NLC particles. For model calculations, the clean backscatter geometry and the precise definition of the sample distance and the sample volume of active lidar soundings make lidar data ideal for robust numerical simulations. It is for these reasons that the absolute volume backscatter coefficient β and the backscatter ratio (BSR) at the peak of the NLC layer are calculated in case of the COMMA/IAP
5
model (Berger and von Zahn, 2002; von Zahn and Berger, 2003a) and the CARMA model (Rapp et al., 2002), respectively. Either one of these parameters should repre-sent very well the “brightness” of NLC layers and we will use them here synonymously for NLC layer brightness.
Concerning the description of water vapour abundances, we note that phase
10
changes of water vapour to ice, such as occurring at the surfaces of NLC particles, depend basically on the partial pressure p(H2O). Yet, mixing ratios f (H2O) are “trans-portable” in chemistry-transport models and they are much less altitude dependent than partial pressures. It is for those reasons that here we will deal primarily with mixing ratios f (H2O). We do so under the assumption that the ambient densities and
15
temperatures, which are required for the conversion from f (H2O) to p(H2O) and vice versa, are reasonably well established.
The COMMA/IAP model is a 3-dim GCM optimized for studies of NLC aeronomy. It has been described in detail by Berger and von Zahn (2002) and von Zahn and Berger (2003a). It uses Lagrangian transport of individual dust and icy particles on
20
trajectories (multiple particle system with 20 million individual particles) to evaluate the formation, transport and sublimation of NLC particles and layers. Dust and icy particles are modelled in the latitude range from 50◦N to 90◦N and altitude range from 78 to 94 km. Condensation nuclei are presumed to exist in altitude and size distributions according to the model of Hunten et al. (1980).
25
Using the COMMA/IAP model, we have studied the sensitivity of the volume backscatter coefficients β at the peak of NLC layers on the mixing ratio of ambient water vapour f (H2O). To this end, we have calculated the (zonally averaged) profiles of
cal-ACPD
4, 3045–3076, 2004Noctilucent clouds and the mesospheric
water vapour
U. von Zahn et al.
Title Page Abstract Introduction Conclusions References Tables Figures J I J I Back Close
Full Screen / Esc
Print Version Interactive Discussion
© EGU 2004
culation of the NLC layer with our standard H2O profiles for 21 June as shown in Fig. 4a of von Zahn and Berger (2003a). With the COMMA/IAP model we follow the develop-ment of the NLC layer and its interaction with the upper mesosphere water vapour from the time of initialization up to+5 days. At that time, the water vapour distribution has developed as shown in Fig. 9a of von Zahn and Berger (2003a) and the profile of the
5
volume backscatter coefficient β(z) has stabilized its shape and absolute value βmax at the peak of the layer. For the latitude of 69◦N and wavelength of 532 nm, β(z) is shown in blue in Fig. 1. We then repeat these calculations for three cases in which the initial H2O profiles are chosen 1.25, 1.5, and 2.0 times larger than our standard H2O profile. These calculations, also carried forward to day+5, yield the black, green, and
10
red profiles of Fig. 1, respectively. From these profiles, we obtain βmax=1.2, 2.6, 4.4, and 8.0×10⁻¹⁰[m−1sr−1] for ×1, ×1.25, ×1.5, and ×2.0 water vapour, respectively. We add, that “×2 water vapor” implies close to 9 ppmv of initial water vapor at 80 km and 69◦N which we consider to be on the high side of possible H2O mixing ratios under these conditions.
15
For fitting our model results, we assume a dependence of NLC brightness on the ambient water vapour in the form βmax=const f (H2O)ε. For a wavelength of 532 nm and in the range of many lidar-observed NLCs (i.e. βmax=4 to 10×10−10 [m−1sr−1]), our COMMA/IAP results indicate a ε∼2.1. This is equivalent to saying that any 10% increase of f (H2O) induces a 22% increase of βmax. The model result also
sup-20
ports Jensen and Thomas (1988) who just used scaling arguments to deduce that
βmax=const f (H2O)2should hold under strong freeze drying conditions.
The CARMA model is a 2-dim model that uses Eulerian transport of classes of dust and icy particles on a grid (classical volume-method). The size distribution of the con-densation nuclei is calculated within the model with assumptions made about the flux of
25
extraterrestrial matter into the upper atmosphere. In the work of Thomas et al. (2003) a 1-dim version is applied to conditions on the latitude circle 68◦N. The authors studied the sensitivity of the back scattering ratio BSR at the peak of NLC layers on the mix-ing ratio of ambient water vapour f (H2O). For ambient conditions of Tmesopause=129 K
ACPD
4, 3045–3076, 2004Noctilucent clouds and the mesospheric
water vapour
U. von Zahn et al.
Title Page Abstract Introduction Conclusions References Tables Figures J I J I Back Close
Full Screen / Esc
Print Version Interactive Discussion
© EGU 2004
and f (H2O)80 km=5 ppm, their model predicts also a 22% increase of BSR for any 10% increase of f (H2O).
Despite some moderate differences in the modelling approaches used in these two models, we obtain close agreement in their predictions concerning changes of NLC brightness under the influence of changes in ambient water vapour. It is this result
5
which lends itself to a quantitative test through observations. To this end, we will review in the following two sections first available observations of the water vapour in the upper mesosphere and thereafter those of observed NLC brightness. Combining these two sets of observations allows us to calculate an observed sensitivity of NLC brightness versus changes in water vapour abundance and to compare it with the model-derived
10
sensitivity.
We assume in the following chapters that it is appropriate to compare the results of the above model analysis for backscattering at 532 nm with the SBUV integrated directional albedo values derived from 252 nm observations at a variety of scattering angles. Our principal justification for this procedure is based on the fact that it is the
15
sign (!) of the observed changes with time which matter most for our discussion and not so much the exact absolute value. We do not expect that a more detailed analysis of the SBUV observation geometry will change the sign of the derived episodic changes.
3. Measurements of mesospheric water vapour
For this study it would be best if it could be based on decades-long and accurate
20
observations of the H2O mixing ratio f in the NLC region. The latter we wish to define as the region between 80 and 85 km at polar latitudes (poleward of 67◦) in mid-summer. Yet, no such measurements have been published so far. Consequently, we base this study on two types of H2O observations which miss out on only one of the above conditions: (1) Observations of the H2O mixing ratio f in the NLC region, yet of only 5
25
years duration and (2) a decade long series of H2O observations, yet only at mid and low latitudes.
ACPD
4, 3045–3076, 2004Noctilucent clouds and the mesospheric
water vapour
U. von Zahn et al.
Title Page Abstract Introduction Conclusions References Tables Figures J I J I Back Close
Full Screen / Esc
Print Version Interactive Discussion
© EGU 2004
For our purposes the most useful information comes from the observations by the ground-based ALOMAR microwave spectrometer of Hartogh et al. (2001) (see also Table 1, data set #1). Being located in the Arctic at 69.3◦N, the instrument looks at 18◦ elevation towards the South (Hartogh and Jarchow, 1995). It thus samples the upper mesosphere close to 67◦N. It went into operations in 1995 and summer data are
5
available starting with the summer of 1996.
Further information comes from satellite-borne solar occultation limb soundings at 6.6 µm (HALOE instrument onboard the UARS satellite) and ground-based microwave spectrometry at 22 GHz (two more instruments at mid and low latitudes) which in Ta-ble 1 we call data set #2.1 through #2.3. For the northern hemisphere, the data records
10
of these instruments started in 1992. Their strength is the longer observation period as compared with the Arctic data set #1. Their shortcoming is the latitude coverage: Data set #2.1 reaches only barely into the Arctic and results on episodic changes in water vapour have been published so far only up to 55◦N; Data sets #2.2 and #2.3 do not monitor Arctic conditions at all.
15
As regards data set #1, Hartogh et al. (2001) have previously published their anal-ysis of interannual variations of the mesospheric water vapour at ALOMAR. They retrieved water vapour mixing ratios f (H2O) for the time period late 1995 until mid-2001. Their highest altitude band was centered at 77.5 km, for which altitude Har-togh et al. (2001) found a significant decrease of upper mesosphere water vapour by
20
−0.045±0.006 ppmv/year (see Table 2). We emphasize, though, that this result was derived from a fit to all observations, regardless of their sampling season. Here we now allow in addition for the possibility that the episodic changes of f (H2O) might be different in summer and winter. To test this hypothesis, we have studied the 80 km data of the ALOMAR microwave spectrometer for the periods of only June through August
25
of the years 1996 through 2000. These are shown in Fig. 2, in which each data point is a 24-h mean. The dashed line marks the mean H2O mixing ratio as observed in the summer 1996, the short black lines indicate a linear regression for all data points shown. We choose the analysis altitude to be 80 km, in this way coming closer to the
ACPD
4, 3045–3076, 2004Noctilucent clouds and the mesospheric
water vapour
U. von Zahn et al.
Title Page Abstract Introduction Conclusions References Tables Figures J I J I Back Close
Full Screen / Esc
Print Version Interactive Discussion
© EGU 2004
NLC region than before. We performed a linear regression of the data for the summers 1996 through 2000 and separately for 1997 through 2000 which yield changes of water vapour mixing ratio f (H2O) by +0.05±0.01 ppmv/year and +0.017±0.016 ppmv/year, respectively (Table 2). Most notably, for the summer periods these episodic changes are positive and thus differ not only in magnitude, but also in sign from the changes
5
derived for the same location, but from annual means. We also note that including the summer 1996 data yields a somewhat larger episodic increase than in the case that we exclude those data.
The HALOE observations of upper mesosphere water vapour (data set #2.1) have been treated by a number of authors. As regards studies of long term changes, the
10
most recent studies are those of Randel et al. (2000) and Marsh et al. (2003), but both are based on complete annual means, not seasonally separated data samples. In Fig. 5 of Randel et al. (2000), H2O trends are shown for latitudes ≤55◦ and altitudes ≤78 km. For the time period 1995–1999, the episodic changes of f (H2O) are negative above 70 km and at all latitudes shown. The results are, however, statistically significant
15
in only a portion of this region. In the paper of Marsh et al. (2003), the most northerly region studied is the latitude band 35◦N±17.5◦. For this latitude band, Marsh et al. show in their Fig. 3 monthly means of water vapour at 0.011 hPa (∼80 km) which again exhibit a decrease of f (H2O) since the mid-1990s. We need to emphasize, though, that neither study addresses the question of trends at high or polar latitudes.
20
HALOE observations at high latitudes have been analysed by McHugh et al. (2003) and Hervig et al. (2003). Both teams expanded their studies to latitudes of up to 70◦N and altitudes of up to 88 km. Yet all their results are based on averages over the period 1992–2002 and no information on interannual or episodic variations is given in these papers.
25
At low latitudes, mesospheric water vapour has been obtained also from ground-based microwave spectrometers located at 20◦N and 34◦N (Table 1). Nedoluha et al. (2003) analysed water vapour measurements performed at and close to 20◦N from 1997 to 2002 by both their ground-based microwave spectrometer and the HALOE
ACPD
4, 3045–3076, 2004Noctilucent clouds and the mesospheric
water vapour
U. von Zahn et al.
Title Page Abstract Introduction Conclusions References Tables Figures J I J I Back Close
Full Screen / Esc
Print Version Interactive Discussion
© EGU 2004
instrument. Their trend analysis is again based on their entire data sets (not season-ally separated). Nedoluha et al. (2003) obtain for 70 km altitude changes of f (H2O) by −0.108 ppmv/year and −0.163 ppmv/year from the microwave spectrometer and HALOE observations, respectively. Hence, from 1997 to 2002 the upper mesosphere at 20◦N lost, say, 0.136 ppmv×5∼0.7 ppmv or 12% of its total water content. This
sce-5
nario of significantly decreasing water mixing ratios is clearly much different in charac-ter from that which we deduce for the Arctic ALOMAR site in summer. We remind the reader, though, that the decreases of water vapour at low and mid latitudes are derived from the linear term of a least squares fit to the entire data set, whereas the increases of water vapour at an Arctic latitudes comes from only summer months data. The data
10
points for f (H2O) as presented in Fig. 3 of Nedoluha et al. (2003) make it amply clear that also at 20◦N latitude, a large annual variation of the water mixing ratio at 70 km altitude is indicated in both the HALOE and microwave data. But different from the Arctic latitudes, at 20◦N even the summer values of f (H2O) show a significant negative trend.
15
Do the observed changes of upper mesosphere water vapour since 1996 represent a “long term trend”? Certainly not. This is because during the period 1992 to 1996 and at 34◦N, water at 70 km altitude increased rapidly at a rate of 0.2 ppmv/year as indicated in Table 2 and discussed in detail by Nedoluha et al. (1998). This dramatic increase of upper mesospheric water vapour by about 1 ppmv (∼20%) over 5 years was seen
20
by both ground-based and satellite-borne instruments. Hence, the decade between 1992 and 2002 is characterized by first a strong increase and then a somewhat more moderate decrease of the H2O mixing ratio in the upper mesosphere at low and mid latitudes. These episodic variations can not be adequately described by a constant trend.
25
Recalling Table 2, we summarize these results as follows: At low and mid latitudes, the upper mesospheric water vapour has dramatically increased from 1992 to 1996 and decreases slowly since. At the one station available in the Arctic, the upper meso-spheric water vapour has also gone down since 1995, provided we base this analysis
ACPD
4, 3045–3076, 2004Noctilucent clouds and the mesospheric
water vapour
U. von Zahn et al.
Title Page Abstract Introduction Conclusions References Tables Figures J I J I Back Close
Full Screen / Esc
Print Version Interactive Discussion
© EGU 2004
on annual means. If we study in the Arctic, however, only the three summer months of June through August, then the upper mesospheric water vapour is found to be on a slow rise since this observation series started in summer of 1996. So far, there are little more than speculations about the reasons for the drastic change of the H2O trend in the mid-1990s. Concerning the increase of water vapour in the Arctic summer, we
5
will add a few comments in Sect. 6.
4. Measurements of NLC albedo
The second type of observations that we are to discuss is that of NLC measurements as performed by satellite-borne, nadir-pointing Solar Backscattered Ultraviolet (SBUV) instruments. These instruments detect NLC in the wavelength band 252 to 292 nm.
10
Since 1978 there have been six different SBUV instruments which have provided NLC observations with at least one, but usually more than one season of overlap between successive instruments. This record now extends over 24 summer seasons in the northern hemisphere. Details of this unique long term record of NLC parameters were recently reported by DeLand et al. (2003) who focus their analysis on the occurrence
15
rate and by Shettle et al. (2003) who focus on the albedo β of NLCs. We note for the reader that only Shettle et al. (2003) include in their analysis also the data of the SBUV instrument aboard the NOAA-17 satellite (launched in 2002). This is one of the reasons why the episodic changes of NLC parameters derived in the two papers need not be the same.
20
Shettle et al. (2003) calculate the annually averaged NLC albedo β for each NLC season 1979 through 2002 and each satellite as numerical average of the residual albedo of all clouds that exceed the albedo detection threshold of 7×10⁻⁶. They fit the albedo values β by an expression which is linear in time and the solar
Lyman-α flux plus a constant. The term of the fit, which is linear in time (=“secular” term),
25
yields for the Northern hemisphere an NLC albedo increase of+0.3%/year. Shettle et al. (2003) state: ”These trends are much larger than the standard deviations and are
ACPD
4, 3045–3076, 2004Noctilucent clouds and the mesospheric
water vapour
U. von Zahn et al.
Title Page Abstract Introduction Conclusions References Tables Figures J I J I Back Close
Full Screen / Esc
Print Version Interactive Discussion
© EGU 2004
highly significant for the 24+ year time period used here”.
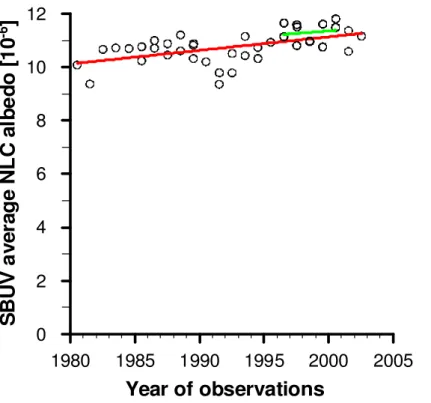
Thomas et al. (2003) also performed an analysis of the same SBUV data as used by Shettle et al. (2003), but using an analysis method different from that of Shettle et al. (2003). Hence, the albedo values β in Fig. 6a of Thomas et al. (2003) turn out slightly different from those in Fig. 1 of Shettle et al. (2003). Here we show in Fig. 3
5
the SBUV albedo values β as taken from Fig. 6a of Thomas et al. (2003). We add the zero line and our own regression line (in red) to the data points. The latter turns out very similar to the secular term of Thomas et al. (2003). Our regression line indicates a secular increase of the NLC albedo by+0.51%/year (whereas Thomas et al. (2003) quote 0.4%). Over the 22-year observation period, this amounts to a total increase of
10
10% for β.
5. Comparison of modelled and measured NLC albedo
It has become obvious in Sect. 3 that the episodic changes of upper mesosphere water mixing ratio f (H2O) depend strongly on both latitude and season. A valid comparison of observed NLC parameters with those predicted by models can therefore be done
15
only with water vapour data collected in summer at polar latitudes. Fortunately, there is at least one set of observations available which meets these criteria: the ground-based microwave observations at the ALOMAR observatory. Unfortunately, this record started only in summer 1996. Nevertheless, we want to compare the available observations as closely as possible.
20
Hence, we perform a linear fit to the SBUV-observed albedo data of Fig. 3 for only the period summer 1996 to summer 2000. The regression line is shown (in green) and yields an absolute β increase of (+0.037±0.195)×10−6/year which equals +0.33%/year. We certainly recognize that the statistical significance of this episodic change in NLC brightness is low. Yet, we gladly note the fact that its sign is positive
25
just like the one derived from the summer ALOMAR water vapour observations. Thus, it becomes more significant, that both parameters β and f (H2O), which are monitored
ACPD
4, 3045–3076, 2004Noctilucent clouds and the mesospheric
water vapour
U. von Zahn et al.
Title Page Abstract Introduction Conclusions References Tables Figures J I J I Back Close
Full Screen / Esc
Print Version Interactive Discussion
© EGU 2004
in the Arctic summer, show episodic changes quite different from those which the up-per mesosphere water vapour undergoes at mid and low latitudes (see Neduloha et al., 2003).
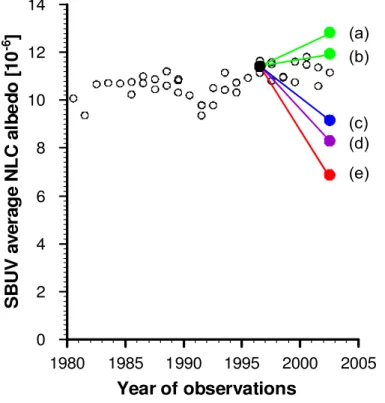
How strong need episodic changes in f (H2O) be, to produce clearly identifiable fea-tures in a record of observed NLC albedo values β To give an at least semi-quantitative
5
answer to this question, we have developed Fig. 4 which shows the observed β values (in black) as published in Thomas et al. (2003) and β values (in colour) predicted from observed changes in water vapour since 1996. We choose as a reference point the β value as observed by the SBUV instruments in summer 1996, which is 11.40×10⁻⁶ (black dot). For the sake of this sensitivity study, we take the observed episodic
10
changes of f (H2O) as listed in Table 2 to be applicable from summer 1996 until summer 2002. We connect these changes of f (H2O) with the β-values of Fig. 3 as follows: The tabulated values of f (H2O)/year [ppmv/year] are first converted to percentage changes per year, then multiplied with the model-derived factor 2.2 to convert them into percent-age changes of β/year, then multiplied by 6 years and finally converted to absolute β
15
changes over 6 years using the mean β value of 11.4×10⁻⁶ (see above). This yields the coloured lines and dots in Fig. 4. One recognizes that only line (b) comes close to fit the SBUV-observed changes in NLC brightness. Line (b) was derived from July-through-August means of f (H2O) observed in the Arctic between 1997 and 2000. The large episodic changes in f (H2O) as derived from annually averaged observations at
20
low and Arctic latitudes (red/purple and blue lines, respectively) are ruled out in the NLC region because they would be inconsistent with the near constancy of observed NLC albedo β.
ACPD
4, 3045–3076, 2004Noctilucent clouds and the mesospheric
water vapour
U. von Zahn et al.
Title Page Abstract Introduction Conclusions References Tables Figures J I J I Back Close
Full Screen / Esc
Print Version Interactive Discussion
© EGU 2004
6. Discussion
6.1. Episodic changes and latitude dependence
The fact is known for years (but sometimes overlooked) that in the upper mesosphere of all latitudes important episodic changes of water vapour occur, the causes for which have not yet been clearly identified. Long term observations of H2O in the upper
meso-5
sphere have become possible only since 1992 which means e.g. that the longest avail-able record of genuine observations now covers barely a single cycle of solar activity. We obtain additional information on long term changes of Arctic upper mesosphere water vapour by studying the 22-year record of SBUV data on NLC brightness (see above). As of today, this record shows an increase of +5.1% albedo/decade (see
10
Fig. 3) which could imply an increase of +2.3% H2O/decade (see Sect. 2). We note that this inferred rate of H2O increase is substantially slower than the+6% H2O/decade which were predicted by Thomas et al. (1989) for the long term increase of upper meso-spheric water vapour.
As short as the period of measurements of upper mesosphere water vapour is, it
15
has become evident that the episodic changes of H2O are smaller at high latitudes than at mid and low latitudes. Or in other words: If the episodic changes of f (H2O) observed at mid latitudes would prevail also at Arctic latitudes, we would be at a total loss in understanding the observed “near-constancy” of NLC albedo since the mid 1990s. As the mixing ratio of water in the NLC region is strongly controlled by the
20
vertical component of the background wind field, the near-constancy of average NLC albedo puts stringent constraints on the dynamics included in GCMs. The latter have, as far as we know, not yet successfully simulated these episodic changes in general or even more specific their latitude dependence.
We emphasize the great importance of continued observations of the upper
meso-25
spheric water vapour in the Arctic! Only this special type of observation will help us to unravel some of the mysteries of NLC aeronomy.
ACPD
4, 3045–3076, 2004Noctilucent clouds and the mesospheric
water vapour
U. von Zahn et al.
Title Page Abstract Introduction Conclusions References Tables Figures J I J I Back Close
Full Screen / Esc
Print Version Interactive Discussion
© EGU 2004
6.2. Seasonal dependence of f (H2O) and its episodic changes
A most interesting feature of the episodic changes in mesospheric water is the fact that they can become quite different in different seasons. We have shown here that the seasonal variation of episodic H2O changes is quite significant at the Arctic latitude of the ALOMAR observatory (see Table 2). More details of this seasonal variation as
5
observed with the ALOMAR microwave spectrometer will be published in a separate paper.
6.3. Decadal variations of NLC occurrence rate and albedo
The question of whether or not the occurrence rate of NLC has increased in the past century has been extensively discussed in the literature with quite different answers
10
being given (e.g. Fogle and Haurwitz, 1974; Thomas et al., 1989; Gadsden, 1990, 2002; Kirkwood and Stebel, 2003; Romejko et al., 2003; von Zahn, 2003). Traditionally this occurrence rate has been expressed by the number of nights per summer season in which NLC were observed visually from the ground. Various records of this type have been published in the past, of which we will use those of Gadsden (2002) for the
15
North European longitude sector and Romejko et al. (2003), the latter being compiled from observations at a single site near Moscow, Russia. Both records are reproduced here in Fig. 5, starting with the year 1970. A very striking feature of these records is the strong variation of occurrence rate with a period of about 10 years. The variation looks to be in approximate antiphase to the solar activity cycle (not shown here), but neither
20
the periods nor the phases of the two types of variations match really closely. With this remark, we will leave, however, this subject and will concentrate on the observed dynamic range of the 10 year variation in NLC occurrence rate.
We define F to be the ratio of the maximum over minimum NLC occurrence rate throughout one decadal variation. This ratio has been studied by e.g. DeLand et
25
al. (2003) using the record of long term changes in NLC parameters as recently derived from SBUV observations. For the latitude band between 50◦N and 81◦N, DeLand et
ACPD
4, 3045–3076, 2004Noctilucent clouds and the mesospheric
water vapour
U. von Zahn et al.
Title Page Abstract Introduction Conclusions References Tables Figures J I J I Back Close
Full Screen / Esc
Print Version Interactive Discussion
© EGU 2004
al. (2003) derived a ratio F=∼4.5 (see their Fig. 9). The Gadsden (2002) record of ground-based visual NLC observation from North-West Europe yields, as shown in Fig. 5, a ratio F of about 48/16=3. A third set of alike data is becoming available through the climatological NLC observations by our lidar at the ALOMAR observatory (69◦N). Fiedler et al. (2003) have reported on results of these observations in the
sum-5
mers of 1997 through 2001. Now these lidar data cover the summers of 1997 through 2003, during which period at least one maximum and one minimum of NLC occurrence rate developed. From all our data on NLC with β≥4×10⁻¹⁰m−1sr−1, we derive a ratio
F=2.8, at least for the one decadal cycle observed so far. This is in reassuring
agree-ment with the F ratio found from the large body of visual observations by Gadsden
10
(2002). We assemble the three independently observed ratios F in Table 3.
Now we turn to a consideration of the NLC albedo. We define R to be the ratio of the maximum over minimum annually averaged NLC albedo throughout one decadal pe-riod. NLC albedo variations have been studied e.g. by Shettle et al. (2003) and Thomas et al. (2003) using the same long-term set of SBUV observations as used by DeLand et
15
al. (2003) for their analysis of the ratio F of occurrence rates. The decadal albedo vari-ations exhibit, however, an unexpected feature. That is the fact that their ratio R turns out to be much smaller than the F ratios listed in Table 3. Shettle et al. (2003) derive a ratio R of maximum over minimum NLC albedo throughout the decadal variations of R=1.15 only. The result, that decadal variations in NLC albedo are considerably
20
smaller than those in occurrence rate, is also found in our ALOMAR lidar observations (see Table 3). The large difference between decadal variations in NLC albedo and oc-currence rate has not found much attention in the literature yet. We suggest that two effects might be responsible for this difference: (1) A strong decadal variation of the low latitude boundary of NLC and (2) an instrumentally caused truncation (diminution
25
of the range) of observed albedo values by the SBUV experiment. We will comment on these two aspects in turn.
(1) The large variation in occurrence rate probably reflects a strong correlation of the low latitude boundary of NLC with solar activity, the latter being a special type of
ACPD
4, 3045–3076, 2004Noctilucent clouds and the mesospheric
water vapour
U. von Zahn et al.
Title Page Abstract Introduction Conclusions References Tables Figures J I J I Back Close
Full Screen / Esc
Print Version Interactive Discussion
© EGU 2004
decadal variation. The lower the solar activity is, the larger is the latitude band of NLC occurrence. If one imagines to observe at a fixed location at the lowest latitudes reached during solar minimum, then one would see nothing during solar maximum and hence gets a large ratio of NLC occurrence at solar minimum over solar maximum. If one observes at, say, 80◦N, the NLC occurrence rate is high at any phase of the
5
solar cycle. Hence, the ratio of NLC occurrence at solar minimum over solar maxi-mum can never become very large. The analysis of DeLand et al. (2003) is based on satellite observations taken between 50◦N and 81◦N. It thus includes a large area at mid latitudes that has only a small chance of NLC occurrence leading to a large F ratio. The sampling scenario is evidently different for the visually observed NLC events
10
as collected by Gadsden (2002). A large portion of these events were reported from locations between 55◦N and 65◦N and the observed NLC are typically located even 4◦ further North than the observer. Therefore, the low latitude boundary of the visual ob-servations is on average at a higher latitude than the 50◦N of the SBUV observations. For the Arctic latitude of the ALOMAR observatory (69◦N) we might expect a continued
15
decrease of the F ratio. This expectation comes true only marginally if we calculate the
F ratio from all ALOMAR lidar observations with β≥4 (see Table 3). This may be due to
the fact that the ALOMAR data encompass only one pair of maximum/minimum values which indeed is no statistics at all.
(2) The smallness of albedo changes throughout the decadal variation as derived
20
from the SBUV observations by Shettle et al. (2003) is difficult to understand against the background of rather large changes in occurrence rate. The published values for the ratios F and R imply that the latitudinal coverage of NLC can vary a great deal without a collateral variation in mean NLC albedo. We suggest that in the case of SBUV observations, their small value of R is at least in part due to the very limited
25
dynamic range of these measurements, hence contains an instrumental bias. DeLand et al. (2003) require for the positive identification of a NLC its (residual) albedo to be
>7×10⁻⁶ at β=252 nm. The same threshold is used by Shettle et al. (2003) for their analysis of albedo statistics. Their seasonally averaged albedo values fall, however, in
ACPD
4, 3045–3076, 2004Noctilucent clouds and the mesospheric
water vapour
U. von Zahn et al.
Title Page Abstract Introduction Conclusions References Tables Figures J I J I Back Close
Full Screen / Esc
Print Version Interactive Discussion
© EGU 2004
the range of only 9 to 12×10−6(see their Fig. 1) and are thus not even a factor 2 larger than the threshold value. Hence, Shettle et al. (2003) average over bright clouds only, the albedo of which does not vary much. Still, the occurrence frequency of these bright clouds varies dramatically throughout the decadal variation, but the NLC frequency hardly effects the mean albedo if all individual albedo values are very similar anyway.
5
If we apply this line of arguments to our ALOMAR lidar results, the numbers turn out as follows: In mid-summer and hence under sunlit conditions, our threshold value of volume backscatter coefficient β for identification of a NLC is β=4×10⁻¹⁰m−1sr−1, while our seasonally averaged β values range from 9.5 to 16×10−10m−1 sr−1 (with a maximum value for a single NLC of 47×10−10 m−1 sr−1). Hence, the ratio of overall
10
mean over the threshold value for β is for our lidar observations considerably larger than the alike defined albedo ratio for the SBUV observations. We suggest that this larger dynamical range of the lidar observations accounts for the F value of the lidar observations (F=2.8) being smaller than that for the SBUV observations (F ∼4.5). To support our point, we tentatively reduce our lidar dynamic range to cover only bright
15
NLC having β>13×10−10m−1sr−1 for which type of NLC the ALOMAR RMR lidar still has 124 h of observations. Those NLC yield a rather large ratio F=6.1 (see Table 3).
One might ask how large albedo variations between solar activity minima and max-ima we predict from model calculations. We can not yet answer this question in the light of model results obtained recently by Sonnemann and Grygalashvyly (2004). These
20
authors point out that at polar latitudes in summer the water vapour mixing ratio f (H2O) reacts to changes in solar activity very little at 80 m km altitude (a few percent only), but does so strongly at 90 km altitude. This strong altitude dependence of the reaction of water vapour in the NLC region to changes of solar activity is not taken into account in any current 3-dim model of NLC formation. Hence, we need to wait with an answer to
25
ACPD
4, 3045–3076, 2004Noctilucent clouds and the mesospheric
water vapour
U. von Zahn et al.
Title Page Abstract Introduction Conclusions References Tables Figures J I J I Back Close
Full Screen / Esc
Print Version Interactive Discussion
© EGU 2004
6.4. Unexpected stability of the Arctic summer mesosphere
It becomes more and more evident that the Arctic summer mesosphere constitutes a region of unexpected stability against episodic or long term changes of a number of atmospheric parameters. This stability became first evident by the review of the mesopause temperatures in summer at high latitudes by von Zahn (1990). This
per-5
spective of unexpected stability was enlarged to the thermal structure of the entire mesosphere in summer at high latitudes by L ¨ubken (2000). Next came a recognition of the long term constancy of the altitudes of NLC by von Zahn and Berger (2003b). With the current study we now add the water vapour mixing ratio in the upper mesosphere to the ambient parameters which display an unexpected stability in the Arctic summer,
10
at least over episodic time scales. We emphasize that we do not proclaim a perfect “zero-trend” for the water vapour in the Arctic summer mesosphere. Nonetheless, we consider the measurements of the ALOMAR microwave spectrometer to indicate a “near-zero episodic change” for the summer upper mesosphere mixing ratio f (H2O) which is, to our knowledge, not predicted by any current global circulation model.
15
Finally, we offer the notion that the NLC occurrence rate exhibits a near-zero trend at least for the past three decades. The data which are to support our notion are shown in Fig. 5. These are the well-known datasets for the NLC occurrence rate of Gads-den (2002) and Romejko et al. (2003). Neither one of these datasets indicates any significant trend in NLC occurrence rate since 1970. It is for this reason that we
con-20
sider the NLC occurrence rate to be one more atmospheric parameter which exhibits a “near-zero trend” over the past three decades.
We know very well that the Gadsden (2002) record of NLC occurrence rate is fre-quently used to postulate a long-term increase of this rate. This argument can be made, however, only by including in the trend analysis the time period 1964 to 1970.
25
During this period, the Gadsden (2002) record shows a maximum of NLC occurrence rate which was considerably lower than the following three maxima in 1977, 1988, and 1995/6. We object, however, to appointing a particular significance to the smallness of
ACPD
4, 3045–3076, 2004Noctilucent clouds and the mesospheric
water vapour
U. von Zahn et al.
Title Page Abstract Introduction Conclusions References Tables Figures J I J I Back Close
Full Screen / Esc
Print Version Interactive Discussion
© EGU 2004
this 1967 maximum because there exists the equally believable record of NLC occur-rence rate by Fogle and Haurwitz (1974) which shows the opposite behaviour for this maximum: It is unusually strong! It is still difficult to reconcile these two contradictory results. Perhaps the occurrence maximum of 1968 became so “small” in the Gadsden (2002) record because it is based on NLC observations by a North-West European
5
group of amateurs which started to form only in the early 1960s (see Gavine, 2002) and was still growing in the number of observers during the late 1960s. In any way, we consider a total rejection of the data record of Fogle and Haurwitz (1974) as unfounded and hence an unacceptable approach (von Zahn, 2003). Our recommendation is to just exclude this time period from any trend analysis of NLC occurrence rate. What
10
is left then is the data since 1970 which we have made the basis for our discussion above.
7. Conclusions
We have shown that the decreases of annually averaged upper mesosphere water vapour which are observed since 1996 at low, middle, and high latitudes can not be
15
reconciled with the near constancy of the observed NLC brightness in the same time period. In the discussion about the interdependence of changes in mesospheric water vapour and those in NLC brightness, the possiblity has not been considered so far that these changes may be different between summer and winter. Here we point out that episodic changes of water vapour can exhibit strong seasonal variations. In particular,
20
observations at an Arctic latitude since 1996 show the upper mesosphere water vapour to increase over time in summer, but to decrease considerably if averaged over the other nine months of the year. This observed summer increase of water vapour, when introduced into models of NLC layer formation, comes close to explaining that part of the observed episodic change in NLC brightness which occurred since 1996.
25
Acknowledgements. We thank L. Song and C. Jarchow for support in the analysis of the ALO-MAR water vapour data. U. Berger acknowledges support through project DEKLIM (F
¨order-ACPD
4, 3045–3076, 2004Noctilucent clouds and the mesospheric
water vapour
U. von Zahn et al.
Title Page Abstract Introduction Conclusions References Tables Figures J I J I Back Close
Full Screen / Esc
Print Version Interactive Discussion
© EGU 2004
Kennzeichen 01LD0038) of the German Bundesministerium f ¨ur Bildung und Forschung, Bonn, Germany.
References
Berger, U. and von Zahn, U.: Icy particles in the summer mesopause region: Three-dimensional modelling of their environment and two-dimensional modelling of their transport, J. Geophys.
5
Res., 107, A11, 1366, doi: 10.1029/2001JA000316, 2002 (The colored figures of this paper were published in J. Geopys. Res., 108, A10, doi: 10.1029/2003JA010052, 2003).
Chu, X., Gardner, C. S., and Roble, R. G.: Lidar studies of interannual, seasonal, and diurnal variations of polar mesospheric clouds at the South pole, J. Geophys. Res., 108, D8, 8447, doi: 10.1029/2002JD002524, 2003.
10
DeLand, M. T., Shettle, E. P., Thomas, G. E., and Olivero, J.: Solar backscattered ultraviolet (SBUV) observations of polar mesospheric clouds (PMCs) over two solar cycles, J. Geophys. Res., 108, D8, 8445, doi: 10.1029/2002JD002398, 2003.
Donahue, T. M., Guenther, B., and Blamont, J. E.: Noctilucent clouds in daytime: Circumpolar particulate layers near the summer mesopause, J. Atmos. Sci., 29, 1205–1209, 1972.
15
Fiedler, J., Baumgarten, G., and von Cossart, G.: Noctilucent clouds above ALOMAR between 1997 and 2001: Occurrence and properties, J. Geophys. Res., 108, D8, doi:10.1029/2002JD002419, 2003.
Fogle, B. and Haurwitz, B.: Long term variations in noctilucent cloud activity and their possible cause, in Climatological Research, edited by Fraedrich, K., Hantel, M., Claussen Korff, H.,
20
and Ruprecht, E., Bonner Meteorologische Abhandlungen, 7, 263–276, 1974.
Gadsden, M.: A secular change in noctilucent cloud occurrence, J. Atm. Terr. Phys., 52, 247– 251, 1990.
Gadsden, M.: Statistics of the annual counts of nights on which NLCs were seen, Memoirs British Astron. Assoc., Vol. 45, Aurora Section, Papers given at the “Mesospheric Clouds
25
2002” meeting in Perth, Scotland, 19–22 August, 2002.
Gavine, D.: Noctilucent clouds: The amateur contribution, Memoirs British Astron. Assoc., Vol. 45, Aurora Section, Papers given at the “Mesospheric Clouds 2002” meeting in Perth, Scotland, 19–22 August, 2002.
ACPD
4, 3045–3076, 2004Noctilucent clouds and the mesospheric
water vapour
U. von Zahn et al.
Title Page Abstract Introduction Conclusions References Tables Figures J I J I Back Close
Full Screen / Esc
Print Version Interactive Discussion
© EGU 2004
Hartogh, P. and Jarchow, C.: Groundbased detection of middle atmospheric water vapour, SPIE, 2586, 188–195, 1995.
Hartogh, P., Song, L., and Jarchow, Ch.: Annual and interannual variations of polar upper stratospheric and mesospheric water vapour, poster presented at Network for the Detection of Stratospheric Change (NDSC)-Meeting, Arcachon, France, 24–27 September, 2001.
5
Hervig, M., McHugh, M., and Summers, M. E.: Water vapour enhancement in the polar summer mesosphere and its relationship to polar mesospheric clouds, Geophys. Res. Lett., 30, 20, 2041, doi:10.1029/2003GL018089, 2003.
Hunten, D. M., Turco, R. P., and Toon, O. B.: Smoke and dust particles of meteoric origin in the mesosphere and stratosphere, J. Atmos. Sci., 37, 1342–1357, 1980.
10
Jensen, E. and Thomas, G. E.: A growth-sedimentation model of polar mesospheric clouds: comparison with SME measurements, J. Geophys. Res., 93, 2461–2473, 1988.
Kirkwood, S. and Stebel, K.: Influence of planetary waves on noctilucent cloud occurrence over NW Europe, J. Geophys. Res., 108, D8, 8440, doi:10.1029/2002JD002356, 2003.
L ¨ubken, F.-J.: Nearly zero temperature trend in the polar summer mesosphere, Geophys. Res.
15
Lett., 27, 3603–3606, 2000.
Marsh, D., Smith, A., and Noble, E.: Mesospheric ozone response to changes in water vapour, J. Geophys. Res., 108, D3, paper ACH 9, 2003.
McHugh, M., Hervig, M., Magill, B., Thompson, R. E., Remsberg, E., Wrotny, J., and Russell III, J.: Improved mesospheric temperature, water vapour and polar mesospheric cloud
extinc-20
tions from HALOE, Geophys. Res., Lett., 30, 8, 1440, doi:10.1029/2002GL016859, 2003. Merkel, A., Bailey, S., Thomas, G., Carstens, J., and Garcia, R.: Global characteristics of PMCs
from six years of SNOE data, invited paper SA42B-01 presented at the 2003 Fall Meeting of the American Geophysical Union, San Francisco, December 2003.
Nedoluha, G. E., Bevilacqua, R. M., Gomez, R. M., Siskind, D. E., Hicks, B. C., Russell III,
25
J. M., and Connor, B. J.: Increases in middle atmospheric water vapour as observed by the Halogen Occultation Experiment and the ground-based Water Vapour Millimeterwave Spectrometer from 1991 to 1997, J. Geophys. Res., 103, 3531–3543, 1998.
Nedoluha, G. E., Bevilacqua, R. M., Gomez, R. M., Hicks, B. C., Russell III, J. M., and Connor, B. J.: An evaluation of trends in middle atmospheric water vapour as measured by HALOE,
30
WVMS, and POAM, J. Geophys. Res., 108, D13, 4391, doi:10.1029/2002JD003332, 2003. O’Neil, R. R., Richards, E., Humphrey, C. H., Stair, A. T., and Gardner, M. E.: MSX: Infrared
Meet-ACPD
4, 3045–3076, 2004Noctilucent clouds and the mesospheric
water vapour
U. von Zahn et al.
Title Page Abstract Introduction Conclusions References Tables Figures J I J I Back Close
Full Screen / Esc
Print Version Interactive Discussion
© EGU 2004
ing of the AGU, Boston, MA, USA, 2001.
Randel, W. J., Wu, F., Russell III, J. M., Zawodny, J. M., and Nash, J.: Interannual changes in stratospheric constituents and global circulation derived from satellite data, in Atmospheric Science across the Stratopause, Geophysical Monograph 123, 271–285, 2000.
Rapp, M., L ¨ubken, J.-J., M ¨ullemann, A., Thomas, G. E., and Jensen, E. J.: Small scale
tem-5
perature variations in the vicinity of NLC: Experimental and model results, J. Geophys. Res., 107, 19, doi:10.1029/2001JD001241, 2002.
Romejko, V. A., Dalin, P. A., and Pertsev, N. N.: Forty years of noctilucent cloud obser-vations near Moscow: Database and simple statistics, J. Geophys. Res., 108, D8, doi: 10.1029/2002JD002364, 2003.
10
Seele, C. and Hartogh, P.: Water vapour of the polar middle atmosphere: Annual variation and summer mesosphere conditions as observed by ground-based microwave spectroscopy, Geophys. Res. Lett., 26, 1517–1520, 1999.
Shettle, E. P., DeLand, M. T., Thomas, G. E., and Olivero, J. J.: Variations in the average bright-ness of polar mesospheric clouds from twenty-four years of SBUV measurements, Memoirs
15
British Astron. Assoc., Proc. “Mesospheric Clouds 2002” workshop, Galway, Ireland, 18–20 August, 2003.
Sonnemann, G. R. and Grygalashvyly, M.: Solar influence on mesospheric water vapour with impact on NLCs, J. Atmos. Solar Terr. Phys., in press, 2004.
Thayer, J., Rapp, M., Gerrard, A., Gudmundsson, E., and Kane, T.: Gravity wave influences on
20
Arctic mesospheric clouds as determined by the Sondrestrom, Greenland, Rayleigh lidar, J. Geophys. Res., 108, D8, doi:10.1029/2002JD002363, 2003.
Thomas, G. E., Olivero, J. J., Jensen, E. J., Schroeder, W., and Toon, O. B.: Relation between increasing methane and the presence of ice clouds at the mesopause, Nature, 338, 490– 492, 1989.
25
Thomas, G. E., McPeters, R. D., and Jensen, E. J.: Satellite observations of polar mesospheric clouds by the solar backscattered ultraviolet spectral radiometer: Evidence of a solar cycle dependence, J. Geophys. Res., 96, 927–939, 1991.
Thomas, G. E., Rapp, M., Olivero, J. J., Shettle, E. P., and DeLand, M.: Long-term variability in the brightness and occurrence frequency of mesospheric clouds explained by water vapour
30
changes, Memoirs British Astron. Assoc., Aurora Section, Proc. of the “Mesospheric Clouds 2003” meeting, 18–22 August, 2003, Galway, Ireland, in press, 2004.
Inter-ACPD
4, 3045–3076, 2004Noctilucent clouds and the mesospheric
water vapour
U. von Zahn et al.
Title Page Abstract Introduction Conclusions References Tables Figures J I J I Back Close
Full Screen / Esc
Print Version Interactive Discussion
© EGU 2004
national Reference Atmosphere: 1986; Part 2: Middle Atmosphere Models, edited by Rees, D., Barnett, J. J., and Labitzke, K., Pergamon Press, 223–231, 1990.
von Zahn, U.: Are noctilucent clouds truly a “miner’s canary” for global change? EOS, 84, 28, 261–268, 15 July, 2003.
von Zahn, U. and Berger, U.: Persistent ice cloud in the mid-summer upper mesosphere at
5
high latitudes: Three-dimensional modelling and cloud interactions with the ambient water vapour, J. Geophys. Res., 108, D8, doi:10.1029/2002JD002409, 2003a.
von Zahn, U. and Berger, U.: The altitude of noctilucent clouds: Groundbased observations and their interpretation through numerical modelling, in Proc. 16th ESA Symp. on European Rocket and Balloon Programmes and Related Research, edited by B. Warmbein, ESA
SP-10
ACPD
4, 3045–3076, 2004Noctilucent clouds and the mesospheric
water vapour
U. von Zahn et al.
Title Page Abstract Introduction Conclusions References Tables Figures J I J I Back Close
Full Screen / Esc
Print Version Interactive Discussion
© EGU 2004
Table 1. Longer term observations of upper mesosphere H2O.
No. Method Latitude(s) Summer Altitude References of observ. periods
1 ground-based 67◦N since 1996 up to 85 km Seele and Hartogh (1999);
microwave Hartogh et al. (2001)
spectrometry
2.1 satellite-borne (0◦) to 70◦N since 1992 up to 88 km see text solar occultation
limb sounding
2.2 ground-based 20◦N since 1996 up to 80 km Nedoluha et al. (2003) microwave
spectrometry
2.3 ground-based 34◦N 1992 until 1997 up to 80 km Nedoluha et al. (1998) microwave
ACPD
4, 3045–3076, 2004Noctilucent clouds and the mesospheric
water vapour
U. von Zahn et al.
Title Page Abstract Introduction Conclusions References Tables Figures J I J I Back Close
Full Screen / Esc
Print Version Interactive Discussion
© EGU 2004
Table 2. Observed episodic changes of upper mesosphere H2O.
Period Method Latitude Altitude Episodic change References (km) (ppmv/year)
1995–2001 microwave 67◦N 77.5 −0.045±0.006 Hartogh et al.
spectrometry (2001)
summers
1996–2001 microwave 67◦N 80 +0.05±0.01 this work 1997–2000 spectrometry +0.017±0.016
1997–2002 microwave 20◦N 70 −0.108 Nedoluha et al.
spectrometry (2003)
solar 20◦N −0.163 Nedoluha et al.
occultation ±5◦ (2003)
1993–1996 microwave 34◦N 70 +0.19 Nedoluha et al.
spectrometry (2003)
1992–1996 solar 34◦N +0.20 Nedoluha et al.
ACPD
4, 3045–3076, 2004Noctilucent clouds and the mesospheric
water vapour
U. von Zahn et al.
Title Page Abstract Introduction Conclusions References Tables Figures J I J I Back Close
Full Screen / Esc
Print Version Interactive Discussion
© EGU 2004
Table 3. Observed ratios F and R for decadal NLC variations.
SBUV observ. Ground-based visual Ground-based between observ. from North- ALOMAR lidar observ. 50◦N and 81◦N West Europe at 69◦N (this work)
Occurrence F∼4.5 F∼3 F=2.8 for β≥4
rate (DeLand et al., 2003) (Gadsden, 2002) (F=6.1 for β≥13) Albedo R=1.15 (not available) R=1.7 for β≥4
ACPD
4, 3045–3076, 2004Noctilucent clouds and the mesospheric
water vapour
U. von Zahn et al.
Title Page Abstract Introduction Conclusions References Tables Figures J I J I Back Close
Full Screen / Esc
Print Version Interactive Discussion
© EGU 2004
Fig. 1. Sensitivity of the NLC volume backscatter coefficient β (532 nm) on altitude and back-ground water vapour abundance (at 69◦N for 21 June) as calculated with the COMMA/IAP model.
ACPD
4, 3045–3076, 2004Noctilucent clouds and the mesospheric
water vapour
U. von Zahn et al.
Title Page Abstract Introduction Conclusions References Tables Figures J I J I Back Close
Full Screen / Esc
Print Version Interactive Discussion
© EGU 2004
Fig. 2. The H2O mixing ratio as measured by the ALOMAR microwave spectrometer at 80 km altitude during the months June, July, and August of the years 1996 through 2000. The dashed line marks the mean H2O mixing ratio as observed in the summer 1996, the short black lines indicate a linear regression for all data points shown. Each data point is a 24-h mean.
ACPD
4, 3045–3076, 2004Noctilucent clouds and the mesospheric
water vapour
U. von Zahn et al.
Title Page Abstract Introduction Conclusions References Tables Figures J I J I Back Close
Full Screen / Esc
Print Version Interactive Discussion © EGU 2004
1980
1985
1990
1995
2000
2005
Year of observations
0
2
4
6
8
10
12
S
B
U
V
av
er
ag
e
N
L
C
al
be
do
[1
0
-6]
Fig. 3. Averaged NLC albedo as measured by SBUV from 1981–2002 and linear regression lines for data from 1981–2002 (red line) and from 1996–2000 (green line). Data points are taken from Fig. 6a of Thomas et al. (2003).
ACPD
4, 3045–3076, 2004Noctilucent clouds and the mesospheric
water vapour
U. von Zahn et al.
Title Page Abstract Introduction Conclusions References Tables Figures J I J I Back Close
Full Screen / Esc
Print Version Interactive Discussion © EGU 2004 1980 1985 1990 1995 2000 2005 Year of observations 0 2 4 6 8 10 12 14 S B U V av er ag e N L C al be do [1 0 -6 ] (a) (b) (c) (d) (e)
Fig. 4. Modelled changes of NLC albedo β as predicted from observed changes in water vapour since 1996. Data points for β (hollow circles) are taken from Fig. 6a of Thomas et al. (2003). Measured water vapour changes are converted to NLC brightness changes as de-scribed in the text. They are used to predict NLC brightness changes with a common start year of summer 1996 and “anchored” at the SBUV-observed brightness for that year. The pre-dicted brightness changes are shown until summer 2002 and are based on the water vapour trends measured as follows: (a) 67◦N microwave spectrometer summers 1996 through 2000, (b) 67◦N microwave spectrometer summers 1997 through 2000, (c) 67◦N microwave spec-trometer all data 1996 through 2001,(d) 20◦N microwave spectrometer all data 1997 though summer 2002,(e) 20◦N HALOE instrument all data 1997 though summer 2002.
ACPD
4, 3045–3076, 2004Noctilucent clouds and the mesospheric
water vapour
U. von Zahn et al.
Title Page Abstract Introduction Conclusions References Tables Figures J I J I Back Close
Full Screen / Esc
Print Version Interactive Discussion © EGU 2004
31
1970 1980 1990 2000 year 0 10 20 30 40 50n
u
m
ber
of
n
ight
s
w
it
h
N
L
C
pe
r
y
e
ar
Fig. 5.
Fig. 5. Rate of occurrence of NLC 1970-present as measured by the number of nights per sum-mer season in which NLC were observed visually from the ground. The green line represents data from Gadsden (2002), the blue line those of the single observation station of Romejko et al. (2003).