HAL Id: hal-00302736
https://hal.archives-ouvertes.fr/hal-00302736
Submitted on 26 Apr 2007HAL is a multi-disciplinary open access
archive for the deposit and dissemination of sci-entific research documents, whether they are pub-lished or not. The documents may come from teaching and research institutions in France or abroad, or from public or private research centers.
L’archive ouverte pluridisciplinaire HAL, est destinée au dépôt et à la diffusion de documents scientifiques de niveau recherche, publiés ou non, émanant des établissements d’enseignement et de recherche français ou étrangers, des laboratoires publics ou privés.
Simulation of hurricane response to suppression of warm
rain by sub-micron aerosols
D. Rosenfeld, A. Khain, B. Lynn, W. L. Woodley
To cite this version:
D. Rosenfeld, A. Khain, B. Lynn, W. L. Woodley. Simulation of hurricane response to suppression of warm rain by sub-micron aerosols. Atmospheric Chemistry and Physics Discussions, European Geosciences Union, 2007, 7 (2), pp.5647-5674. �hal-00302736�
ACPD
7, 5647–5674, 2007 Simulation of hurricane response to suppression of warm rain D. Rosenfeld et al. Title Page Abstract Introduction Conclusions References Tables Figures ◭ ◮ ◭ ◮ Back CloseFull Screen / Esc
Printer-friendly Version Interactive Discussion
Atmos. Chem. Phys. Discuss., 7, 5647–5674, 2007 www.atmos-chem-phys-discuss.net/7/5647/2007/ © Author(s) 2007. This work is licensed
under a Creative Commons License.
Atmospheric Chemistry and Physics Discussions
Simulation of hurricane response to
suppression of warm rain by sub-micron
aerosols
D. Rosenfeld1, A. Khain1, B. Lynn1, and W. L. Woodley2
1
Institute of Earth Sciences, The Hebrew University of Jerusalem, Isreal
2
Woodley Weather Consultants, 11 White Fir Court, Littleton 80327, USA Received: 5 April 2007 – Accepted: 10 April – Published: 26 April 2007 Correspondence to: D. Rosenfeld ([email protected])
ACPD
7, 5647–5674, 2007 Simulation of hurricane response to suppression of warm rain D. Rosenfeld et al. Title Page Abstract Introduction Conclusions References Tables Figures ◭ ◮ ◭ ◮ Back CloseFull Screen / Esc
Printer-friendly Version Interactive Discussion
Abstract
The feasibility of hurricane modification was investigated for hurricane Katrina using the Weather Research and Forecasting Model (WRF). The possible impact of seeding of clouds with submicron cloud condensation nuclei (CCN) on hurricane structure and intensity as measured by nearly halving of the area covered by hurricane force winds
5
was simulated by “turning–off” warm rain formation in the clouds at Katrina’s periphery (where wind speeds were less than 22 m s−1). This simplification of the simulation of
aerosol effects is aimed at evaluating the largest possible response. This resulted in the weakening of the hurricane surface winds compared to the “non-seeded” simulated storm during the first 24 h within the entire tropical cyclone (TC) area compared to a
10
control simulation without warm rain suppression. Later, the seeding-induced evap-orative cooling at the TC periphery led to a shrinking of the eye and hence to some increase in the wind within the small central area of the TC. Yet, the overall strength of the hurricane decreased in response to the suppressed warm rain at the periphery, as measured by a 25% reduction in the radius of hurricane force winds. In a simulation
15
with warm rain suppression throughout the hurricane, the relative weakening compared to the control continued throughout the simulations and the eye shrunk even further. This shows that the main mechanism by which suppressing warm rain weakens the TC is the low level evaporative cooling of the un-precipitated cloud drops and the added cooling due to melting of precipitation that falls from above.
20
1 Introduction
The devastating United States hurricane season of 2005 renewed interest in develop-ing methods to mitigate the strong winds of hurricanes. Hurricane modification can be considered if it is possible to intervene in the energy pathways in moist tropical convec-tive clouds that energize hurricanes. These energy pathways (see illustration in Fig. 1)
25
start with heat that is taken from the sea surface mainly by evaporation (Fig. 1a). This 5648
ACPD
7, 5647–5674, 2007 Simulation of hurricane response to suppression of warm rain D. Rosenfeld et al. Title Page Abstract Introduction Conclusions References Tables Figures ◭ ◮ ◭ ◮ Back CloseFull Screen / Esc
Printer-friendly Version Interactive Discussion
latent heat becomes sensible when the vapor condenses into cloud drops (Fig. 1b). Some of this released heat is reclaimed if the drops re-evaporate (Fig. 1c), but the heat remains in the air if the drops precipitate as rain (Fig. 1d). Drops that ascend to the sub-zero parts of the cloud freeze and release additional latent heat of freezing (Fig. 1e), which along with the freezing of ascending vapor warm the upper levels of
5
the cloud (Fig. 1g). Some of the heat is lost when ice evaporates aloft (Fig. 1i). The rest of the heat remains in the cloud when the ice hydrometeors precipitate and melt while cooling the air below (Fig. 1h). This study tests the feasibility of modifying hurricanes by seeding with small CCN to suppress warm rain (Fig. 1d). This would increase the warming aloft (Figs. 1e and g) and the evaporative cooling at the lower levels (Figs. 1c
10
and h) and so affect the storm circulation in ways that will be shown in here.
Historically the pathway of freezing supercooled cloud water (Fig. 1e) was addressed by glaciogenic cloud seeding. Hurricane mitigation was first attempted between 1962 and 1983 in the framework of project STORMFURY by the US government (Willoughby et al., 1985), The envisioned modification technique involved artificial stimulation of
15
convection at the outer periphery of the eyewall through seeding of strong convective cloud towers with silver iodide for the purpose of freezing super-cooled water (water in liquid state but colder than 0◦
C). They postulated that the release of the latent heat of freezing (pathway E in Fig. 1) would invigorate convection (Simpson and Malkus, 1964) that would compete with the original eyewall, leading to its reformation at a
20
larger radius, and thus, through partial conservation of angular momentum, produce a decrease in the strongest winds. Since a hurricane’s destructive potential increases with the cube of its strongest winds, a reduction as small as 10% in its wind speed could significantly reduce the destructive power of hurricanes, which is proportional to the cube of the wind speed.
25
Modification was attempted in four hurricanes. Although the maximum winds of some of the seeded TCs decreased, the change in hurricane intensity was attributed to nat-ural intensity fluctuations rather than to seeding. The analysis of the microphysical structure of tropical convective (TC) clouds (Willoughby et al., 1985) showed that at the
ACPD
7, 5647–5674, 2007 Simulation of hurricane response to suppression of warm rain D. Rosenfeld et al. Title Page Abstract Introduction Conclusions References Tables Figures ◭ ◮ ◭ ◮ Back CloseFull Screen / Esc
Printer-friendly Version Interactive Discussion
levels where seeding was applied there was too little supercooled water and a signifi-cant amount of cloud ice. Consequently, the glaciogenic seeding could not affect cloud dynamics, at least in the way assumed in the STORMFURY conceptual model. Today it is known that the quick conversion of cloud water into raindrops (Pathway B in Fig. 1) in maritime tropical convection causes the clouds to lose much of their water by rain
5
out and evaporation (Pathway C) before ascending above the 0◦C isotherm.
This study was motivated initially by earlier observations that a heavy load of small aerosols can prevent warm rain from tropical clouds (Rosenfeld, 1999; Rosenfeld and Woodley, 2003; Andreae et al., 2004), and hence allow the cloud water to ascend to the supercooled levels and become available for freezing, and so remedy the cardinal
10
problem of STORMFURY, which is insufficient amounts of supercooled water. The new approach to weaken hurricanes by seeding with submicron hygroscopic aerosols was submitted on April 2006 as a proposal to the Yeshaya Horowitz Association, and filed as a provisional patent in early 2007. This alternative approach was developed further in this study based on the observations mentioned above as well as on the results
15
of numerical simulations (Khain et al., 2005; Lynn et al., 2005; Van den Heever et al., 2006) indicating that an increase in the concentration of small aerosol particles (AP) leads to the formation of a great number of small droplets with low collision rates. The delay in the raindrop formation leads to raindrop formation at higher levels, where the environmental temperature is as low as –10◦C. At such temperatures a significant
20
fraction of raindrops freezes. This results in at least partial suppression of raindrop formation in the lower parts of the clouds and to additional latent heat release at high levels because of drop freezing and extra water vapour condensation on droplets and ice particles. Consequently, clouds developing in a polluted atmosphere turn out to be more intense and reach higher levels than clouds developing in a less polluted air
25
mass. The melting of the ice hydrometeors at lower levels causes enhanced cooling and downdrafts that can trigger new convective elements. This convective invigoration effect was proposed in Williams et al. (2002), and simulated by Khain et al. (2005), Lynn et al. (2005) and Van den Heever et al. (2006). It is also described in detail by
ACPD
7, 5647–5674, 2007 Simulation of hurricane response to suppression of warm rain D. Rosenfeld et al. Title Page Abstract Introduction Conclusions References Tables Figures ◭ ◮ ◭ ◮ Back CloseFull Screen / Esc
Printer-friendly Version Interactive Discussion
Rosenfeld (2006).
These observational and numerical results indicate a possibility of mitigating tropical cyclones (TC) by seeding the air that is ingested into the cloud bases with large concen-trations (1000–2000 cm−3) of small (0.1 to 0.2 µm diameter) cloud condensation nuclei
(CCN). It was proposed that the expected convective invigoration at the hurricane
pe-5
riphery should decrease the influx of air mass to the hurricane center and decrease, therefore, the ascending vapour mass and the latent heat release in the eyewall. That is, seeding of small CCN to suppress warm rain (Fig. 1d) in hurricanes could lead to a relative weakening of the storm, at least initially. This is because the seeding should increase the warming aloft (Figs. 1e and g) and evaporative cooling at the lower levels
10
(Figs. 1c and h).
This conceptual model was tested using a two nested grid Weather Research Model (WRF: Michalakes et al., 2005, 2001; Skamarock et al., 2005) by simulating the evolu-tion of hurricane Katrina during 27–29 August 2005. Given this focus of the exploratory study, the simulations are purposely crude, where warm rain processes are set
com-15
pletely on or off at the periphery, in order to reveal the greatest possible aerosol ef-fects on hurricane peak intensity (minimum pressure, and maximum winds) and overall strength (radius of area covered by hurricane force winds and wind speed outside of the radius of maximum wind). The paper also discusses some new physical insights that result from an analysis of the three-dimensional temperature, humidity, and cloud
20
fields.
Cotton et al. (2007) also simulated the possible impacts of CCN seeding of hurri-canes. They simulated the evolution of an idealized TC starting with a weak initial vortex using the Regional Atmospheric Modeling System (RAMS) model (Cotton et al., 2003) with a two moment microphysical scheme (Saleeby and Cotton, 2004). The
25
TC was simulated at 2 km horizontal resolution. The seeding effect was simulated by adding 1000 or 2000 CCN cm−3
, compared to the natural background of 100 cm−3
. The TC developing in dusty air was substantially weaker at the mature stage compared to the storm developing in the clean air, with peak winds lower by 25 ms−1 and central
ACPD
7, 5647–5674, 2007 Simulation of hurricane response to suppression of warm rain D. Rosenfeld et al. Title Page Abstract Introduction Conclusions References Tables Figures ◭ ◮ ◭ ◮ Back CloseFull Screen / Esc
Printer-friendly Version Interactive Discussion
pressure higher by 25 hPa. Adding giant CCN that restored the warm rain, however, eliminated most of the TC weakening.
2 Design of the numerical experiments
A two nested grid of the Weather Research and Forecasting Model (WRF) was used to simulate Hurricane Katrina from 27 August 0z to 30 August 0z. The available computer
5
resources (a 16 processor Linux cluster) were enough to simulate resolutions for the finest and the outer grid of 3 km and 9 km, respectively. The bulk-parameterization by Thompson et al. (2004) was used to simulate the explicit microphysics on both grids, while the coarse grid used both the explicit microphysics and the Kain-Fritsch cumulus convective scheme (Kain and Fritsch, 1993).
10
The WRF initial conditions were obtained from the Global Forecast System (GFS) Reanalysis data with a grid resolution of 30 km. The analyzed reanalysis fields were used “as-is” to create the initial hurricane vortex. The vortex developed within sev-eral minutes of simulation time into a hurricane. The atmospheric latsev-eral boundary conditions of simulation were updated every three hours using GFS Reanalysis data.
15
The Gulf of Mexico’s surface water temperatures were initialized at 27◦C, and were not
updated during the three experiments described below.
The natural or control run, aimed at simulating the actual conditions in Katrina, al-lowed for warm rain (WR) formation by drop-drop collisions. The effect of small aerosols on warm rain processes was simulated in two other runs. Since small aerosols lead to
20
the formation of a great number of small droplets with very low ability to form raindrops, the aerosol effects in the “seeding” runs were parameterized by shutting off the drop-drop collisions. In the first experimental simulation named “No Warm Rain” (NWR), the warm rain formation was shut off over the entire TC area. The NWR represents the “reference” simulation carried out under idealized conditions, which cannot occur
25
in real hurricanes, because wind driven sea spray particles serve as giant CCN (>1µm diameter) that initiate early rain even when large concentrations of small CCN exist
ACPD
7, 5647–5674, 2007 Simulation of hurricane response to suppression of warm rain D. Rosenfeld et al. Title Page Abstract Introduction Conclusions References Tables Figures ◭ ◮ ◭ ◮ Back CloseFull Screen / Esc
Printer-friendly Version Interactive Discussion
(Woodcock, 1953; Segal et al., 2004) and overwhelm the rain suppression seeding effect.
The second experimental simulation, referred to as No Warm Rain at the Periphery (NWRP), tests the impact of seeding aerosols only on the hurricane periphery, where the surface wind was smaller than 22 m s−1
. This threshold is near the lower bound of
5
Beaufort 9 wind, which is defined at sea by “spray may affect visibility”. The presence of high concentrations of sea spray would most likely render ineffective any seeding of clouds with large concentrations of small CCN. Hence, warm rain is turned off only in that part of the hurricane that has winds speeds less than the threshold value.
Figure 2 illustrates the effect of turning off warm rain processes on cloud liquid water
10
content in NWRP compared to WR. One can see a dramatic increase in the LWC in clouds at the periphery of the seeded hurricane, in response to turning off the warm rain collision processes. Such an increase is consistent with past work using more sophisticated models (Khain et al., 2004, 2005; Lynn et al., 2005a, b, among others). In situ, this can be explained by the slower transformation of cloud droplets to raindrops in
15
polluted clouds that occurs because polluted clouds create many small droplets which are too small to collide and coalesce efficiently.
3 Results
The simulated data were saved every three hours. The track of the simulated storms each curved to the north at an earlier time than the observed Katrina, and each made
20
landfall about 200 km to the east of actual landfall of the observed storm (not shown). Nevertheless, the model was able to reproduce the main features of the hurricanes evolution, including the formation of the super hurricane with the minimum pressure of about 900 hPa (Fig. 3). For instance, Figs. 3a, b show the simulated surface min-imum pressure and maxmin-imum wind speeds, which are compared to the three hourly
25
observational data from the National Hurricane Center. Within three hours of simula-tion time, the modelled Katrinas had reached hurricane intensity with maximum wind
ACPD
7, 5647–5674, 2007 Simulation of hurricane response to suppression of warm rain D. Rosenfeld et al. Title Page Abstract Introduction Conclusions References Tables Figures ◭ ◮ ◭ ◮ Back CloseFull Screen / Esc
Printer-friendly Version Interactive Discussion
speed greater than 32.5 m s−1and with minimum surface pressure of at least 965 hPa
(Fig. 3a). The simulated maximum winds then approach the observed values and then quite closely agree with observations after about 15 h of simulation time (Fig. 3b). Within the first 24 h, the simulated minimum pressures were less than the control run in both NWR and NWRP. However, after this time the simulated minimum surface
pres-5
sures in NWRP are less than in WR, with a concurrent increase in maximum wind speed. In contrast, the simulated minimum pressures and maximum wind speeds in NWR remain higher and less than the control values.
Figure 4 shows vertical cross sections of azimuthally averaged fields of cloud water content (CWC), rain water content (RWC), cloud ice, temperature, pressure, relative
10
humidity, radial and tangential wind components, which are presented for each of the simulations at the times t=27:09, 27:18 and 28:21 (day in August 2005 : hour UT). In each simulation, the model reproduced the typical structure of a TC with an eye wall with strongly precipitating clouds, a warm core with negative vertical velocity in the TC eye, and the inflow layer in the lower and outflow layer in the upper troposphere. The
15
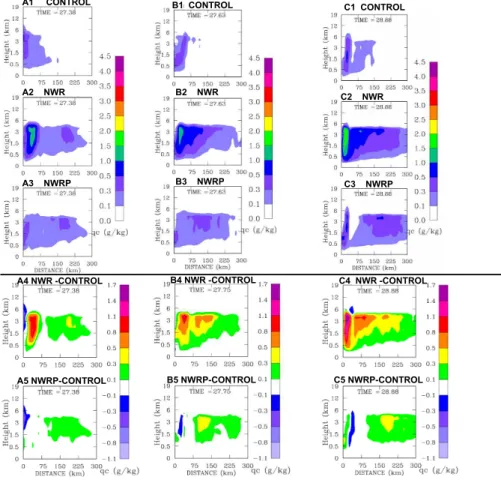
radius of maximum winds varies between 30 and 50 km from the center. According to Fig. 4a the cloud water content increased in the NWRP compared to WR, and further increased in the NWR simulation. By 24 h (t=28:00) the changes in the TC structure caused by warm rain prevention are remarkable. The main changes in microphysical structure are: the increase in CWC within the radial range annulus of 100 km–300 km
20
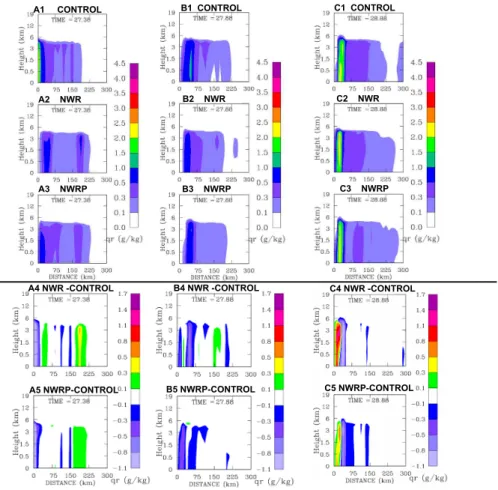
(Fig. 4a, panel B5) and a corresponding decrease in rain water content (Fig. 4c, panel B5). The spreading of the zone of enhanced CWC toward the TC center is caused by the radial TC circulation (Fig. 4e).
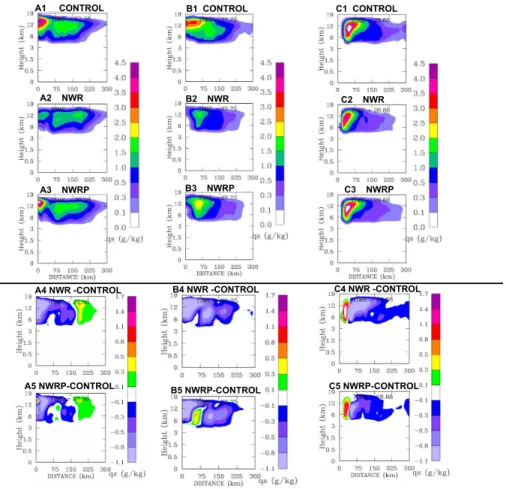
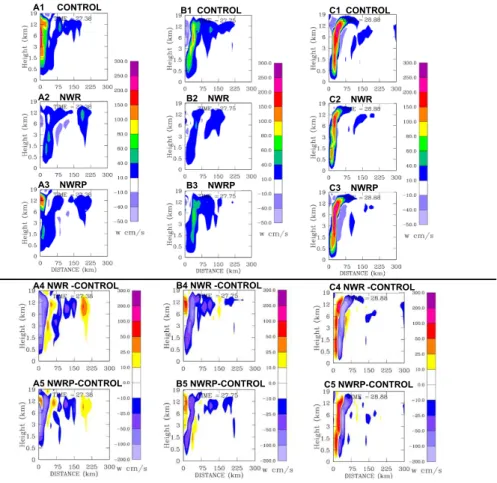
During the first 12 h, the deep convection at the periphery in NWRP is invigorated (Fig. 4d, panel A5), produces more ice at the periphery (Fig. 4b, panel A5),
precipi-25
tates (Fig. 4c, A5) and warms the upper levels (Fig. 4f, A5) more than in the control. The increase in the updraft at the TC periphery decreases the influx of the air mass to the TC center by more than 5 m s−1
(Fig. 4e, A5), leading to the weakening of the TC convection at its center, and the weakening of the TC maximum tangential wind by
ACPD
7, 5647–5674, 2007 Simulation of hurricane response to suppression of warm rain D. Rosenfeld et al. Title Page Abstract Introduction Conclusions References Tables Figures ◭ ◮ ◭ ◮ Back CloseFull Screen / Esc
Printer-friendly Version Interactive Discussion
about 5 m s−1(Fig. 4h, panel A5) in NWRP relative to that in the control run.
Suppress-ing warm rain everywhere in the NWR run had stronger effects in the same directions (panels A4 at the same figures). The area of strong winds also decreases significantly during the first 24 h (Fig. 5, panels a and b). The maximum difference in minimum TC pressures in NWRP compared to the control simulation (WR) of ∼10 hPa is reached
5
at about t=28:00 (i.e. 28 August 2005 00:00 UT), which is 24 h after the seeding run started (see Fig. 3a).
Note that the suppression of warm rain results in significant changes in the thermo-dynamic structure of the TC. The main thermothermo-dynamic changes are: the decrease in temperature at the low levels at the TC periphery and within the TC eye wall (Fig. 4f,
10
panels B5 and C5) for the NWRP run as compared to those in the natural TC (WR). The decrease at the TC periphery is caused by the enhanced evaporation of reduced sized droplets leading to a corresponding increase in the air humidity (Fig. 4g, panels B5 and C5). A significant decrease in temperature at the TC center occurred only in the NWR simulation, where warm rain was suppressed also in the eyewall.
15
After 36 h the eye of the NWRP run contracted as shown by the radius of peak winds (Fig. 5, panel d) and the central pressure correspondingly decreased (Fig. 3b). At the same time the pressure increased outside of the eye wall. This is manifested as enhanced pressure gradients at the eye wall that leads to intensification of the winds at radial distances less than 30 km while weakening the winds outside the eye wall
20
(Fig. 4h, panel C5 and Fig. 5, panel d). The relation to the suppression of warm rain is evident in Fig. 5, where the peak winds that mark the location of the eyewall occur at progressively smaller radial distances from the TC in the runs with respectively greater suppression of warm rain from the WR to NWRP and NWR simulations. At larger distances from the hurricane center, the wind speed weakens with the progressive
25
suppression of warm rain. In fact, the decreasing wind speed from WR to NWRP and NWR at the periphery of the TC is compensated near the center of the TC by the increasing peak wind speeds due to the shrinking of the eye.
ACPD
7, 5647–5674, 2007 Simulation of hurricane response to suppression of warm rain D. Rosenfeld et al. Title Page Abstract Introduction Conclusions References Tables Figures ◭ ◮ ◭ ◮ Back CloseFull Screen / Esc
Printer-friendly Version Interactive Discussion
4 Interpretation of the results
The initial result of suppression of warm rain is warming at the upper levels due to the added release of latent heat of freezing (Pathway E of Fig. 1) and enhancing the up-drafts aloft, coupled with low level melting and evaporative cooling (Pathways C and H of Fig. 1). As was shown by Khain et al. (2005), this is the typical response of maritime
5
convective clouds to suppression of warm rain due to added large concentrations of small CCN. However, about 12 h after the initial “seeding” (i.e. suppression of warm rain), the upper level warming became limited to a shallow layer above the freezing level (Fig. 4f) and the enhanced updrafts aloft vanish (Fig. 4d) in the NWRP and NWR runs. Yet, the low level cooling remains at least as strong. The enhanced low level
10
relative humidity (Fig. 4g) implies that this low level cooling occurs due to greater low level evaporation of cloud water that was not precipitated, i.e. moving energy from path-way D to pathpath-way C in Fig. 1. This means a net loss of condensation latent heating, which leads to less buoyant lower tropospheric air. The potential temperature does not change in the process of evaporation of cloud water. Therefore, this cooler air can still
15
rise in deep convection, especially when initially forced upward at the eye wall. Based on these considerations, it is suggested here that the continuous cooling at the TC periphery (Fig. 4f, panel C5), especially in the TC lowest 3 km, leads to compaction of the TC circulation which can be attributed to the lesser tendency of the more stable low level air to rise before reaching the circulation center. This is supported by the NWR
20
run that has the strongest low level cooling of the three simulations (Fig. 4f, panels A4, B4 and C4) associated with the greatest extent of suppression of warm rain. The less buoyant low level air supposedly delays rising until it more closely approaches the hurricane center, reducing the radius of the eye. This idea is also supported by the simulation results of Nong and Emanuel (2003), who showed that low level air with
25
enhanced buoyancy tends to rise before reaching the eyewall and initiate the process of an eyewall replacement with a larger eye (Houze et al., 2007). The buoyancy was enhanced in that simulation by increasing the low level relative humidity without a
ACPD
7, 5647–5674, 2007 Simulation of hurricane response to suppression of warm rain D. Rosenfeld et al. Title Page Abstract Introduction Conclusions References Tables Figures ◭ ◮ ◭ ◮ Back CloseFull Screen / Esc
Printer-friendly Version Interactive Discussion
responding decrease in the temperature.
When preventing warm rain also in the center with the NWR run, the intense evapo-rative cooling takes place within the eye as well (Fig. 4f, panels B4, C4), so the temper-ature gradient is not as strong and the central pressure of the TC is higher as compared to that in other simulations at all times. Consequently, the TC in the NWR run has the
5
largest central pressure, has weakest peak winds and smallest areal extent of hurri-cane force winds compared to the other simulations (see Figs. 3 and 5). At 29:00, near the time of the lowest minimum pressure, the radius of the area covered by hurricane force winds was 108 km for the control run, 80 km for the NWRP run and only 62 km for the NWR run (see Fig. 5f). The radius of maximum winds, which is the radius of
10
the eyewall ring, is not well correlated with the maximum wind intensity, which occurs at the eyewall. There are super hurricanes with large eyes and minimal hurricanes with small eyes. In this particular case (see Fig. 5) the progressive suppression of warm rain from WR to NWRP and NWR reduced the radius covered by hurricane force winds, but at the same time reduced the radius of the eye. This contraction of the eye
15
compensated the peak winds in the eyewall for the overall weaker winds in most of the area of the hurricane outward of radial distance of 40 km from its center. As already suggested here, this relation between the overall TC strength as defined by the radius of hurricane force winds and the compaction of the eye appears to be related to the weakening effect of the low level evaporative cooling. This cooling decreases the
ten-20
dency of air to ascend until it reaches closer to the circulation center and so shrinks the eye. It should be noted, however, that TCs often undergo periodic changes in the radius of the eye and the respective peak winds for reasons that cannot be related to aerosols (Houze et al., 2007). Fluctuations in the radius of the eye, not necessarily due to an eye replacement cycle, may explain the fluctuations in the observed intensity of
25
Katrina shown in Fig. 2.
The proposed mechanism of low level evaporative cooling due to the suppressed warm rain might explain the strong reduction of the TC intensity in the simulations that did not take sea spray aerosols into account (Cotton et al., 2007), which is similar to the
ACPD
7, 5647–5674, 2007 Simulation of hurricane response to suppression of warm rain D. Rosenfeld et al. Title Page Abstract Introduction Conclusions References Tables Figures ◭ ◮ ◭ ◮ Back CloseFull Screen / Esc
Printer-friendly Version Interactive Discussion
NWR simulation here. It can also explain why adding giant CCN that enhance warm rain attenuated the weakening effect in that simulation.
5 Discussion
The main result of the simulations is that tropical cyclone intensity and structure are apparently sensitive to aerosol concentrations. Physical arguments and numerical
sim-5
ulations indicate that it may be possible to decrease the area covered by hurricane force winds in a TC by injecting small aerosol particles below the bases of clouds located on the TC periphery 200–400 km from its center. In the simulated case the wind speed was decreased by seeding during the whole period of simulations at radial distances r>40 km (i.e. over the huge area exterior to the eye wall). The low level cooling causes
10
also a contraction of the eye and hence the relative intensification of the eyewall winds, occasionally even matching or exceeding the peak wind intensity of the control sim-ulation. Storm surge is caused by the mean wind over large areas and not by the maximum wind over very small zones. Therefore, even in the cases when peak winds at the eyewall are not reduced, if the seeding leads to a decrease of wind speed over
15
most of the area of hurricane-force winds and decreasing its areal extent, it would be an important result.
This provides the basis for seeding experiments, which are practical because wind speeds at distances greater than 200–400 km from TC centers are weak even in very strong hurricanes, which allows operative flights. Such seeding is practical on the storm
20
scale by dispersing hygroscopic smoke from 5 to 10 airplanes such as C-130 aircraft flying in the boundary layer just outside the TC spiral cloud bands so that the particles would be drawn into the storm by the low level convergence after having sufficient time to mix well in the boundary layer.
The apparent susceptibility of the vigor of tropical maritime clouds to small CCN
25
seeding opens the possibility of changing not only the TC intensity, but also its track. Since the tangential velocity (which is orthogonal to the radial velocity) at the radial
ACPD
7, 5647–5674, 2007 Simulation of hurricane response to suppression of warm rain D. Rosenfeld et al. Title Page Abstract Introduction Conclusions References Tables Figures ◭ ◮ ◭ ◮ Back CloseFull Screen / Esc
Printer-friendly Version Interactive Discussion
distances of 50–300 km in the NWRP seeded TC is smaller than that in the control run, the seeded TC moved more eastward due to the beta effect (e.g. Fiorino and Elsberry, 1989; Falkovich et al., 1995) and made landfall ∼50 km farther to the east than the non-seeded TC. Being the weakest, the TC in the NWR run shifted eastwards from the control TC even more. In addition, TCs tend to move into the zone of the most
5
developed convection at their periphery (e.g. Falkovich et al., 1995).
These simulations demonstrate that the ability to affect tropical storms is greatest in their organizational and early stages. The seeding window gradually closes with the intensification of the storms, mainly due to the expansion of the wind induced sea spray that enforces warm rain to greater radial distance from the center of the storm.
10
The simplification of the modeling of the seeding effect has to be taken into account in the interpretation of the results. On the one hand, it is hardly possible to prevent warm rain formation from maritime clouds under simulation of realistic aerosol parti-cle concentrations. However, both remote sensing (Rosenfeld, 1999; Rosenfeld and Woodley, 2003) and in situ (Andreae et al., 2004) observations of tropical clouds
inter-15
acting with smoke from forest fires demonstrate that warm rain can be shut off entirely in some circumstances. Thus, the simplification indicates the maximum possible ef-fect that could be realized using high aerosol particle concentrations. On the other hand, the utilization of the 3 km model resolution did not make it possible to resolve the clouds with characteristic scales below about 10 km, which is especially important
20
for clouds at the TC periphery. Besides, the crude resolution significantly decreases the vertical velocities and depths of resolved clouds (Khain et al., 2004). More simula-tion work with cloud models that address cloud microphysical processes explicitly and the interactions with sea spray aerosols must be done before field experiments can be considered. In any case, the best prospects are in seeding that is aimed at affecting
25
the initial organization and track of the storm.
Acknowledgements. This study was supported by the European Community–New and
Emerg-ing Science and Technologies (Contract No. 12444 (NEST)–ANTISTORM).
ACPD
7, 5647–5674, 2007 Simulation of hurricane response to suppression of warm rain D. Rosenfeld et al. Title Page Abstract Introduction Conclusions References Tables Figures ◭ ◮ ◭ ◮ Back CloseFull Screen / Esc
Printer-friendly Version Interactive Discussion
References
Andreae, M. O., Rosenfeld, D., Artaxo, P., Costa, A., Frank, G. P., Longo, K. M., and Silva-Dias, M. A. F.: Smoking rain clouds over the Amazon, Science, 303, 1337–1342, 2004.
Cotton, W. R., Pielke Sr., R. A., Walko, R. L., Liston, G. E., Tremback, C. J., Jiang, H., McAnelly, R. L., Harrington, J. Y., Nicholls, M. E., Carrio, G. G., and McFadden, J. P.: RAMS 2001:
5
Current status and future directions, Meteorol. Atmos. Phys., 82, 5–29, 2003.
Cotton, W. R., Zhang, H., McFarquhar, G. M., and Saleeby, S. M.: Should we consider polluting hurricanes to reduce their intensity?, J. Wea. Mod., in press, 2007.
Falkovich, A. I., Khain, A. P., and Ginis, I. D.: The influence of the air-sea interaction on the development and motion of a tropical cyclone: numerical experiments with a triply nested
10
model, Meteorol. Atmos. Phys., 55, 167–84, 1995.
Fiorino, M. and Elsberry, R. L.: Some aspects of vortex structure related to the tropical cyclone motion, J. Atmos. Sci., 47, 975–990, 1989.
Houze Jr., R. A., Chen, S. S., Smull, B. F., Lee, W. C., and Bell, M. M.: Hurricane intensity and eyewall replacement, Science, 315, 1235–1239, 2007.
15
Kain, J. S. and Fritsch J. M.: Convective parameterization for mesoscale models: The Kain-Fritsch scheme. The Representation of Cumulus Convection in Numerical Models, edited by: Emanuel, K. A. and Raymond, D., Amer. Meteorol. Soc., 246 pp, 1993.
Khain, A. P. and Ginis, I. D.: The mutual response of a moving tropical cyclone and the ocean, Beitr. Phys. Atmos., 64, 125–142, 1991.
20
Khain, A. P., Pokrovsky, A., Pinsky, M., Seifert, A., and Phillips V.: Effects of atmospheric aerosols on deep convective clouds as seen from simulations using a spectral microphysics mixed-phase cumulus cloud model Part 1: Model description, J. Atmos. Sci, 61, 2963–2982, 2004.
Khain, A. P., Rosenfeld, D., and Pokrovsky, A.: Aerosol impact on the dynamics and
micro-25
physics of convective clouds, Quart. J. Roy. Meteorol. Soc., 131, 2639–2663, 2005.
Lynn, B., Khain, A., Dudhia, J., Rosenfeld, D., Pokrovsky, A., and Seifert, A.: Spectral (bin) microphysics coupled with a mesoscale model (MM5). Part 2: Simulation of a CaPe rain event with squall line, Mon. Wea. Rev., 133, 59–71, 2005.
Michalakes, J., Dudhia, J., Gill, D., Henderson, T., Klemp, J., Skamarock W., and Wang, W.:
30
The Weather Research and Forecast Model: Software Architecture and Performance, Pro-ceedings of the Eleventh ECMWF Workshop on the Use of High Performance Computing in
ACPD
7, 5647–5674, 2007 Simulation of hurricane response to suppression of warm rain D. Rosenfeld et al. Title Page Abstract Introduction Conclusions References Tables Figures ◭ ◮ ◭ ◮ Back CloseFull Screen / Esc
Printer-friendly Version Interactive Discussion
Meteorology, edited by: Zwieflhofer, W. and Mozdzynski, G., World Scientific, pp 156–168, 2005.
Michalakes, J., Chen, S., Dudhia, J., Hart, L., Klemp, J., Middlecoff, J., and Skamarock, W.: Development of a Next Generation Regional Weather Research and Forecast Model. Devel-opments in Teracomputing: Proceedings of the Ninth ECMWF Workshop on the Use of High
5
Performance Computing in Meteorology, edited by: Zwieflhofer, W. and Kreitz, N., World Scientific, pp. 269–276, 2001.
Nong, S. and Emanuel, K.: A numerical study of the genesis of concentric eyewalls in hurri-canes, Quart. J. Roy. Meteorol. Soc., 129, 3323–338, 2003.
Rosenfeld, D.: TRMM Observed First Direct Evidence of Smoke from Forest Fires Inhibiting
10
Rainfall, Geophys. Res. Lett., 26(20), 3105–3108, 1999.
Rosenfeld, D.: Aerosol-Cloud Interactions Control of Earth Radiation and Latent Heat Release, Space Science Reviews, Springer, 9p. 6 December 2006, doi:10.1007/s11214-006-9053-6,
http://dx.doi.org/10.1007/s11214-006-9053-6, 2006.
Rosenfeld, D. and Woodley, W. L.: Closing the 50-year circle: From cloud seeding to space
15
and back to climate change through precipitation physics. Chapter 6 of “Cloud Systems, Hurricanes, and the Tropical Rainfall Measuring Mission (TRMM)” edited by: Wei-Kuo Tao and Adler, R., 234pp., p. 59–80, Meteorol. Mono. 51, AMS, 2003.
Saleeby, S. M. and Cotton, W. R.: A large-droplet mode and prognostic number concentration of cloud droplets in the Colorado State University Regional Atmospheric Modeling System
20
(RAMS), Part I: Module descriptions and supercell test simulations, J. Appl. Meteorol., 43, 182–195, 2004.
Segal, Y., Khain, A., Pinsky, M., and Rosenfeld, D.: Effects of hygroscopic seeding on raindrop formation as seen from simulations using a 2000-bin spectral cloud parcel model, Atmos. Res., 71, 3–34, 2004.
25
Simpson, R. H. and Malkus, J. S.: Experiments in hurricane modification, Sci. Amer., 211, 27–37, 1964.
Skamarock, W. C., Klemp, J. B., Dudhia, J., Gill, D. O., Barker, D. M., Wang W., and Powers, J. G.: A description of the Adv. Res., WRF Version 2. NCAR Tech Notes-468+STR, 88 p, 2005.
30
Thompson, G., Rasmussen, R. M., and Manning, K.: Explicit Forecasts of Winter Precipitation Using an Improved Bulk Microphysics Scheme, Part I: Description and Sensitivity Analysis, Mon. Wea. Rev., 132, 519–542, 2004.
ACPD
7, 5647–5674, 2007 Simulation of hurricane response to suppression of warm rain D. Rosenfeld et al. Title Page Abstract Introduction Conclusions References Tables Figures ◭ ◮ ◭ ◮ Back CloseFull Screen / Esc
Printer-friendly Version Interactive Discussion
Williams, E., Rosenfeld D., Madden, M., et al.: Contrasting convective regimes over the Amazon: Implications for cloud electrification, J. Geophys. Res., 107(D20), 8082, doi:10.1029/2001JD000380, 2002.
Willoughby, H. E., Jorgensen, D. P., Black, R. A., and Rosenthal, S. L.: Project STORMFURY, A Scientific Chronicle, 1962–1983, Bull. Amer. Meteorol. Soc., 66, 505–514, 1985.
5
Woodcock, A. H.: Salt nuclei in marine air as a function of altitude and wind force, J. Meteorol., 10, 362–371, 1953.
Van den Heever, S. C., Carri ´o, G. G., Cotton, W. R., Demott, P. J., and Prenni, A. J.: Impacts of Nucleating Aerosol on Florida Storms, Part I: Mesoscale Simulations, J. Atmos. Sci., 63, 1752–1775, 2006.
10
ACPD
7, 5647–5674, 2007 Simulation of hurricane response to suppression of warm rain D. Rosenfeld et al. Title Page Abstract Introduction Conclusions References Tables Figures ◭ ◮ ◭ ◮ Back CloseFull Screen / Esc
Printer-friendly Version Interactive Discussion C: Cloud drop evaporative Cooling B. Condensational warming
D: Precipitation fixing the condensational warming F: Latent heat release
of vapor ice deposition
G: Warmed Ice cloud
H: Latent heat uptake of melting
A: Surface latent and sensible heating
I: Ice evaporative Cooling at hurricane periphery
E: Latent heat release of freezing cloud drops
Fig. 1. Energy pathways in the convective clouds that energize hurricanes. The heat that is
taken from the sea surface mainly by evaporation (A) is released when the vapor condenses into cloud drops (B). Some of this released heat is reclaimed if the drops re-evaporate (C) and return to vapor. The heat remains in the air if the drops precipitate as rain (D). Drops that ascend to the sub-zero parts of the cloud freeze there and release additional latent heat of freezing (E), which along with the freezing of ascending vapor warm the upper levels of the cloud (G). Some of the heat is lost when ice evaporates aloft (I). The rest of the heat remains in the cloud when the ice hydrometeors precipitate and melt while cooling the air below (H). Seeding by small CCN to suppress warm rain (D) would increase the warming aloft (E and G) and evaporative cooling at the lower levels (C and H).
ACPD
7, 5647–5674, 2007 Simulation of hurricane response to suppression of warm rain D. Rosenfeld et al. Title Page Abstract Introduction Conclusions References Tables Figures ◭ ◮ ◭ ◮ Back CloseFull Screen / Esc
Printer-friendly Version Interactive Discussion
Control Seeded NWRP
Fig. 2. Maximum cloud water contents in clouds of “natural” and “seeded” hurricane runs at 27
July 2005 18:00 UT. “Seeding” leads to a significant increase in mass of cloud water reaching supercooled levels, especially at the storm periphery.
ACPD
7, 5647–5674, 2007 Simulation of hurricane response to suppression of warm rain D. Rosenfeld et al. Title Page Abstract Introduction Conclusions References Tables Figures ◭ ◮ ◭ ◮ Back CloseFull Screen / Esc
Printer-friendly Version Interactive Discussion 890 900 910 920 930 940 950 960 970 980 990 27 27.5 28 28.5 29 29.5 Observed and Simulated Minimum Pressure
Observed Control NWRP NWR Mi n imu m p re s su re (h Pa )
Time (decimal day in August 2005) A 20 30 40 50 60 70 27 27.5 28 28.5 29 29.5 Observed and Simulated Maximum Wind Speeds
Observed Control NWRP NWR Ma xi mu m W in d Sp e e d s (m s -1 )
Time (decimal day in August 2005) B
Fig. 3. Time dependence of minimum surface pressure (A) and maximum wind speed (B) in
three simulations: Control warm rain (WR) marked red, NWR (no warm rain allowed) marked green and NWRP (no warm rain allowed at the TC periphery) marked blue. The observed values of Katrina are shown by the thin black line. The deviation of pressure in the numerical simulations from that in real Katrina can be attributed to inexact assimilation of initial data in the model.
ACPD
7, 5647–5674, 2007 Simulation of hurricane response to suppression of warm rain D. Rosenfeld et al. Title Page Abstract Introduction Conclusions References Tables Figures ◭ ◮ ◭ ◮ Back CloseFull Screen / Esc
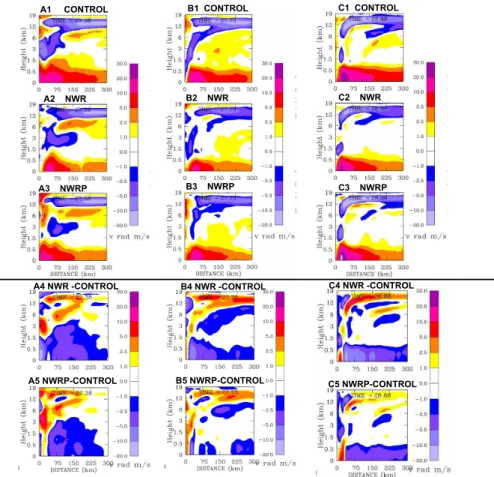
Printer-friendly Version Interactive Discussion A1 CONTROL A2 NWR B1 CONTROL A3 NWRP A4 NWR -CONTROL A5 NWRP-CONTROL C1 CONTROL B2 NWR C2 NWR B3 NWRP C3 NWRP B4 NWR -CONTROL C4 NWR -CONTROL B5 NWRP-CONTROL C5 NWRP-CONTROL
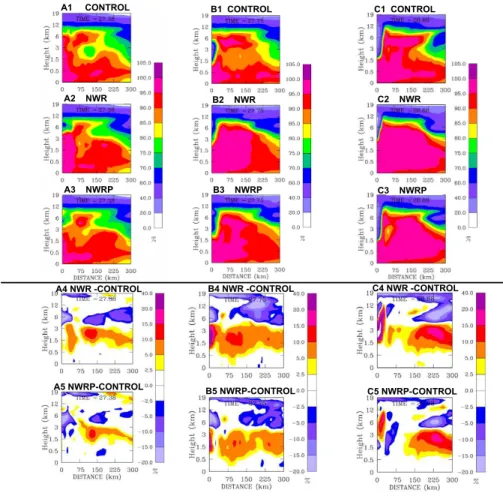
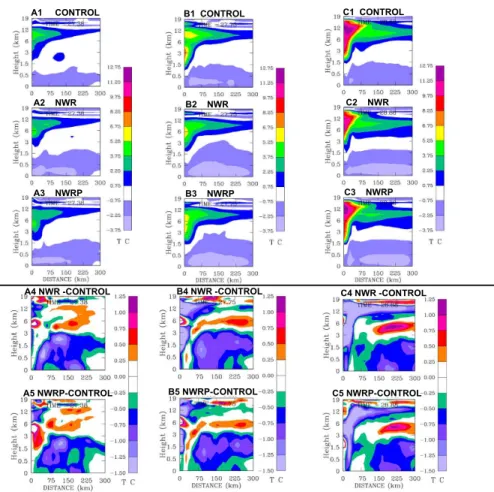
Fig. 4a. Vertical-radial cross sections of the azimuthally averaged cloud water content (CWC) in
three simulations at different time instances (upper panels) and the differences of CLW between the NWR and NWRP on one hand and control (WR) simulations. The panels are marked by letters (A, B, C) denoting different time instances and by the times in decimals of day.
ACPD
7, 5647–5674, 2007 Simulation of hurricane response to suppression of warm rain D. Rosenfeld et al. Title Page Abstract Introduction Conclusions References Tables Figures ◭ ◮ ◭ ◮ Back CloseFull Screen / Esc
Printer-friendly Version Interactive Discussion A1 CONTROL A2 NWR B1 CONTROL A3 NWRP A4 NWR -CONTROL A5 NWRP-CONTROL C1 CONTROL B2 NWR C2 NWR B3 NWRP C3 NWRP B4 NWR -CONTROL C4 NWR -CONTROL B5 NWRP-CONTROL C5 NWRP-CONTROL
Fig. 4b. The same as in Fig. 4a, but for ice content.
ACPD
7, 5647–5674, 2007 Simulation of hurricane response to suppression of warm rain D. Rosenfeld et al. Title Page Abstract Introduction Conclusions References Tables Figures ◭ ◮ ◭ ◮ Back CloseFull Screen / Esc
Printer-friendly Version Interactive Discussion A1 CONTROL A2 NWR B1 CONTROL A3 NWRP A4 NWR -CONTROL A5 NWRP-CONTROL C1 CONTROL B2 NWR C2 NWR B3 NWRP C3 NWRP B4 NWR -CONTROL C4 NWR -CONTROL B5 NWRP-CONTROL C5 NWRP-CONTROL
Fig. 4c. The same as in Fig. 4a, but for rain water content.
ACPD
7, 5647–5674, 2007 Simulation of hurricane response to suppression of warm rain D. Rosenfeld et al. Title Page Abstract Introduction Conclusions References Tables Figures ◭ ◮ ◭ ◮ Back CloseFull Screen / Esc
Printer-friendly Version Interactive Discussion A1 CONTROL A2 NWR B1 CONTROL A3 NWRP A4 NWR -CONTROL A5 NWRP-CONTROL C1 CONTROL B2 NWR C2 NWR B3 NWRP C3 NWRP B4 NWR -CONTROL C4 NWR -CONTROL B5 NWRP-CONTROL C5 NWRP-CONTROL
Fig. 4d. The same as in Fig. 4a, but for vertical velocity.
ACPD
7, 5647–5674, 2007 Simulation of hurricane response to suppression of warm rain D. Rosenfeld et al. Title Page Abstract Introduction Conclusions References Tables Figures ◭ ◮ ◭ ◮ Back CloseFull Screen / Esc
Printer-friendly Version Interactive Discussion A1 CONTROL A2 NWR B1 CONTROL A3 NWRP A4 NWR -CONTROL A5 NWRP-CONTROL C1 CONTROL B2 NWR C2 NWR B3 NWRP C3 NWRP B4 NWR -CONTROL C4 NWR -CONTROL B5 NWRP-CONTROL C5 NWRP-CONTROL
Fig. 4e. The same as in Fig. 4a, but for radial velocity field.
ACPD
7, 5647–5674, 2007 Simulation of hurricane response to suppression of warm rain D. Rosenfeld et al. Title Page Abstract Introduction Conclusions References Tables Figures ◭ ◮ ◭ ◮ Back CloseFull Screen / Esc
Printer-friendly Version Interactive Discussion A1 CONTROL A2 NWR B1 CONTROL A3 NWRP A4 NWR -CONTROL A5 NWRP-CONTROL C1 CONTROL B2 NWR C2 NWR B3 NWRP C3 NWRP B4 NWR -CONTROL C4 NWR -CONTROL B5 NWRP-CONTROL C5 NWRP-CONTROL
Fig. 4f. The same as in Fig. 4a, but for the temperature field.
ACPD
7, 5647–5674, 2007 Simulation of hurricane response to suppression of warm rain D. Rosenfeld et al. Title Page Abstract Introduction Conclusions References Tables Figures ◭ ◮ ◭ ◮ Back CloseFull Screen / Esc
Printer-friendly Version Interactive Discussion A1 CONTROL A2 NWR B1 CONTROL A3 NWRP A4 NWR -CONTROL A5 NWRP-CONTROL C1 CONTROL B2 NWR C2 NWR B3 NWRP C3 NWRP B4 NWR -CONTROL C4 NWR -CONTROL B5 NWRP-CONTROL C5 NWRP-CONTROL
Fig. 4g. The same as in Fig. 4a, but for the relative humidity.
ACPD
7, 5647–5674, 2007 Simulation of hurricane response to suppression of warm rain D. Rosenfeld et al. Title Page Abstract Introduction Conclusions References Tables Figures ◭ ◮ ◭ ◮ Back CloseFull Screen / Esc
Printer-friendly Version Interactive Discussion A1 CONTROL A2 NWR B1 CONTROL A3 NWRP A4 NWR -CONTROL A5 NWRP-CONTROL C1 CONTROL B2 NWR C2 NWR B3 NWRP C3 NWRP B4 NWR -CONTROL C4 NWR -CONTROL B5 NWRP-CONTROL C5 NWRP-CONTROL
Fig. 4h. The same as in Fig. 4a, but for the tangential velocity.
ACPD
7, 5647–5674, 2007 Simulation of hurricane response to suppression of warm rain D. Rosenfeld et al. Title Page Abstract Introduction Conclusions References Tables Figures ◭ ◮ ◭ ◮ Back CloseFull Screen / Esc
Printer-friendly Version Interactive Discussion 0 10 20 30 40 50 60 0 50 100 150 200 250 300 WR NWRP NWR W in d S p e e d (m s -1)
Radial distance from TC center (km)
27:18 A 0 10 20 30 40 50 60 0 50 100 150 200 250 300 WR NWRP NWR W in d S p e e d (m s -1)
Radial distance from TC center (km)
28:00 B 0 10 20 30 40 50 60 0 50 100 150 200 250 300 WR NWRP NWR W in d S p e e d (m s -1)
Radial distance from TC center (km)
28:06 C 0 10 20 30 40 50 60 0 50 100 150 200 250 300 WR NWRP NWR W in d S p e e d (m s -1)
Radial distance from TC center (km)
28:12 D 0 10 20 30 40 50 60 0 50 100 150 200 250 300 WR NWRP NWR W in d S p e e d (m s -1)
Radial distance from TC center (km)
28:18 E 0 10 20 30 40 50 60 0 50 100 150 200 250 300 WR NWRP NWR W in d S p e e d (m s -1)
Radial distance from TC center (km)
29:00
F
Fig. 5. The simulated radially averaged wind speed of the warm rain (WR) run, No Warm
Rain in the Periphery (NWRP) run, and No Warm Rain (NWR) run, during the evolution of the hurricane. Note the decreasing wind speed from WR to NWRP and NWR and the opposite effect of increasing peak wind speeds due to the decreasing radius of the eye.