HAL Id: hal-00301566
https://hal.archives-ouvertes.fr/hal-00301566
Submitted on 1 Jan 2002
HAL is a multi-disciplinary open access
archive for the deposit and dissemination of
sci-entific research documents, whether they are
pub-lished or not. The documents may come from
teaching and research institutions in France or
abroad, or from public or private research centers.
L’archive ouverte pluridisciplinaire HAL, est
destinée au dépôt et à la diffusion de documents
scientifiques de niveau recherche, publiés ou non,
émanant des établissements d’enseignement et de
recherche français ou étrangers, des laboratoires
publics ou privés.
of Mt. Pinatubo and effects on atmospheric tracers
G. Pitari, E. Mancini
To cite this version:
G. Pitari, E. Mancini. Short-term climatic impact of the 1991 volcanic eruption of Mt. Pinatubo and
effects on atmospheric tracers. Natural Hazards and Earth System Science, Copernicus Publications
on behalf of the European Geosciences Union, 2002, 2 (1/2), pp.91-108. �hal-00301566�
c
European Geophysical Society 2002
Natural Hazards
and Earth
System Sciences
Short-term climatic impact of the 1991 volcanic eruption of Mt.
Pinatubo and effects on atmospheric tracers
G. Pitari and E. Mancini
Dipartimento di Fisica, Universit`a de L’Aquila, L’Aquila, Italy Received: 17 April 2001 – Accepted: 19 September 2001
Abstract. Large explosive volcanic eruptions are capable of injecting considerable amounts of particles and sulphur gases (mostly sulphur dioxide) above the tropopause, caus-ing increases in the stratospheric aerosol optical depth that may be even larger than one order of magnitude. The e-folding particle lifetime in the stratosphere is much longer than in the troposphere (one year versus a few days) so that climatic perturbations in a timeframe of a few years are pro-duced after major volcanic eruptions. A climate-chemistry coupled model is used here to study the dynamical effects of the radiative forcing due to stratospheric aerosols formed after the June, 1991 cataclysmic eruption of Mt. Pinatubo in the Philippines. It is shown that the dynamical perturba-tion is twofold: (a) the stratospheric mean meridional circu-lation is affected by local aerosol radiative heating (mostly located in the tropical lower stratosphere); (b) the planetary wave propagation in the mid- to high-latitude lower strato-sphere is altered as a consequence of decreasing atmospheric stability due to the climatic perturbation. Dynamical results of the climate model are compared with available observa-tions; a discussion is made regarding the similarities with the dynamical regime of the easterly phase of the equatorial quasi-biennial oscillation. Major findings of this study are: (a) radiatively forced changes in the stratospheric circulation during the first two years after the eruption may, to a large ex-tent, explain the observed trend decline of long-lived green-house gases (CH4and N2O, in particular); (b) the dynamical perturbation helps explain why simple photochemical stud-ies of the ozone trends during 1991–1993 generally fail in reproducing the satellite observed feature consisting of a 2% additional global ozone depletion during 1993 with respect to 1992. In both cases we conclude that an increase in the mid- to high-latitude downward flux at the tropopause is the key factor for explaining the behaviour of these atmospheric tracers during 1991/92.
Correspondence to: G. Pitari (gianni.pitari@aquila.infn.it.)
1 Introduction
Background stratospheric sulphate particles are often per-turbed by new aerosol formation starting from sulphur diox-ide (SO2) or hydrogen sulfide (H2S) injected in situ by vol-canic eruptions. In the case of large explosive eruptions, the aerosol optical thickness may increase by more than one order of magnitude. These additional stratospheric parti-cles may play an important role in the chemical budget of the middle atmosphere, producing catastrophic ozone losses (Prather, 1992) and may also add a significant radiative forc-ing on global climate in a timeframe of a few years (Hansen et al., 1992). The 1991/92 mid-latitude observations col-lected by Fahey et al. (1993) have clearly shown the effect of the additional Pinatubo aerosols on stratospheric chem-istry. A time-dependent model exercise carried out for the WMO (1999) ozone assessment has shown that the pho-tochemical perturbation produced by the Pinatubo aerosols during 1992/93 can roughly explain the magnitude of ozone depletion observed by the Total Ozone Mapping Spectrom-eter (TOMS) (McPSpectrom-eters et al., 1996), although some time-dependent features of the ozone depletion are not correctly captured. Additional radiation scattering and absorption by the volcanic particles may also perturb the ozone distribu-tion through photolysis rates and circuladistribu-tion changes in the stratosphere (Kinne et al., 1992; Pitari and Rizi, 1993; Schoe-berl et al., 1993; Kirchner et al., 1999). The historical record of major volcanic eruptions since 1750 is reported in Ta-ble 1 (Simkin and Siebert, 1994). SO2 loading is taken from Stoiber et al. (1987), the volcanic explosivity index (VEI) from Simkin and Siebert (1994), the dust veil index (DVI) from Lamb (1970) and Robock and Free (1995), the ice core volcanic index (IVI) from Robock and Free (1995), the mean temperature changes from Angell and Korshover (1985) (Northern Hemisphere, ’*’) and Jones (1994) ( global, ‘+’). The IVI is the average of Northern Hemisphere (NH) and Southern Hemisphere (SH) values and represents the op-tical depth at 0.55 µm. Pinatubo data are from Bluth et al. (1992) (SO2) and Stowe et al. (1992) (optical depth).
Table 1. Major volcanic eruptions of the past 250 years (see text for symbols). VEI = volcanic explosivity index; DVI = dust veil index;
IVI = ice core volcanic index; ‘*’ = Northern Hemisphere; ‘+’ = Global
Volcano Latitude Year VEI DVI SO2(Tg) IVI 1T (K)
Laki 64 N 1783 4 2300 43–65 0.19 −0.14* Tambora 8 S 1815 7 3000 34–175 0.50 0.18* Cosiguina 13 N 1835 5 4000 0.11 −0.32* Askja 65 N 1875 5 1000 0.01 Krakatau 6 S 1883 6 1000 15 0.12 −0.25* Tarawera 38 S 1886 5 800 0.04 SantaMaria 15 N 1902 6 600 0.05 −0.14* Ksudach 52 N 1907 5 500 0.02 Katmai 58 N 1912 6 500 12 0.15 Agung 8 S 1963 4 800 12 0.06 −0.31* St.Helens 46 N 1980 5 500 2.1 0.00 El Chich´on 17 N 1982 5 800 3.3–10 0.06 −0.12+ Pinatubo 15 N 1991 6 1000 20 0.13 −0.20+
Angell and Korshover (1985) have calculated the NH surface temperature changes as the difference between the five-year interval immediately after and before the volcanic episodes, with a negative value indicating a cooling after the eruption. The tabulated difference is calculated as the aver-age of 11 stations (New Haven in North America and 10 Eu-ropean stations). Global temperature changes after 1980 are obtained from detrended data (Jones, 1994; IPCC, 1999) av-eraged over a four-year period after and before the eruptions. A possible explanation for the Tambora data is suggested by Angell and Korshover (1985): a hemispheric temperature re-covery following a decadal minimum at the time of the erup-tion could have masked the volcanic cooling. Rampino and Self (1984) have defined the NH change as the difference be-tween the lowest mean annual temperature in the three years following the eruption and the mean temperature in the year immediately before the eruption. In this case the hemispheric
1T after Tambora is found to range between -0.4 and -0.7 K. In this work a model study of the climatic impact of the 1991 eruption of Mt. Pinatubo is presented, with emphasis on the related short-term anomalies produced on the large-scale atmospheric circulation. The numerical model adopted here is a climate-chemistry coupled model (CCM), with on-line interactive aerosol microphysics. The latter is treated in a mass-converving numerical module including gas-particle interactions, with explicit prediction of the aerosol size dis-tribution. The major goal of this study is to show that radia-tively forced changes in the stratospheric circulation during the first two years after the eruption may, to a large extent, explain the observed behaviour of long-lived atmospheric tracers (CH4and N2O, in particular) and may also help ex-plain why simple photochemical studies of the ozone trends during 1991–1993 generally fail in reproducing some time-dependent features resulting from satellite measurements (in particular, the 1993 additional O3depletion with respect to 1992). The paper is organized with: (1) a preliminary sur-vey of stratospheric volcanic aerosols, summarizing the most
relevant published results on the Pinatubo impact over the atmosphere; (2) a short presentation of the main model fea-tures; (3) a discussion of the most relevant model results on climate forcing and dynamical anomalies calculated for the years 1991–1993.
2 Survey on stratospheric volcanic aerosols
2.1 Sources and processes
Stratospheric sulphate aerosols (SSA) are normally super-cooled solutions of sulphuric acid (H2SO4) and water vapour produced by gas condensation on pre-existing Aitken nuclei, mostly coming from the tropical tropopause, after an ini-tial coating by H2SO4/H2O (heterogeneous nucleation). An alternative process may be gas condensation on molecular clusters formed via hetero-molecular homogeneous nucle-ation of H2SO4 and H2O. Sulphuric acid, in turn, is chem-ically produced by SO2 oxidation, while the main strato-spheric sources of sulphur dioxide are short-wave photol-ysis of carbonyl sulfide (OCS), upward transport from the tropical tropopause and, sporadically direct in situ injection by explosive volcanic eruptions. H2SO4/H2O homogeneous nucleation is particularly efficient when the sulphuric acid saturation ratio is much larger than unity, i.e. at very cold temperatures (i.e. polar vortex) or primarily under volcani-cally perturbed conditions of the stratospheric sulphur bud-get. During the first week after sulphur gas injection into the stratosphere, ultrafine sulphate aerosols with r<0.01 µm increase by several orders of magnitude (NASA, 1992). Con-densation growth and coagulation will then produce optically active particles in the accumulation mode (r>0.1 µm).
The particle size distribution at a given location is deter-mined by simultaneous microphysical processes (heteroge-neous and homoge(heteroge-neous nucleation, condensation growth, evaporation, coagulation) and by large-scale transport and
gravitational sedimentation. Once the particles penetrate downward through the mid-latitude tropopause, they can be removed by wet and dry deposition. This downward motion is mainly produced by large-scale advective transport; grav-itational sedimentation is another important removal mech-anism, although the lower stratospheric settling deposition is faster than advective downward motion only for particles with radius larger than 1 µm. This process, however, is im-portant in determining the aerosol vertical profile in the mid-stratosphere.
The altitude of gas and particulate emission from volca-noes is normally estimated in terms of the volcanic explosiv-ity index, i.e. a logarithmic measure of the magnitude of the eruption, including volume of the ejecta and plume height (Newhall and Self, 1982). Explosive emissions with VEI<4 or quiescent degassing disperse the ejecta at different alti-tudes in the troposphere, depending on VEI or on the altitude of the plate. If VEI ≥4, the injection takes place directly into the stratosphere. As shown by Pinto et al. (1989), emitted gases are essentially H2O, CO2, SO2, H2, CO, HCl, and HBr, with water vapour being the main constituent (about 80% by volume), and SO2 the most important in terms of climatic impact (about 4.5% by volume).
Volcanic emissions also consist of solid particles (ash) that have typical radii larger than about 1 µm (NASA, 1992). The amount of emitted volcanic dust is highly variable depend-ing on the dust veil index of an explosive eruption (Lamb, 1970). The estimated dust flux reported in IPCC (1994) for the 1980s may vary between lower and upper values of 4 and 10 000 Tg/yr, with a ‘best’ estimate of 33 Tg/yr. The latter is representative of the continuous eruptive activity, and is about two orders of magnitude smaller than soil dust emis-sion. The upper value, on the other hand, is the order of mag-nitude of volcanic dust mass emitted during large explosive eruptions. The stratospheric lifetime of these coarse parti-cles, however, is only about 1–2 months (NASA, 1992), due to the efficient removal by gravitational sedimentation.
Sulphur emissions occur mainly in the form of SO2, even though other sulphur species may be present in the volcanic plume, namely H2S. Nevertheless, the error made, assuming that all the emitted sulphur is in the form of SO2, is likely to be a small one, due to the relatively short H2S lifetime: in the troposphere, typical OH concentrations will oxidate H2S into SO2in less than 2 days. In the lower stratospheric mid-latitudes, however, the H2S lifetime is of the order of 10 days. This is indeed the case of the 1980 eruption of Mt. St. Helens, when a large H2S output was reported in the gas plume soon after the eruption (Hobbs et al., 1981). In such cases, a de-layed formation of H2SO4 coupled to an efficient removal of large particles by gravitational sedimentation may glob-ally allow for sulphuric acid to condense onto smaller parti-cles, thus prolonging the volcanic SSA residence time into the stratosphere.
The lifetime of volcanic SO2in the stratosphere is a func-tion of local abundance of OH, so that it may vary depend-ing on the location of the volcanic injection and also on the chemical and optical feedbacks of the emitted SO2and
par-ticles. Modeling studies (Pinto et al., 1989; Bekki et al., 1996) showed that for anomously large SO2injections (i.e. >10 Tg-SO2), the SO2lifetime in the lower stratosphere, as well as the aerosol size and residence time, become depen-dent on the sulphur loading in a nonlinear way.
2.2 The Pinatubo case
Atmospheric effects of the 1991 Pinatubo eruption have been monitored with great detail. An extensive overview of the evolution of the Pinatubo cloud derived from different mea-surements is given by Russel et al. (1996). The e-folding time for SO2 removal from the stratosphere has been estimated using satellite measurements: estimates are 33 days in the 21–31 km layer from the UARS Microwave Limb Sounder (MLS) instrument (Read et al., 1993) and 35 days from TOMS (Bluth et al., 1992). The e-folding time for aerosol de-cay in the whole stratosphere is estimated to be 11.4 months from the Stratospheric Aerosol and Gas Experiment (SAGE-II) (Weisenstein et al., 1997) and 8.8 months from the Ad-vanced Very High Resolution Radiometer (AVHRR) for the 20S to 30N region (Grant et al., 1996).
Microphysical processes of aerosol formation and growth are important in determining the actual residence time of vol-canic aerosols in the stratosphere. These processes are capa-ble of determining the particle size distribution and then the sedimentation loss rate. To some extent, the stratospheric lifetime of volcanic aerosols is again a function of the loca-tion and amount of SO2injection and also of the time scale of latitudinal transport in the middle atmosphere. The latter, in turn, is partially affected by the phase of the quasi-biennal oscillation of equatorial winds (QBO) and by aerosol heat-ing (Trepte and Hitchman, 1992; Trepte et al., 1993; Pitari, 1993). Interactive numerical simulations of the Pinatubo aerosol evolution (Young et al., 1994; Fairlie, 1995; Timm-reck et al., 1999) emphasize the role of aerosol induced heat-ing.
Few months after the eruption, the peak of stratospheric sulphate aerosol mass and optical thickness is reached (Stowe et al., 1992; McCormick et al., 1995). Assuming at this stage a global stratospheric optical depth of the order of 0.15 at 0.55 µm, a total time of 4 years is needed to come back to the background value of about 0.003 (WMO, 1992; McCormick and Veiga, 1992) using one year as e-folding time for the volcanic aerosol decay. This is of course im-portant in terms of climate forcing: for the Pinatubo case, Hansen et al. (1992) showed that a radiative forcing of about -4 Wm−2 was reached at the beginning of 1992, decaying exponentially to 0.1 Wm−2in 4 years roughly.
The particle size distribution is also important in deter-mining the actual radiative forcing of a given load of strato-spheric sulphate aerosols: Lacis et al. (1992) have shown that the particle effective radius is a critical parameter. Using the El Chich´on particle size distributions reported by Oberbeck et al. (1983) and Hofmann and Rosen (1983), they have cal-culated a tropopause forcing of the order of -2.5 Wm−2up to about -5.0 Wm−2. These values correspond to an
effec-tive radius of the order of 0.5 µm, while the forcing would be about 2 Wm−2at 1.5 µm, and would even become a posi-tive forcing (i.e. surface warming) with effecposi-tive radii larger than about 2 µm. Detailed global model calculations of the Pinatubo aerosol radiative forcing are given by Stenchikov et al. (1998): they have used a combination of SAGE-II aerosol extinction, effective radii retrieved from the Upper Atmosphere Research Satellite (UARS), and other satellite and ground-based observation’s to develop a complete set of aerosol parameters for 2 years after the eruption.
The enhancement of the stratospheric sulphate aerosol layer has also the indirect effect of producing more reactive chlorine and bromine through heterogeneous chemical reac-tions, resulting in additional ozone depletion (Prather, 1992). After the Pinatubo eruption the change in global ozone with respect to 1979 was about twice as large than immediately before the eruption (McPeters et al., 1996). Tropical ozone changes could also be caused by circulation changes due to enhanced radiative heating (Kinne et al., 1992; Schoeberl et al., 1993). The climate forcing of present time stratospheric ozone changes has been estimated to be 0.1 – 0.2 Wm−2, ex-cluding post-Pinatubo years (Hansen et al., 1997; Foster and Shine, 1997). The 1992/94 ozone depletion could then ac-count for a radiative forcing of comparable magnitude, which is, however, much smaller than the direct aerosol forcing from Pinatubo, at least for the first two years following the eruption (roughly -4 to -1Wm−2).
Emissions of water vapour have negligible direct climatic and chemical effects, even if the fraction of water in canic gases at the plate is generally greater than 80% by vol-ume. Typically, the amount of emitted H2O would increase the global stratospheric burden of water vapour by no more than about 10%, even for eruptions comparable to Pinatubo. This is because the actual amount of H2O reaching the strato-sphere is limited by condensation in rising volcanic plumes. For the Earth’s largest known eruption of Toba 73 Kyr ago, Bekki et al. (1996) assumed that 27 000 Mt H2O reached the stratosphere, (about 5% of the total released water vapour), but even in this extreme case the impact on stratospheric chemistry was found to be small.
On the other hand, two potentially important indirect ef-fects of volcanic H2O in the stratosphere should be men-tioned: first, the increase in OH which speeds up SO2 ox-idation into H2SO4, and second, the increase in the homo-geneous nucleation rate for the formation of H2SO4/H2O molecular clusters. The importance of the first indirect ef-fect is limited by the fact that the abundance of HOxradicals varies as the square root of the concentration of water, while the second effect may increase the stratospheric aerosol life-time through a less efficient particle removal by sedimen-tation (there would be more small particles with respect to environmental conditions less favourable to H2O/H2SO4 homogeneous nucleation). Some global model simulations of Pinatubo aerosols including microphysics have shown the importance of homogeneous nucleation in determin-ing aerosol mass and extinction (Ricciardulli et al., 1996; Weisenstein et al., 1997).
3 Model description and experiment setup
3.1 Description of numerical models
The model used in the present study is a low-resolution three-dimensional CCM. The chemical-transport module (CTM) uses a horizontal grid of 19 points in latitude and 18 in lon-gitude (10 ×20◦resolution) and extends from the ground to about 71 km altitude. A log-pressure vertical coordinate is used with 26 levels, corresponding to an approximate alti-tude resolution of 2.84 km, for a total of 19 ×18× 26 grid-points. The main features of this model have been described in Pitari and Mancini (2001). All transport fields are taken off-line from a spectral quasi-geostrophic general circulation climate model (GCM). The advective transport is formulated in flux form with the horizontal velocity fields u,v calculated in terms of a velocity stream function and a velocity poten-tial, both taken from the daily output of the GCM (Pitari, 1993). The vertical velocity w is calculated from the mass continuity equation. The numerical scheme for transport is Eulerian fully explicit, using a 1.0 h time increment.
A small horizontal diffusion is used for numerical stabil-ity purposes, being about 106m2s−1in the troposphere and 2 × 10⁵m2s−1in the stratosphere for mid- to high-latitudes. Values in the tropics (20S–20N) are one order of magni-tude smaller. A vertical diffusion coefficient Kzz is used to simulate those small-scale transport processes not explicitly included in the model. Kzz is assigned with large values in the boundary layer (10 m2s−1) decreasing to 0.1 m2s−1 in the lower stratosphere at mid-to high-latitudes and to 0.02 m2s−1in the tropics. The effect of gravity wave break-ing is simulated by increasbreak-ing Kzz in the upper stratosphere and mesosphere and using a Rayleigh friction coefficient in the momentum equation in the GCM. Tropospheric convec-tion is included following the scheme described in Muller and Brasseur (1995).
All chemical species are diurnally-averaged; diurnal vari-ations of N2O5 are parameterized following Brasseur and Solomon (1984), also including the removal from heteroge-neous reactions on both sulphate polar stratospheric cloud (PSC) aerosols. Some species are assumed to be present only during daytime (O, O(1D), H, OH, HO2, NO, Cl, ClO, Br, BrO). The 24 h averaged photodissociation rates are calcu-lated daily (i.e. every 24 model hours) and include the ef-fects of Rayleigh and Mie scattering. All medium and short-lived chemical species are grouped in families: Ox(O3+ O + O(1D)), NOy (NOx+ HNO3), NOx(NO + NO2+ NO3+ 2N2O5+ HNO4+ PAN + ClONO2+ BrONO2), HOx(H2O2 + HO2 + OH + H), CHOx (CH3O2 + CH3OOH + CH2O), Cly(Cl + ClO + 2ClOOCl + HOCl + ClONO2+ HCl), Bry (Br + BrO + HOBr + BrONO2+ HBr), SOx(SO2+ H2SO4), aerosols. Long-lived and surface-flux species included in the model are N2O, CH4, H2O, CO, C2H6, C2H4, C3H6, C5H8, C10H16, other HC, CFCs, HCFCs, halons, OCS, CS2, DMS, H2S, SO2for a total of 40 transported species (plus 57 aerosol size categories) and 26 species at photochemi-cal equilibrium. Photochemiphotochemi-cal terms are photochemi-calculated with
the same time frequency of advective tendencies. All photo-chemical data are taken from JPL (1997), including the het-erogeneous reactions on sulphate and PSC aerosols.
The model includes the major components of tropospheric aerosols (sulphate, carbonaceous, dust, sea salt). The size distribution of sulphate (tropospheric and stratospheric) and PSC aerosols are calculated using a fully interactive and mass conserving microphysical code for aerosol formation and growth. Denitrification and dehydration due to PSC sed-imentation are calculated explicitly from the nitric acid tri-hydrate (NAT) and ice aerosols size distribution. The abun-dance of stratospheric sulphate aerosols is calculated as a function of water vapour and sulphuric acid concentrations (Pitari et al., 1993). The latter is obtained taking into ac-count OH oxidation of sulphur dioxide, which, in turn, may be perturbed by in-situ injections (as from aircraft or volca-noes).
The general circulation climate model (GCM) is widely described in the literature. For details on the major dy-namical features (temperature, wind fields, planetary waves, sudden warmings, radiation, surface temperature balance) and on the ozone prediction capabilities (transport, mid-latitude heterogeneous chemistry, polar chemistry, ozone hole, trends), we refer to published papers (Pitari et al., 1992; Pitari, 1993; Pitari et al., 1997; NASA, 1999). In particular, the wave activity in the GCM is sufficiently strong to sporad-ically produce sudden stratospheric warming events in the Arctic winter months (Pitari et al., 1992), and the O3 clima-tology (including the Antarctic springtime hole) is normally well reproduced in the model (Pitari, 1993).
3.2 Experiment setup and model initialization
The coupling between the two models (CTM and GCM) is made via the dynamical fields (GCM ⇒ CTM) and via the radiatively active species (H2O, CH4, N2O, CFCs, O3, NO2, aerosols: CTM ⇒ GCM). The strategy adopted for the present numerical experiment is to run the CTM at steady state with an atmospheric circulation appropriate for 1990. Starting with such a distribution of chemical species, we have run the GCM for 10 consecutive ‘1990’ years after a 2-year spin-up: data averaging over the 10-year simulation allows for a satisfactory filtering of the natural year-to-year dynam-ical fluctuations in the stratosphere. As a final step, the full CCM has been run 10 times for 1991–1993 starting with the end-of-year dynamical fields from the preliminary ‘perpetual 1990’ GCM run. In this first experiment, radiation and chem-istry codes make use of the interactively calculated aerosols, so that the Pinatubo aerosol radiative feedback on circula-tion is taken into account in the CCM (experiment ‘I’, or ‘In-teractive aerosols’). Another experiment is made parallel to ‘I’, but here radiation and chemistry codes use the off-line calculated ‘1990’ pre-Pinatubo sulphate aerosol distribution (experiment ‘NI’, or ‘Non-Interactive aerosols’). The time-dependent 1991–1993 CTM simulations include also a pa-rameterization for the dynamical perturbation produced by the QBO: this is a 3D extension of the parameterization
de-scribed in Mancini et al. (1991) for a zonally averaged model. In the next section we mostly present the results of our study as an ‘I-NI’ comparison, after making an average over the 10 independent 1991–1993 simulations for both experiments ‘I’ and ‘NI’.
As initial conditions for the time evolution of Pinatubo particles in the stratosphere, we assume 20 Tg of SO2(Bluth et al., 1992) to be injected in the model on 15 June 1991 at 15 N latitude and 120 E longitude, in an altitude layer be-tween 18 and 25 km (McCormick and Veiga, 1992). We also assume that 10 Tg of volcanic ash have reached the strato-sphere in about 24 h of continuous cataclysmic eruption, i.e. about 0.1% of the total 1016g of ejecta from Pinatubo (Bluth et al., 1992). This stratospheric ash fraction may be highly variable depending on the environmental conditions of the rising plume and on the size distribution of ash particles. Textor (1999) has estimated the amount of gas and particles reaching the stratosphere from an explosive volcanic erup-tion, using the very high resolution ATHAM model devel-oped at the Max-Plank-Institute of Hamburg (Oberhuber et al., 1999; Herzog et al., 1999). At the end of the one hour simulation, 4 × 0−5of the total erupted mass is left in the stratosphere with a maximum of about 20% after 10 min: complex microphysical processes (particle growth, sedimen-tation, etc.) are responsible for this short-time fast removal of stratospheric ash. These results come from plume numer-ical simulations made under prescribed boundary conditions for the explosion and under a variety of meteorological con-ditions: since they may not exactly represent the Pinatubo conditions we should treat them as an order of magnitude es-timate. Our CCM operates on much longer time scales (one hour to days), so that in order to start the microphysical sim-ulation it is reasonable to assume some rough intermediate value (10−3is our choice) for the 24 h continuous eruption of Pinatubo; the adopted ash size distribution is that of Carey and Sigurdsson (1982) for Mt. St. Helens.
As mentioned in the previous section, the ash climate forc-ing is of secondary importance due to the rather short life-time of these coarse particles in the stratosphere (less than one month for 2 µm particles at 20 km altitude). However, they can still play a role by speeding up the removal of sul-phuric acid condensed over the ash cores during the first days after the eruption, so that once the sulphur-particle conver-sion process is completed a somewhat smaller aerosol load-ing is found in the stratosphere with respect to a reference case without ash particles. Sensitivity studies have been made with our model by changing the stratospheric influx of ash and its size distribution: a very small impact was found on the amount and distribution of radiatively active sulphate aerosols.
The initial injection of water vapour is also specified in the model: Textor (1999) calculates in her experiment that 30 000 tons per hour of water reach the stratosphere, together with about 8 000 tons of sulphur in an hour of continuous eruption. Part of the emitted water is lost in the troposphere by condensation in the rising volcanic plume and stabilized ash cloud (Pinto et al., 1989). Adopting the same water to
0.05 0.1 0.15 0.2 0.25 0.3 0.35 0.4 0.45 0.5 J J A S O N D J F M A M J J A S O N D −90 −60 −30 0 30 60 90 MONTH (1991−1992) LATITUDE
STRATOSPHERIC OPTICAL DEPTH (0.55 µm)
Fig. 1. Time series of calculated
strato-spheric optical depth at 0.55 µm (exper-iment ‘I’) as a function of latitude, from June 1991 to December 1992. Contour line spacing is 0.025.
sulphur scaling for Pinatubo (but we remind the reader here that the ratio of water to sulphur could significantly change from one volcanic eruption to another) we obtain 37.5 Tg-H2O injected in the stratosphere. Textor (1999), however, notes that about 80% of the total water injected in the strato-sphere is in the form of cloud ice and below about 20 km, the water vapour pressure in the volcanic plume is close to its saturation value over ice, so that fast ice particle growth occurs in supersaturated regions. Only above 20 km the rel-ative humidity become lower than 100%, resulting in re-evaporation of ice particles. Keeping in mind these large uncertainties, we assume 10 Tg-H2O as an initial condition for our Pinatubo experiment.
As discussed above, stratospheric sulphate particles are normally supercooled solutions of water vapour and sul-phuric acid; the latter is formed via OH oxidation of SO2 with the following reaction sequence (Pinto et al., 1989):
SO2+OH + m → H SO3+m H SO3+O2→H O2+SO3 SO3+H2O → H2SO4
. This reaction sequence is catalytical in HOx, so that the rate of SO2conversion to H2SO4can remain high throughout the evolution of the volcanic cloud, if enough recycling of HO2 to OH is present (NASA, 1992). The model calculates a SO2 e-folding time of 40 days, comparable to TOMS observations (35 days); this is an indirect proof of the realistic OH amount in the model, at least in the tropical lower stratosphere. De-tails on the microphysical scheme for stratospheric sulphate aerosols can be found in Pitari et al. (1993) and Ricciardulli et al. (1996).
4 Results
4.1 Atmospheric dynamics
Figure 1 shows the calculated stratospheric optical depth (τ ) at 0.55 µm from June 1991 to December 1992 (model run ‘I’). The most important features of the calculated time se-ries are the following: (a) good equatorial confinement of the particles up to January 1992, consistent with indepen-dent satellite observations (Thomason et al., 1997; Long and Stowe, 1994; Lambert et al., 1993; Stenchikov et al., 1998) and (b) more aerosol transport towards Southern Hemisphere mid-latitudes during the fall months of 1991 (with τ ranging between 0.14 and 0.20 at 50S during October–November, against 0.03–0.10 at 50N). The magnitude of the calcu-lated optical depth in the Southern Hemisphere is closer to AVHRR observations (0.15–0.20 at 0.5 µm) than to SAGE-II values (about 0.12 at 0.525 µm).; (c) The aerosol penetra-tion in the Northern Hemisphere mid-high latitudes becomes relatively fast only in late winter 1991/92 with τ ' 0.18– 0.20 at 50N during February–March 1992, which is close to SAGE-II observations (0.16–0.18); (d) during the first six months, tropical τ values are closer to AVHRR observations, with respect to SAGE-II; (0.46 in September 1991 and 0.18 in March 1992 at the equator, against 0.38–0.24 for AVHRR, and 0.21–0.17 for SAGE-II): we have applied here a 0.84 cor-rection factor to the AVHRR values from June to December 1991, as recommended by Russel et al. (1996). In addition, it should be taken into account that optical depth calcula-tions from SAGE-II extinction data are difficult during the first months after the eruption due to instrument saturation problems at the aerosol peak altitudes.
J A O D F A J A O D F A J A O D 0 1 2 3 4 5 6 MONTH (1991−1993) W/m 2 RADIATIVE FORCING
Fig. 2. Time series of the calculated globally averaged net radiative flux change at the tropopause (1991–1993) due to aerosols from the
Pinatubo eruption. Units are W/m2.
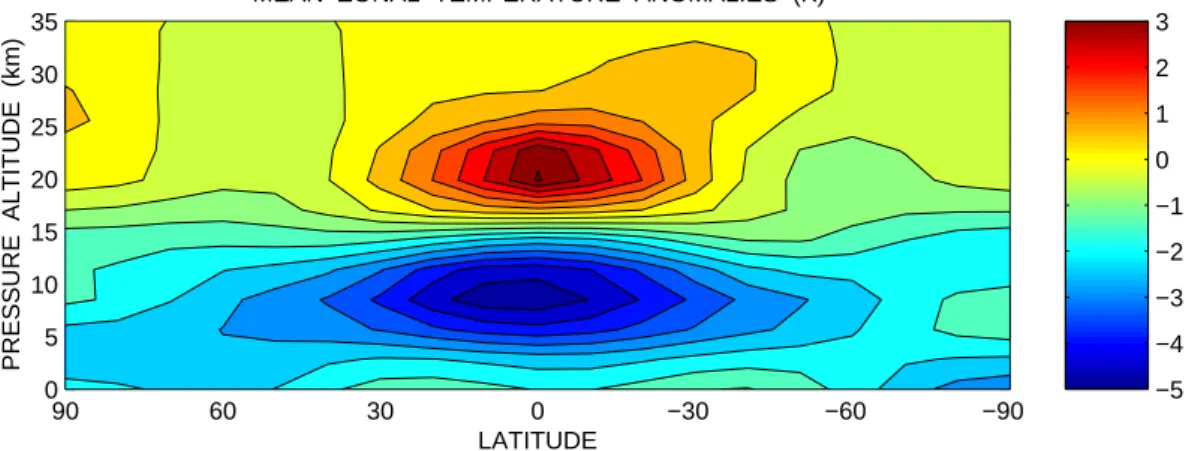
−5 −4 −3 −2 −1 0 1 2 3 −90 −60 −30 0 30 60 90 0 5 10 15 20 25 30 35 LATITUDE PRESSURE ALTITUDE (km)
MEAN ZONAL TEMPERATURE ANOMALIES (K)
Fig. 3. Model calculated mean zonal temperature changes produced by Pinatubo aerosols during September–November 1991 (K) (experiment
‘I-NI’). Contour line spacing is 0.5 K.
As discussed in Timmreck et al. (1999), the aerosol radia-tive interaction helps the tropical maximum to move equa-torward with respect to the initial position, although the observed meridional transport across the equator would be faster than the calculated one, even including the aerosol ra-diative feedback on dynamics (as it will be discussed later, this radiative perturbation tends to increase the meridional southward component of the residual velocity). In order to help this cross-equatorial transport, we have superimposed on the GCM-calculated velocity stream-function a perturba-tion field resembling a strong high over Tibet: this dynamical pattern was present during June 1991 and favoured the south-ward motion of the gas and aerosol volcanic cloud.
About three months after the eruption, gas to particle con-version processes are completed and coarse ash particles from the lower stratosphere form sediment. From this mo-ment (and for about one year), our calculations predict a size distribution in the aerosol cloud with an effective ra-dius of the order of 0.4–0.6 µm, to be compared with about 0.15 µm in pre-volcanic conditions. As shown by Lacis et al. (1992), the climate forcing of sulfuric acid droplets
of this size is always negative, because additional scatter-ing of incomscatter-ing short-wave solar radiation dominates over the additional infrared forcing; only much larger particles (reff > 2µm) could cause heating of the surface. Fig-ure 2 shows the globally averaged net radiative flux change at the tropopause as calculated in the model up to Decem-ber 1993. The largest forcing is found during February 1992 (-5.2 W/m2, with τ =0.175), decreasing later on with an e-folding time of 12 months (about -1.2 W/m2during August 1993: see also Hansen et al., 1992).
Figure 3 presents the model calculated tempera-ture changes produced by the volcanic aerosols during September–November 1991: as expected from the above discussed radiative flux change, the troposphere cools down (-1.5 K globally at the surface), while the tropical lower stratosphere is heated by aerosol absorption of solar and planetary radiation and by O3absorption of particle diffuse radiation (Pitari, 1993). The maximum cooling is found in the tropical mid-upper troposphere (-4.8 K at 300 hPa) and is produced by decreasing convective heating. The globally averaged temperature gradient between 300 hPa
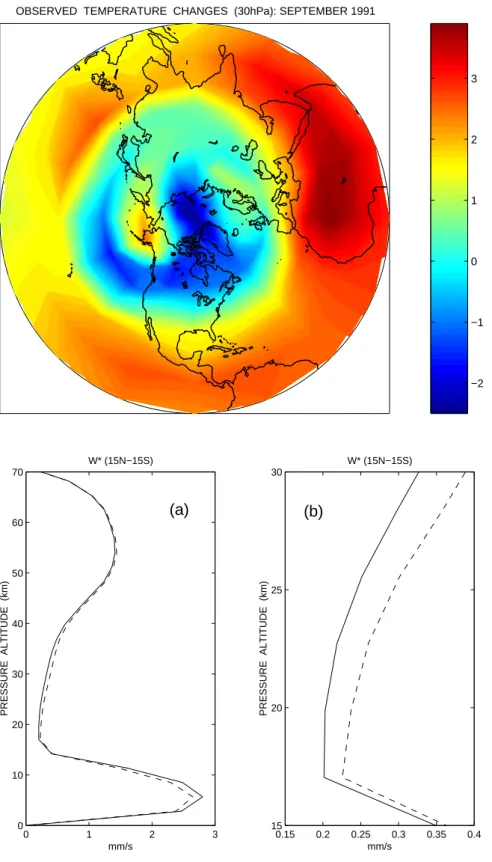
−2 −1 0 1 2 3 CALCULATED TEMPERATURE CHANGES (30−50hPa): SEPTEMBER 1991
Fig. 4. Calculated Northern Hemi-sphere temperature anomalies at 30– 50 hPa during September 1991 (K) (ex-periment ‘I-NI’).
and the surface decreases from -6.3 K/km to -6.8 K/km and the static stability parameter (HdT/dZ+RT/Cp) from 31.1 K to 29.1 K at 300 hPa. We find this lower atmospheric stability to significantly affect the activity of planetary waves in the Northern Hemisphere winter season following the eruption (see ahead). The maximum stratospheric warming is calculated at the equator at about 30–50 hPa (3.5 K): in this altitude layer a cooling belt is present between 40N and 70N (-0.2 K to -0.4 K) similarly to what has been observed (Labitzke and McCormick, 1992). A comparison of calculated and observed lower stratospheric 1T maps is presented in Fig. 4 and Fig. 5; observed changes are obtained by subtracting a 20-year climatology (1965–1984) to the 1991 measurements collected by Kuhlbarsch and Naujokat (1991). The qualitative features of the observed extratropical temperature anomaly are well represented in our calculation, showing a wide area of mid-latitude cooling with evidence of wave-number 1 and 2 activity.
Changes in solar and planetary heating rates due to vol-canic aerosols have the direct effect of warming up the tropi-cal stratosphere, and also upsetting the stratospheric dynam-ics because no radiative equilibrium is achieved. In particu-lar, an additional residual upwelling motion is produced in the tropical stratosphere as a result of a stronger pole-to-equator gradient of net heating rates. Figure 6 presents the calculated residual vertical velocity (w∗) averaged over 15N– 15S and the 1991 fall season months (September–October– November, SON): a 20% increase is found at 30 hPa dur-ing 1991 with respect to the non-interactive case. It is worth noting that the calculated velocity (0.3 mm/s) is
con-sistent with the value derived from the tape recorder signal of H2O+2CH4, using the Halogen Occultation Experiment (HALOE) data.
Figure 7 summarizes the calculated residual circulation changes as an annual average over July 1991 through June 1992 with respect to the non-interactive case. The most rel-evant features are the following: (a) additional upwelling above 75 hPa in the 15N-15S latitude band; (b) additional southward motion in the Southern Hemisphere in a layer centered at 20 km altitude; (c) rather strong additional subsi-dence in the Northern Hemisphere at mid- and high-latitudes, with a southward meridional component in the lower strato-sphere below 50 hPa. Feature (a) may explain the observed ozone loss in the tropics during the 1991 fall season (Grant et al., 1996), while (b) is consistent with the observed parti-cle spread in the Southern Hemisphere during the austral late winter and fall of 1991 (McCormick and Veiga, 1992; Long and Stowe, 1994), and finally (c) may help explain the pro-nounced tropical confinement of the aerosol particles (Lam-bert et al., 1993) by decreasing their isentropic poleward mo-tion in the 400–500 K layer (Timmreck et al., 1999).
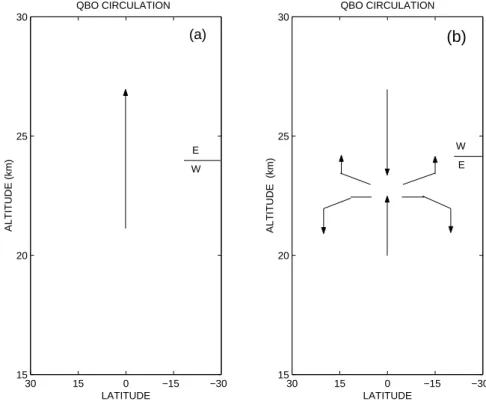
Trepte and Hitchman (1992) have studied the tropical stratospheric circulation using satellite aerosol data and have clearly shown the differences between dynamical regimes during dominant easterly or westerly shear of the quasi-biennial oscillation of the equatorial stratosphere. The streamlines of the QBO circulation are summarized in Fig. 8, showing that definite upwelling motions are extended ev-erywhere in the tropical stratosphere (from the tropopause up to 30 km altitude) during years with dominant easterly
−2 −1 0 1 2 3 OBSERVED TEMPERATURE CHANGES (30hPa): SEPTEMBER 1991
Fig. 5. Observed Northern Hemisphere
temperature anomalies at 30 hPa dur-ing September 1991 (K) (Labitzke and McCormick, 1992). Changes are ob-tained by subtracting a 20-year cli-matology (1965–1984) from the 1991 measurements collected by Kuhlbarsch and Naujokat (1991). 0 1 2 3 0 10 20 30 40 50 60 70 mm/s PRESSURE ALTITUDE (km) W* (15N−15S) 0.15 0.2 0.25 0.3 0.35 0.4 15 20 25 30 mm/s PRESSURE ALTITUDE (km) W* (15N−15S)
(a)
(b)
Fig. 6. Calculated equatorial residual
vertical velocity (15N–15S) for 1991 September–October–November months (SON) with interactive (dashed lines)
and non-interactive aerosols (solid
lines) (a); (b) inset of the left panel (a) in the lower stratospheric region. Units are mm/s.
shear (Fig. 8a). On the other hand, during westerly phase years, descent relative to the mean stratospheric circulation occurs over the equator and more aerosols can be trans-ported down to altitudes within a few kilometers above the tropopause, where poleward isentropic transport is relatively fast (Fig. 8b). The main conclusion of Trepte and Hitchman
(1992) is that when the QBO easterly shear is present (as in the months following the Pinatubo eruption), aerosols are lofted over the equator and less transport towards the poles is obtained with respect to the case of westerly shear. Model results shown in Fig. 6 and Fig. 7 suggest that the Pinatubo aerosol radiative heating has a feedback on the dynamics of
−0.06 −0.04 −0.02 0 0.02 0.04 0.06 −90 −60 −30 0 30 60 90 15 20 25 30 35 LATITUDE PRESSURE ALTITUDE (km)
RESIDUAL VERTICAL VELOCITY CHANGES (mm/s)
−0.4 −0.2 0 0.2 0.4 −90 −60 −30 0 30 60 90 15 20 25 30 35 LATITUDE PRESSURE ALTITUDE (km)
RESIDUAL MERIDIONAL VELOCITY CHANGES (dm/s)
(a)
(b)
Fig. 7. Calculated residual circulation changes averaged over July 1991 through June 1992 (experiment ‘I-NI’). Upper and bottom panels
((a), (b)) are for vertical and meridional components, respectively. Units are mm/s in (a) and dm/s in (b). Contour line spacing is 0.005 mm/s in (a) and 0.025 dm/s in (b).
the middle atmosphere similar to that of QBO easterly phase years and may additionally help to confine the particles in the tropical reservoir and to increase their lifetime.
The similarities between dynamical anomalies calculated as a result of the Pinatubo aerosol radiative forcing with those observed for the QBO easterly phase may also be seen in the lower stratospheric geopotential height field. Our results sug-gest that the tropical volcanic aerosol heating forces changes in the planetary wave amplitude similar to those observed during years with easterly (E) phase of the QBO with re-spect to westerly (W) phase years. Figure 9 shows the am-plitude change of the 50 hPa geopotential wave-number 1 during winter 1991/92, due to the volcanic aerosol radiative feedback: this change is compared to that obtained from a statistic over 16 years of observations (1962–1977) made by grouping years with dominant E or W phases of the QBO (Holton and Tan, 1980). In early winter months (November– December) the amplitude of the 1991 wave-number 1 is found to be nearly 45% stronger than it would have been without aerosol radiative interaction, similar to what was found by Holton and Tan (1980) for easterly versus west-erly years (40%). Holton and Tan (1980) hypothesize that shifts in the latitude of the zero mean zonal wind critical line associated with the equatorial QBO may be responsible for
the 50 hPa extratropical behaviour of planetary waves. They also conclude, however, that the significant differences be-tween the mean zonal wind distributions in E and W cate-gories could also be an alternative (or additional) explana-tion for the different amplitude and phase behaviour of the waves. For 1991/92 we may hypothesize that the enhanced lower stratospheric planetary wave activity is a direct conse-quence of the decreased atmospheric stability produced by the aerosol induced tropospheric cooling (Fig. 3). As in the observations, we also find a rather distinct wave behaviour between early and late winter months: from January through March 1992 the amplitude of wave number 1 shows no sig-nificant differences between ‘I’ and ‘NI’ cases, as observed for E-W years. The calculated anomalies of wave number 2 during 1991/92 late winter months are also rather small, while Holton and Tan (1980) observed a 60% stronger am-plitude during westerly phase years: the authors, however, suggest that this wave number 2 signal could most likely be a result of sampling fluctuations rather than a real difference between W and E categories.
Geopotential height field deviations for December 1991 are shown in Fig. 10 (‘I-NI’). As observed for E-W year anomalies, the effects of planetary wave modulation is much stronger in early winter months, while for late winter, the
−30 −15 0 15 30 15 20 25 30 QBO CIRCULATION LATITUDE ALTITUDE (km) −30 −15 0 15 30 15 20 25 30 QBO CIRCULATION LATITUDE ALTITUDE (km) E W (a)
(b)
W EFig. 8. Streamlines of the QBO circulation inferred from observed aerosol distributions. Panel (a) is for dominant easterly shear (October
1988); panel (b) is for dominant westerly shear (November 1984) (Trepte and Hitchman, 1992).
20 30 40 50 60 70 80 −25 0 25 50 75 100 latitude (N) geopotential height (m)
amplitude change of 50 hPa geopotential wave #1
HT (ND:Esterly−Westerly) GCM (ND1991: I − NI) GCM (JFM1992: I − NI)
Fig. 9. Amplitude change in the 50 hPa geopotential wave number 1 (m) during winter 1991/92 calculated with respect to the baseline
simulation with no radiative feedback of the volcanic aerosols (‘I-NI’) (solid blue line is for November–December 1991; dashed blue line is for January–February–March 1992). Red line shows the corresponding amplitude anomaly for November–December months, resulting from over 16 years of observations (1962–1977) made by grouping years with dominant E, W phases of the QBO (Holton and Tan, 1980).
high-latitude geopotential height deviations are much more zonally symmetric. A direct comparison can be made with Holton and Tan (1980) values for E-W during December months (Fig. 11): the qualitative agreement is consistent with the above discussed 40% increase in wave number 1’s amplitude. Summarizing, we conclude that the tropospheric cooling produced by the Pinatubo aerosol climate forcing, coupled to the tropical stratospheric radiative heating, may produce middle-atmosphere circulation changes resembling those associated with the easterly phase of the equatorial QBO, both in terms of mean meridional circulation and planetary wave activity. It is also worth noting that the above described enhancement of planetary wave activity may, to a
large extent, explain the more pronounced additional down-welling in the Northern Hemisphere residual circulation with respect to the Southern Hemisphere (Fig. 7).
4.2 Long-lived tracers
Substantial perturbations in the trends of greenhouse gases (in particular CH4, N2O and O3) occurred during 1992 (Schauffler and Daniel, 1994; WMO, 1999). While ozone is mainly produced in the stratosphere via UV photolysis of molecular oxygen and is photochemically depleted via com-plex catalytic cycles, CH4 and N2O are mainly produced
−150 −100 −50 0 50 100 150 GEOPOTENTIAL HEIGHT DEVIATIONS (M): DEC1991 I−NI
Fig. 10. Geopotential height field
de-viations (m) for December 1991, calcu-lated as in Fig. 9.
at the surface or in the troposphere and have a rather long chemical lifetime (about 10 years for methane and 150 years for nitrous oxide, considering both troposphere and strato-sphere). Drawing conclusions on ozone trends is made diffi-cult by the complex chemical-radiative-dynamical feedback processes involved, whereas the picture should be clearer for CH4and N2O.
The average pre-Pinatubo rate of increase in atmospheric mixing ratios of CH4 declined consistently during 1992 in the Northern Hemisphere (from 11.6 to 1.8 ppbv/yr) (Dlu-gokencky et al., 1994), and a similar behaviour was found for N2O (from 1.0 to 0.5 ppbv/yr) (Swanson et al., 1993). Changes in both hemispheres began in the second half of 1991; the Southern Hemisphere trends also decreased, but only by smaller amounts. Schauffler and Daniel (1994) have proposed a physical mechanism that may explain these observations: since the stratosphere contains lower mix-ing ratios of these gases, a decline in the observed trends could result from a higher degree of exchange between the stratosphere and the troposphere. The above described anomalies of the stratospheric circulation (radiatively forced by the Pinatubo aerosols) could indeed increase the mid-latitude stratosphere-troposphere flux of atmospheric tracers. It should be noted that not only the extratropical additional downwelling of the mean meridional circulation is important in this regard, but also the enhancement in wave activity: this is expected to further enhance the meridional circulation and the stratosphere-troposphere flux (Holton, 1990).
The box-model used in the Schauffler and Daniel (1994) study was probably not optimal to study these strat/trop ex-changes. Our CCM simulation may better address this point,
by looking directly at the tropopause anomalies of tracers, calculated as the difference between the simulation includ-ing the aerosol radiative forcinclud-ing and the other simulation treating Pinatubo aerosols as a passive tracer, with no radia-tive feedbacks on the atmospheric circulation. Figure 12 is a time series of the observed NH methane trend and superim-posed shows the calculated tropopause anomalies produced by the circulation changes due to the Pinatubo aerosol ra-diative feedback. The extratropical downwelling branch of the perturbative residual circulation (Fig. 7) is the main driv-ing mechanism for this tropopause decrease in methane: the overall effect will be to dilute the troposphere with strato-spheric air that is poorer in CH4 (or N2O). Figure 12 in-dicates that the stratospheric circulation changes forced by volcanic aerosols during 1991/92 are responsible for an aver-age hemispheric mixing ratio change at the tropopause (100– 200 hPa), compatible with the observed trend decline, at least through the spring of 1992.
It is also useful to compare the calculated tropopause anomalies in the two hemispheres (Fig. 13): as observed for the trend decline, SH tropopause changes of both methane and nitrous oxide are smaller than NH changes. This ev-idence is consistent with the calculated anomalies of the residual circulation: as a result of the increased planetary wave activity during the 1991/92 Northern Hemisphere win-ter months, the downwelling branch of the perturbative resid-ual circulation is much more pronounced in the Northern Hemisphere than in the Southern (Fig. 7). It should also be noted that our predicted tropopause change of nitrous oxide is larger than the observed trend decline; one possible expla-nation could be that our model overestimates some additional
−150 −100 −50 0 50 100 150 GEOPOTENTIAL HEIGHT DEVIATIONS (M): DEC E−W
Fig. 11. Observed E-W geopotential height field deviations (m) for Decem-ber months (1962 to 1977) (Holton and Tan, 1980).
mid-stratospheric N2O photodissociation due to the aerosol diffuse radiation.
As noted before, the observed O3behavior during 1991/92 is more difficult to explain with respect to methane and ni-trous oxide, due to the strong feedback of heterogeneous chemistry on radical species affecting lower stratospheric ozone depletion. The time-dependent model exercise car-ried out for WMO (1999), as well as independent studies (Solomon et al., 1996), have proved that changes in strato-spheric sulphate aerosols coupled to trends of Cl/Br species may, to a large extent, explain the ozone trend observed in the last two decades. Volcanic eruptions of different mag-nitude (El Chich´on, Nevado del Ruiz, Pinatubo, and oth-ers) represent the most important factor affecting strato-spheric aerosols. An increase in particle number density or a change in size distribution with enhanced concentration of smaller particles may significantly increase the aerosol sur-face area density available for heterogeneous chemical reac-tions. These reactions (hydrolysis of N2O5is the most impor-tant at mid-latitudes) have the overall effect of reducing the amount of reactive nitrogen in the lower stratosphere, so that more OH, ClO and BrO are simultaneously produced, also because other heterogeneous reactions may directly convert part of the stable Cl/Br reservoirs (HCl, in particular) into ac-tive Cl/Br radicals. These chemical perturbations end up pro-ducing more ozone depletion, at least below 25 km altitude. All models participating in the WMO (1999) exercise have shown a great chemical sensitivity to the Pinatubo aerosol perturbation, which is the largest in the past two decades.
Pure chemical studies, however, do not take into account the aerosol radiative effects both on photolysis rates (Pitari
and Rizi, 1993) and, more importantly, on stratospheric dy-namics. A common feature in the WMO (1999) intercom-parison is that no model is able to reproduce the observed additional O3 depletion during 1993 with respect to 1992 (at least with a magnitude comparable to TOMS measure-ments, that is about 2%). We hypothesize here that the above discussed changes of the stratospheric circulation could be responsible for this observed additional ozone depletion dur-ing 1993, both directly (by perturbdur-ing the lower stratospheric ozone fluxes) and indirectly (via the aerosol distribution af-fecting the ozone chemical balance).
Figure 14 compares TOMS measurements with the calcu-lated global ozone changes relative to 1991 for the two cases (radiatively interactive and non-interactive aerosols). Model O3changes are obtained from four different numerical exper-iments: ‘I’ and ‘RNI’ in panel (a), ‘CNI’ and ‘NI’ in panel (b). ‘I’ is the already discussed fully interactive aerosol case (radiation + chemistry), and ‘RNI’ is the radiatively non-interactive case with photochemistry using the on-line cal-culated aerosol distribution. ‘CNI’ is the radiatively inter-active case with photochemistry using the 1990 background sulphate aerosols, and ‘NI’ is the already discussed fully non-interactive case (radiation + chemistry). In other words, panel (a) shows the effect of updating the stratospheric circu-lation with a realistic 1991–93 photochemistry, while panel (b) shows the same dynamical effects on ozone but using a pre-Pinatubo ‘volcanically-clean’ photochemistry.
As expected, the first information from Fig. 14 is that the strongly enhanced heterogeneous chemistry during 1992/93 is the key factor for explaining the observed O3decline: the negative ozone trend in panel (b) is simply a result of the
in-88 89 90 91 92 93 −5 0 5 10 15
observed trend (ppbv/yr)
88 89 90 91 92 93 −15 −10 −5 0 5 calculated anomalies (ppbv)
Northern Hemisphere CH4 trend (left) and tropopause anomalies (right)
years
Fig. 12. Time series of the observed methane trend (left scale, ppbv/yr) (Dlugokencky et al., 1994) and calculated tropopause anomalies
produced by the Pinatubo circulation changes (right scale, ppbv). Both quantities are averaged over the Northern Hemisphere.
J S D M J S D M −12 −10 −8 −6 −4 −2 0 2 NH tropopause CH4 changes ppbv months (1991−1993) J S D M J S D M −12 −10 −8 −6 −4 −2 0 2 SH tropopause CH4 changes ppbv months (1991−1993) J S D M J S D M −2.5 −2 −1.5 −1 −0.5 0 0.5 NH tropopause N 2O changes ppbv months (1991−1993) J S D M J S D M −2.5 −2 −1.5 −1 −0.5 0 0.5 SH tropopause N 2O changes ppbv months (1991−1993) (a) (b) (c) (d)
Fig. 13. Time series of the calculated tropopause anomalies of CH4(upper panels (a), (b)) and N2O (bottom panels (c), (d)). Left panels ((a), (c)) are for the Northern Hemisphere, right panels ((b), (d)) for the Southern Hemisphere. Units are ppbv.
creasing Cl/Br loading in the stratosphere, but its magnitude is much smaller than the observed one. It should be noted, however, that the radiatively forced circulation changes are able to modulate the global O3loss with less depletion during 1992 with respect to the non-interactive case (i.e. volcani-cally unperturbed circulation). This ozone behaviour could be explained with the same arguments adopted for CH4and N2O, with the important difference that O3has its peak con-centration in the stratosphere, so that a reinforcement of the residual circulation during 1991/92 ends up accumulating more ozone at the tropopause level in the 100–300 hPa re-gion, where the chemical lifetime is longer than in the lower stratosphere (Fig. 15).
The calculated ozone profile change shows a well-defined tropical decrease at about 25 km altitude (mostly produced
by the additional upwelling) and a layer of ozone increase in the tropopause region (due to the mid- to high-latitude down-welling branch of the perturbative residual circulation). The increase in the tropical upper troposphere is rather large in percent but small in absolute units (about 5–10 ppbv), and is mostly a consequence of the slightly decreasing vertical gradient of the ozone mixing ratio and of a negative w∗ per-turbation in this region (see Fig. 6a). The calculated ozone trend is much larger when a realistic ‘Pinatubo’ chemistry is adopted (Fig. 14a): perturbations of photolysis and het-erogeneous chemical rates both concur to this enhanced O3 depletion (Pitari and Rizi, 1993). It is interesting to note that the 1992 difference between the fully interactive case and the experiment with no aerosol radiative feedback on circulation is significantly larger with respect to the case where Pinatubo
91 92 93 94 −4 −3 −2 −1 0 Global O
3 changes with Pinatubo aerosols in photochemistry (1991−1994)
% Changes relative to 1991
YEARS TOMS Aerosol radiative feedback No aerosol radiative feedback
91 92 93 94 −4 −3 −2 −1 0 Global O
3 changes with background aerosols in photochemistry (1991−1994)
% Changes relative to 1991
YEARS
(a)
(b)
Fig. 14. Global ozone changes relative to 1991 (%). Top panel (a) refers to ‘I’ and ‘RNI’ simulations using the interactively calculated aerosol
distribution in photochemical terms; bottom panel (b) refers to ‘CNI’ and ‘NI’ simulations using the 1990 background aerosol distribution in photochemistry (see text for details on the experiments). Solid line is for TOMS measurements (WMO, 1999), dashed line for the radiatively interactive cases (‘I’ in panel (a) and ‘CNI’ in panel (b)), and dashed-dotted lines for the radiatively non-interactive cases (‘RNI’ in (a) and ‘NI’ in (b)).
aerosols do not interact with photochemistry (Fig. 14b): the reason is that the radiatively perturbed circulation upsets the aerosol distribution itself with a feedback on the chemical depletion efficiency. In particular (see discussion relative to Fig. 7), the additional aerosol heating helps to increase the tropical confinement of the particle slowing down the isentropic poleward motion in the 400–500 K layer. This means that in the fully interactive experiment less particles are moved toward mid- to high-latitudes during the spring of 1992, thus decreasing the lower stratospheric efficiency of the N2O5hydrolysis and the associated additional ozone de-pletion. An important conclusion of this study is that a cou-pling of photochemical and dynamical perturbations is nec-essary to correctly understand the observed features of the post-Pinatubo ozone depletion: photochemistry alone cannot fully explain the 2% global ozone decline during 1993 with respect to 1992.
5 Summary and Conclusions
A climate-chemistry coupled model has been used to study the short-term climatic impact of the 1991 eruption of Mt. Pinatubo, focusing on the associated changes in the at-mospheric general circulation and the related effects on the distribution of long-lived atmospheric tracers and ozone. De-spite its coarse resolution and the simplicity of its dynamical
scheme, the CCM used in this study presents some interest-ing features that are particularly relevant to the aim of this study. Not only radiative and photochemical codes inter-act with dynamics (which is typical of CCMs), but also a microphysical module for aerosol formation and growth ex-tending to both troposphere and stratosphere. The processes of gas-particle interaction are implemented in the model, so that the evolution of the Pinatubo aerosol cloud can be real-istically treated: volcanic aerosol formation is initialized by the SO2injection in the stratosphere followed by oxidation into H2SO4. The latter process is driven by the abundance of OH predicted interactively in the chemical module. The model is validated in terms of predicted aerosol optical depth and dynamical anomalies, such as temperature, geopotential height and residual circulation. A discussion is made regard-ing the similarities with the dynamical regime of the east-erly phase of the equatorial wind quasi-biennial oscillation. It is shown that the dynamical perturbation is twofold: (a) the stratospheric mean meridional circulation is affected by local aerosol radiative heating (mostly located in the tropi-cal lower stratosphere); (b) the planetary wave propagation in the mid-to high-latitude lower stratosphere is altered as a consequence of the decreasing atmospheric stability associ-ated to the climatic perturbation. The final step of this study is an attempt to correlate the calculated dynamical anomalies with the observed trends of greenhouse gases (in particular
−20 −10 0 10 20 −90 −60 −30 0 30 60 90 0 5 10 15 20 25 30 35 LATITUDE PRESSURE ALTITUDE (km)
OZONE PROFILE CHANGES (%)
Fig. 15. Calculated ozone profile changes (%) averaged over July 1991 through June 1992 and due to circulation changes forced by the
volcanic aerosols (experiment ‘I-RNI’). Contour line spacing is 2%.
CH4, N2O and O3).
Major findings of this study are that the radiatively forced changes of the stratospheric circulation during the first two years after the eruption may, to a large extent, explain the observed trend decline of long-lived greenhouse gases (CH4 and N2O, in particular) and may also help explain why sim-ple photochemical studies of the ozone trends generally fail in reproducing the satellite observed features of the ozone depletion. In both cases we conclude that an increase of the mid- to high-latitude downward flux at the tropopause is the key factor for explaining the behaviour of these atmospheric tracers during 1991/92.
Following the suggestion of Schauffler and Daniel (1994), that a decline in the observed CH4 and N2O trends could result from a higher degree of exchange between the stratosphere and the troposphere, we have shown that the stratospheric circulation anomalies radiatively forced by the Pinatubo aerosols could indeed increase the mid-latitude stratosphere-troposphere flux of atmospheric tracers. In this regard, not only the extratropical additional downwelling of the mean meridional circulation is important, but also the en-hancement in wave activity. It has been shown that aerosol forced stratospheric circulation changes during 1991/92 are responsible for an average tropopause mixing ratio change compatible with the observed trend decline of methane. The observed inter-hemispheric difference (much larger trend de-cline in the Northern Hemisphere than in the Southern) is consistent with the calculated anomalies of the residual cir-culation, that are more pronounced in the NH winter-spring months of 1991/92, as a result of the increased planetary wave activity.
A similar mechanisms also applies to ozone: in this case the largest tracer mixing ratios are located in the stratosphere, so that the reinforcement of the residual circulation during 1991/92 has the effect of moving more ozone towards and below the tropopause, where its chemical lifetime is longer. The overall result is a mitigation of the lower stratospheric photochemical O3depletion during 1992, so that the largest
global impact of Pinatubo aerosols on ozone is postponed until 1993, as observed by satellite instruments.
A future development of this work will be to check the calculated time-dependent distribution of Pinatubo aerosols with available ground-based and satellite observations: this comparison may possibly allow one to draw more definite conclusions on the dynamical role of volcanic aerosol par-ticles. A further validation can also be made on the gas-particle interaction processes taking place in the early stages of the aerosol cloud formation, looking in particular at the evolution of the sulphur dioxide cloud and taking advantage of high-quality satellite observations of SO2column (TOMS) and vertical profiles (MLS).
Acknowledgements. This work was funded by the EU programme
PARTS (EVK2-CT2001-00112).
References
Angell, J. K. and Korshover, J.: Surface temperature changes fol-lowing six major volcanic episodes between 1780 and 1980, J. Climate and Appl. Meteorol., 24, 2031–2048, 1985.
Bekki, S., Pyle, J. A., Zhong, W., Toumi, R., Haigh, J. D., and Pyle, D. M.: The role of microphysical and chemical processes in prolonging the climate forcing of the Toba eruption, Geophys. Res .Lett., 23, 2669–2672, 1996.
Bluth, G. J. S., Doiron, S. D., Schnetzler, C. C., Krueger, A. J.,
and Walter, L. S.: Global tracking of the SO2clouds from the
June, 1991 Mount Pinatubo eruptions, Geophys. Res .Lett., 19, 151–154, 1992.
Brasseur, G. and Solomon, S.: Aeronomy of the middle atmosphere, D. Reidel Ed., 1984.
Carey, S. N. and Sigurdsson, H.: Influence of particle aggregation on deposition of distal Tephra from the May 18, 1980, erup-tion mount St. Helens volcano, J. Geophys. Res., 87, 7061–7072, 1982.
Dlugokencky, E. J., Masarie, K. A., Lang, P. M., Tans, P. P., Steele, L. P., and Nisbet, E. G.: A dramatic decrease in the growth rate of atmospheric methane in the northern hemisphere during 1992, Geophys. Res. Lett., 21, 45–48, 1994.
Fahey, D. W. et al.: In-situ measurements constraining the role of sulphate aerosols in mid-latitude ozone depletion, Nature, 363, 509–514, 1993.
Fairlie, T. D. A.: Three-dimensional transport simulations of the dispersal of volcanic aerosol from Mount Pinatubo, Q. J. R. Me-teorol. Soc., 121, 1943–1980, 1995.
Forster, P. M. and Shine, K. P.: Radiative forcing and temperature trends from stratospheric ozone changes, J. Geophys. Res., 102, 10 841–10 855, 1997.
Grant, W. B., Browell, E. V., Long, C. S., Stowe, L. L., Grainger, R., and Lambert, A.: Use of volcanic aerosols to study the tropical stratospheric reservoir, J. Geophys. Res., 101, 3973–3988, 1996. Hansen, J. E., Lacis, A., Ruedy, R., and Sato, M.: Potential cli-mate impact of Mount Pinatubo eruption, Geophys. Res. Lett., 19, 215–218, 1992.
Hansen, J. E. et al.: Forcings and chaos in interannual to decadal climate change, J. Geophys. Res., 102, 25 679–25 720, 1997. Herzog, M., Graf, H.-F., Textor, C.: The effect of phase changes
of water on the development of volcanic plumes, J. Volcanol. Geotherm. Res., 87, 55–74, 1999.
Hobbs, P. V., Radket, L. F., Eltgrot, W., and Hegg, D. A.: Airborne studies of the emissions from the volcanic eruptions of Mt. St. Helens, Science, 211, 816–818, 1981.
Hofmann, D. J. and Rosen, J. M.: Sulfuric acid droplet forma-tion and growth in the stratosphere after the 1982 erupforma-tion of El Chich´on, Science, 222, 325–327, 1983.
Holton, J. R.: On the global exchange of mass between the strato-sphere and tropostrato-sphere, J. Atmos. Sci., 47, 392–395, 1990. Holton, J. R. and Tan, H.-C.: The influence of the equatorial
quasi-biennial oscillation on the global circulation at 50 mb, J. Atmos. Sci., 37, 2200–2208, 1980.
IPCC: Climate change 1994: Radiative forcing of climate change, J. T. Houghton et al. Eds., Cambridge University Press, Cambridge, UK, 131–162, 1994.
IPCC: Special report on aviation and the global atmosphere, J. E. Penner et al. Eds., Cambridge University Press, Cambridge, UK, 1999.
Jones, P. D.: Recent warming in the global temperature series, Geo-phys. Res. Lett., 21, 1149–1152, 1994.
JPL: Chemical kinetics and photochemical data for use in strato-spheric modeling, JPL publ. 97-4, 1997.
Kinne, S., Toon, O. B., and Prather, M. J.: Buffering of stratospheric circulation by changing amounts of tropical ozone: A Pinatubo case study, Geophys. Res. Lett., 19, 1927–1930, 1992.
Kirchner, I., Stenchikov, G. L., Graf, H.-F., Robock, A., and An-tuna, J. C.: Climate model simulation of winter warming and summer cooling following the 1991 Mount Pinatubo volcanic eruption, J. Geophys. Res., 104, 19 039–19 055, 1999.
Kuhlbarsch, T. and Naujokat, B.: Klimabericht zum Juni, August und September und Oktober 1991, Beilage Berliner Wetterkarte, KNH VI/91, VIII/91, IX/91, X/91, 1991.
Labitzke, K. and McCormick, M.P.: Stratospheric temperature in-creases due to Pinatubo aerosols, Geophys. Res. Lett., 19, 207– 210, 1992.
Lacis, A., Hansen, J. E., and Sato, M.: Climate forcing by strato-spheric aerosols, Geophys. Res. Lett., 19, 1607–1610, 1992. Lamb, H. H.: Volcanic dust in the atmosphere; with a chronology
and assessment of its meteorological significance, Philos. Trans. R. Soc. London, Ser. A, 266, 425–533, 1970.
Lambert, A., Grainger, R. G., Remedios, J. J., Rodgers, C. D., Cor-ney, M., and Taylor, F. W.: Measurements of the evolution of the Mt. Pinatubo aerosol cloud by ISAM, Geophys. Res. Lett., 20,
1287–1290, 1993.
Long, C. S. and Stowe, L. L.: Using the NOAA/AVHRR to study stratospheric aerosol optical thickness following the Mt. Pinatubo eruption, Geophys. Res. Lett., 21, 2215–2218, 1994. Mancini, E., Visconti, G., Pitari, G., and Verdecchia, M.: An
esti-mate of the Antarctic ozone modulation by the QBO, Geophys. Res. Lett., 18, 175–178, 1991.
McCormick, M. P. and Veiga, R. E.: SAGE II measurements of early Pinatubo aerosols, Geophys. Res. Lett., 19, 155–158, 1992. McCormick, M. P., Thomason, L. W., and Trepte, C. R.: Atmo-spheric effects of the Mt. Pinatubo eruption, Nature, 373, 399– 404, 1995.
McPeters, R. D., Hollandsworth, S. M., Flynn, L. E., Herman, J. R., and Seftor, C. J.: Long-term ozone trends derived from the 16-year combined Nimbus 7/Meteor 3 TOM Version 7 record, Geophys. Res. Lett., 23, 3699–3702, 1996.
M¨uller, J.-F. and Brasseur, G.: A three-dimensional transport model of the global troposphere, J. Geophys. Res., 100, 16445–16490, 1995.
NASA: The atmospheric effects of stratospheric aircraft: A first program report, M. J. Prater et al. Eds., NASA Ref. Publ. 1272, 64–91, 1992.
NASA: Models and measurements intercomparison II, J. Park et al. Eds., NASA/TM-1999-209 554x, 1999.
Newhall, G. G. and Self, S.: The volcanic explosivity index (VEI): An estimate of explosive magnitude of historic eruptions, J. Geo-phys. Res., 87, 1231–1238, 1982.
Oberbeck, V. R. et al.: Effect of the eruption of El Chich´on on stratospheric aerosol size and composition, Geophys. Res. Lett., 10, 1021–1024, 1983.
Oberhuber, J. M., Herzog, M., Graf, H.-F., and Schwanke, K.: Vol-canic plume simulation on large scale, J. Volcanol. Geotherm. Res., 87, 29–53, 1999.
Pinto, J. P., Turco, R. P., and Toon, O. B.: Self-limiting physical and chemical effects in volcanic eruption clouds, J. Geophys. Res., 94, 11 165–11 174, 1989.
Pitari, G.: A numerical study of the possible perturbation of strato-spheric dynamics due to Pinatubo aerosols: Implications for tracer transport, J. Atmos. Sci., 50, 2443–2461, 1993.
Pitari, G. and Mancini, E.: Climatic impact of future supersonic aircraft: role of water vapour and ozone feedback on circulation, Phys. Chem. Earth, 26C, 571–576, 2001.
Pitari, G. and Rizi, V.: An estimate of the chemical and radiative perturbation of stratospheric ozone following the eruption of Mt. Pinatubo, J. Atmos. Sci., 50, 3260–3276, 1993.
Pitari, G., Palermi, S., Visconti, G., and Prinn, R. G.: Ozone
re-sponse to a CO2doubling: Results from a stratospheric
circula-tion model with heterogeneous chemistry, J. Geophys. Res., 97, 5953–5962, 1992.
Pitari, G., Rizi,V. Ricciardulli,L. and Visconti,G. : High-speed civil transport impact: Role of sulfate, nitric acid trihydrate, and ice aerosol studied with a two-dimensional model including aerosol physics, J. Geophys. Res., 98, 23 141–23 164, 1993.
Pitari, G., Grassi, B., and Visconti, G.: Results of a chemical-transport model with interactive aerosol microphysics, R. D.
Bo-jkov and G. Visconti Eds., XVIII O3 Symp. Proc., 759–762,
1997.
Prather, M. J.: Catastrophic loss of stratospheric ozone in dense volcanic clouds, J. Geophys. Res., 97, 10 187–10 191, 1992. Rampino, M. R. and Self, S.: Sulfur rich volcanic eruptions and
stratospheric aerosols, Nature, 307, 344–345, 1984.