HAL Id: hal-02947712
https://hal.univ-lorraine.fr/hal-02947712
Submitted on 1 Dec 2020HAL is a multi-disciplinary open access archive for the deposit and dissemination of sci-entific research documents, whether they are pub-lished or not. The documents may come from teaching and research institutions in France or abroad, or from public or private research centers.
L’archive ouverte pluridisciplinaire HAL, est destinée au dépôt et à la diffusion de documents scientifiques de niveau recherche, publiés ou non, émanant des établissements d’enseignement et de recherche français ou étrangers, des laboratoires publics ou privés.
Distributed under a Creative Commons Attribution - NonCommercial - NoDerivatives| 4.0 International License
Signal amplification by electro-oligomerisation for
improved isoproturon detection
Tauqir Nasir, Alonso Gamero-Quijano, Christelle Despas, Manuel Dossot,
Grégoire Herzog, Alain Walcarius
To cite this version:
Tauqir Nasir, Alonso Gamero-Quijano, Christelle Despas, Manuel Dossot, Grégoire Herzog, et al.. Signal amplification by electro-oligomerisation for improved isoproturon detection. Talanta, Elsevier, 2020, 220, pp.121347. �10.1016/j.talanta.2020.121347�. �hal-02947712�
1
Signal amplification by electro-oligomerisation for
improved isoproturon detection
Tauqir Nasir,a ǀǀ Alonso Gamero-Quijano,b Christelle Despas,a Manuel Dossot,a Grégoire
Herzog,* a Alain Walcarius* a
a Université de Lorraine, CNRS, LCPME, F-54000 Nancy, France
b The Bernal Institute and Department of Chemical Sciences, School of Natural Sciences,
University of Limerick V94 T9PX, Ireland
*Corresponding author: gregoire.herzog@univ-lorraine.fr; alain.walcarius@univ-lorraine.fr.
ǀǀ
Present address: Faculty of Engineering and Physical Sciences, School of Chemistry, University of Southampton SO17 1BJ, United Kingdom.
This document is a postprint. Final version has been published in Talanta 2020, 220, 121347 (https://doi.org/10.1016/j.talanta.2020.121347).
Abstract
A novel concept is introduced for signal amplification in electrochemical sensing: the electro-oligomerisation stripping voltammetry, which has been applied here to the improved detection of the isoproturon herbicide in spring waters as a proof-of-principle. It involves a potentiostatic accumulation step onto a glassy carbon electrode (at +1.5 V vs Ag/AgCl reference electrode for 300 s) leading to the formation of an oligomeric film, which is then detected by cathodic stripping square wave voltammetry (SWV). The presence and composition of the film are confirmed by confocal Raman spectroscopy. Its characterisation by cyclic voltammetry demonstrates the reversible nature of the electrodeposited material, confirming its interest for sensitive detection by SWV. Adding a mesoporous silica membrane with vertically oriented nanochannels further enhances the sensitivity of the sensor, exhibiting a linear response in the 10-100 µM concentration range. This effect was even more interesting for real media analysis thanks to the permselective properties of such nanoporous coating in rejecting interferences and/or surface fouling agents. The method should be applicable to other analytes that are usually not detectable by conventional accumulation/stripping voltammetry.
Keywords: Stripping Voltammetry; Modified Electrode; Mesoporous Silica Film; Raman
2
1. Introduction
The improvement of sensitivity and limits of detection of electrochemical sensors is part of the challenges of analytical chemists. Accumulation (or preconcentration) steps have been implemented to electrochemical techniques to push further the analytical performances of electrochemical sensors and match the concentration in real sample measurements. Stripping methods are among the most common strategies for preconcentration [1–4]. They consist of the accumulation of the target analyte on the electrode surface by a faradaic process of anodic or cathodic nature, which is then followed by the reverse reaction under electrochemical monitoring. The quantitative analysis is provided by either stripping voltammetry or potentiometric stripping analysis, which signals are proportional to the concentration of the target analytes. Stripping methods are particularly suited for the detection of metal ions in aqueous samples [5–8]. Unfortunately, many analytes (e.g. organic molecules) cannot be accumulated at the electrode surface by a reversible faradaic process and some approaches have been developed, such as adsorptive stripping voltammetry [9–12], electrochemical generation of sparingly-soluble complexes prior to stripping analysis [13], or extractive stripping voltammetry [14]. Insertive stripping voltammetry has been also proposed for the detection of non-redox ions [15]. Nevertheless, new strategies still need to be devised to achieve improved sensitivities, in particular for the detection of soluble contaminants in the environment. For this study we selected isoproturon (N,N-dimethyl-N’-[4-(propan-2-yl)phenyl]urea) an electroactive herbicide [16–21], which can be oxidised to 4-isopropylaniline (4-(propan-2-yl)aniline) [18]. Isoproturon is mainly used in cereal crop production to prevent the growth of broad leaf weeds. It is water soluble with a half-life of up to one year in groundwater and up to 40 days in surface water [22]. Isoproturon and its metabolites have been identified as carcinogenic and it has been banned in the European Union since 2016 due to its tendency to disrupt the endocrine system [23]. We propose here to use the electrochemical activity of 4-isopropylaniline, product of the isoproturon oxidation, to improve the detection of isoproturon. Indeed, aniline derivatives are known to form electroactive polymers on the surface of electrodes [24].
Furthermore, protection of the electrode surface can be essential in terms of environmental sensing. In recent years, mesoporous silica film (MSF) electrodes have shown very promising results in the field of electrochemical sensors and separation [25–32]. Such membranes can be prepared by either electrochemically assisted self-assembly (EASA) [33,34] or by Stöber-solution growth [35], magnetically induced orientation [36], epitaxial growth [37] or via an
oil-3 induced co-assembly process [38]. The EASA method generally leads to the formation of defect-free film with a controlled thickness ranging from 50 to 150 nm [34], and with pore size adjustable between 2 and 3 nm [39]. MSF have been used as molecular sieves, excluding molecular probes with dimensions greater than the pore diameter [39–41]. Taking advantage of this size selectivity, the exclusion of small proteins have protected the electrode surface from fouling [41,42].
We investigated here the possibility to harness the electrochemical oxidation of 4-isopropylaniline to form a redox active film, which can be used as an analytical signal for the detection of isoproturon. The mechanism of the formation of the redox active film was studied by cyclic voltammetry. With a sufficiently high oxidation potential, redox-active species were deposited on the electrode surface and were then analysed by confocal Raman spectroscopy. Their identification was confirmed by theoretical Raman spectra calculated by Density Functional Theory (DFT). A calibration curve for isoproturon was then established using these redox active species electrodeposited through a mesoporous silica film, whose function was to protect the electrode surface from fouling.
2. Materials and methods
2.1. Chemicals and reagents
Tetraethoxysilane (TEOS, 98%, Alfa Aesar), 3-Aminopropyltriethoxysilane (APTES, 99%, Sigma Aldrich), Cetyltrimethylammonium bromide (CTAB, 99%, Acros), Tetrabutylammonium tetrafluoroborate (NBu4BF4,99%, Sigma Aldrich), Acetonitrile (ACN,
99.9% Sigma Aldrich), Ethanol (>95%, Carlo Erba), Hydrochloric acid (37%, Prolabo) were used for the modification of glassy carbon electrodes with silica films. Hexaammine-ruthenium(III) chloride, (98%, Sigma Aldrich) as redox probe with potassium chloride (99%, Prolabo) as supporting electrolyte, was used for characterization of electrode modification. Isoproturon (99.1%, Chem service) was used as target analyte. Perchloric acid (60%, Riedel de haen), Nitric acid (65%, Sigma Aldrich), Sodium hydroxide (pure pellets, Riedel de haen), Sodium chloride (98%, Prolabo), Sodium nitrate (98%, Prolabo), Sodium perchlorate (99%, Merck), Sodium sulfate (98%, Prolabo) were used as supporting electrolytes to analyse the electrochemical response of isoproturon. 4-isoproylaniline (99%, Aldrich) was distilled prior its use. All solutions were prepared with high-purity water (18.2 MΩ cm) obtained from a Purelab Option-Q from ELGA.
4
2.2. GCE modification with mesoporous silica films
Glassy carbon plates (SIGRADUR G plates, 20 mm × 10mm × 1 mm) were purchased from HTW (Germany) and used after polishing with alumina (3, 1, and 0.05 μm) on a polishing cloth followed by ultrasonication for 5 minutes in distilled water. Electrografting of APTES followed by mesoporous silica film formation was performed according to previously described methods [31,43]. APTES electrografting is performed to increase the mechanical stability of mesoporous silica films at carbon electrodes. Sol for the silica film formation was prepared by mixing ethanol and aqueous NaNO3 (0.1 M) in a 1/1 v/v ratio. TEOS and CTAB (100 and 32
mM, respectively) were added to this solution and pH adjusted to 3 using hydrochloric acid. This solution was stirred for 2.5 hours for proper hydrolysis and film was electrochemically deposited using galvanostatic condition (by applying current density j, of −0.74 mA cm−2 for 30s) [34]. Hexaammine-ruthenium(III) was used as redox probe for cyclic voltammetric characterization of electrode modifications. Template was removed from silica films using 0.1 M HCl in ethanol and stirring moderately for 1 hour.
2.3. Electrochemical methods
All experiments were carried out using three electrode system. Experiments involving aqueous solutions were performed using glassy carbon electrode (GCE) as working, stainless steel rod as counter and Ag/AgCl/1 M KCl (purchased from Metrohm, Switzerland) as reference electrodes. Silver wire was used as pseudo reference for APTES electrografting and silica film deposition. Galvanostatic experiments were performed with a PGSTAT 100 apparatus from Ecochemie (Metrohm Autolab, Switzerland). Cyclic and square wave voltammetry measurements were carried out using an EMStat2 apparatus. Square wave voltammetric conditions used were: E deposition 1.5 V, T deposition 300 seconds, equilibrium time 5 seconds, E step 2 mV, Amplitude 50 mV and Frequency 10 Hz.
2.4. Raman spectroscopy
Raman confocal microscopy was performed using a Renishaw Qontor set-up equipped with a laser wavelength of 785 nm, a ×100 objective with 0.85 of numerical aperture, a Renishaw Centrus 0LL829 Peltier-cooled CCD detector stabilized at -70°C. The laser output power was 100 mW and sent through a neutral density filter of 0.0001% of transmission to ensure a maximum laser irradiance below 250 mW.cm-2. For such experiments, the electrode material was changed to polycrystalline gold since glassy carbon electrodes gave strong sp2 carbon bands at 1350 cm-1 (D-band) and 1590 cm-1 (G-band), which overlapped the Raman peaks of the deposit. The sample was found sensitive to laser heating effect and this illumination
5 condition was optimum to obtain spectra with good signal to noise ratio and no detectable heating effect. The 1200 grooves per millimeter grating enabled a spectral resolution close to 1.5 cm-1. For each point in the Raman maps, 5 spectra of 4 s of acquisition were averaged. A
separation distance of 1 µm was used (both in X and Y directions) between each data points in the map. To spare time, only experimental data between 800 and 1800 cm-1 were collected, which corresponded to the spectral range available with the 1200 gr mm-1 grating at 785 nm without changing the grating position and increasing the acquisition time. Since most of the spectral changes were expected in this region (according to calculated DFT spectra), it was the best strategy to maintain reasonable acquisition time for Raman maps and benefit from spectral analysis.
Theoretical Raman spectra were calculated using Gaussian 09 and GaussView [44]. The quantum mechanical modelling method from geometry optimization and vibrational frequencies calculation was the density functional theory (DFT) using the B3LYP hybrid functional and the 6-311G++(d,p) basis set. A water solvation sphere was used (with a polarizable continuum model). The frequency of the calculated Raman modes were corrected using the equations given in reference [45]. These calculated spectra were used as input spectral components to the Renishaw Wire 5.2 software to perform component analysis maps based on non-negative least squares (NNLS) regression. To do so, the experimental Raman data were background corrected and cosmic peaks were removed (using the Renishaw Wire 5.2 software). Experimental Raman spectrum intensity was normalized from 0 to 1, as well as the intensity of calculated spectra from DFT computations. A NNLS method was used to calculate the weight of each DFT-calculated spectral component at all experimental data points in the Raman maps. We used the 5 possible spectral components (i.e., chemical compound) isoproturon, 4-isopropylaniline, di(isopropyl)azobenzene ((E)-bis[4-(propan-2-yl)phenyl]diazene), di(isopropyl)-2-aminodiphenylamine ((1Z)-4-(propan-2-yl)-N1 -[3-(propan-2-yl)phenyl]cyclohexa-3,5-diene-1,2-diimine), di(isopropyl)phenazine (2,7-di(propan-2-yl)phenazine). One should notice that it was impossible to find experimental data points in the Raman maps corresponding to a unique component, at least two compounds were always present in each case. However, we found some locations richer in a given compound, which enabled us to extract some spectra and compare them to DFT calculated ones. These data are shown below, with the corresponding spectral weight maps, for each compound.
6 Both anionic and cationic compositions of real samples were determined by ion chromatography using a Metrohm 882 Compact IC plus instrument equipped with a high-pressure pump, sequential (Metrohm CO2 suppressor MCS) and chemical (Metrohm
suppressor MSM II for chemical) suppression modules and a conductivity detector. The anion separation was performed on a MetrosepA Supp 4-250/4.0 column packed with polyvinyl alcohol particles functionalized with quaternary ammonium group (9 µm particles diameter) and preceded by a guard column (Metrosep A supp 4/5 guard) and an RP 2Guard column to remove traces of organic compounds. The mobile phase consisted of a solution of Na2CO3 (1.8
mmol L-1) and NaHCO3 (1.7 mmol L-1) in ultrapure water (18.2 MΩ cm at 293 K). The flow
rate was 1 mL min-1 and the sample loop volume was 20 µL. The cation separation was performed on a Metrosep C6-150/4.0 column packed with silica gel particles functionalized with carboxyl groups (5 µm particles diameter) and preceded by a guard column (Metrosep C6/4.0 guard) and an RP 2Guard column to remove traces of organic compounds. The mobile phase consisted of a solution of HNO3 (1.7 mmol L-1) and picolinic acid (1.7 mmol L-1) in
ultrapure water (18.2 MΩ cm at 293 K). The flow rate was 0.9 mL min-1 and the sample loop
volume was 5 µL. The MagIC Net™ 2.3 Professional chromatography software controlled the 882 Compact IC plus instrument and its peripherals. Real samples were spring waters collected in the watershed of the Strengbach River (Vosges, France) and were stored at 4°C and used for electrochemical experiments after addition of 0.1 M NaNO3 as supporting electrolyte. pH of
real samples was found to be 6.4. The electrochemical stripping analyses were performed directly in these samples spiked with isoproturon at selected concentrations.
3. Results and discussion
3.1. Oxidation of isoproturon
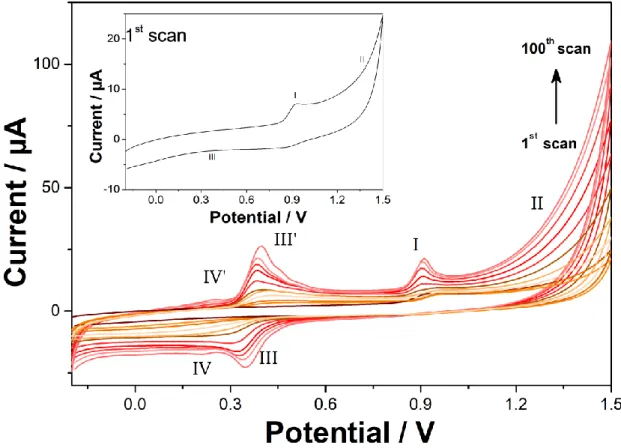
Figure 1 illustrates the electrochemical behaviour of isoproturon, as investigated by cyclic voltammetry at a bare GCE. On the first cyclic voltammogram (inset of Figure 1), an oxidation peak (noted I on Figure 1) at +0.93 V was observed and followed by an increase of the anodic current (noted II). The cathodic wave at + 0.35 V (noted III) was not apparent on the first scan. In the subsequent cycles, a pair of peaks (III and III’) rose continuously at +0.35 V (III) and +0.40 V (III’) from the second scan up to 100 scans. Finally, a second pair of peaks rose at +0.21 V (IV) and +0.26 (IV’). Peak I was attributed to the oxidation of isoproturon [18–21], which led to the formation of 4-isopropylaniline. This product can be subsequently oxidised (peak II) to a radical cation leading to further oxidation [46]. The shape of peak I changed with
7 the number of scans. At first, peak I seemed to be the result of an oxidative process controlled by diffusion of species in solution, before changing to an adsorption peak A magnification of this potential region is shown in Figure SI1. This evolution of the peak shape was probably due to a change in the electron transfer mechanism. For the first cycles, isoproturon molecules were oxidised directly at the electrode surface, whereas, once an electroactive film was formed on the electrode surface, isoproturon was oxidised through the film. Peak I potential and the onset of the electropolymerisation potential were shifted to lower values upon repetitive cycling, indicating that direct oxidation of isoproturon and subsequent oxidation required lower energy (Figure SI2).
Figure 1: Repetitive cyclic voltammetry of 100 µM isoproturon in 0.1 M NaClO4 (pH 6) at a
bare glassy carbon electrode, scan rate = 100 mV s-1. Only the 1st, 10th, 20th, 30th, 40th, 50th, 60th, 70th, 80th, 90th, and 100th cycles are shown for clarity reasons.
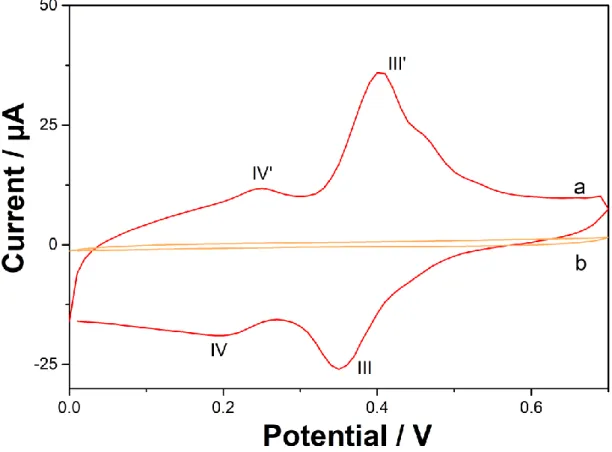
Oligomeric species formed from 4-isopropylaniline have lower oxidation potentials, resulting in faster film growth [47–49]. Peaks III & III’ and IV & IV’ were the direct consequences of the oxidation reaction (II). If the potential sweep direction was reversed before the onset of II, peaks III and III’ were not observed. Figure 2A shows the 5th scans of two series of cyclic
voltammograms. The potential was scan up to +1.5 V, allowing the electro-oligomerisation to occur. On this curve, peaks III and III’ were not as well defined as after 100 cycles but nevertheless present. When the change of potential scan direction was set at +1.2 V, these two
8 peaks were absent (curve b on Figure 2A). As a control experiment, the electrochemical behaviour of 100 µM 4-isopropylaniline was investigated under the same conditions than isoproturon, (Figure 2B). 4-isopropylaniline was oxidised at + 1.3 V and the continuous cycling of the potential window ranging from -0.15 V to + 1.5 V led to the rise of two poorly resolved electrochemical processes at E1/2 = +0.376 V and +0.288 V (Figure 2B, curve b), which were
in the similar potential region than the one observed for isoproturon. This control experiment confirmed that 4-isopropylaniline could be an intermediate product of the oxidation shown as peak I (Figure 1), which is further oxidised.
Figure 2: (A) 5th cyclic voltammograms obtained for 100 µM isoproturon in 0.1 M NaClO4
(pH 6), scan rate = 100 mV s-1. Vertex potential was + 1.5 V (curve a in red) or + 1.2 V (curve b in orange). (B) 100th scan after cyclic voltammetry in the presence of 100 µM isoproturon
(curve a in red), 100 µM 4-isopropylaniline (curve b in blue) in 0.1 M NaClO4 (pH 6), scan
rate = 100 mV s-1. Control experiment in 0.1 M NaClO4 (in the absence of redox probe) is
shown as curve c.
3.2. Modified electrode characterisation
The deposit formed on the electrode surface was characterised by electrochemistry and by confocal Raman microscopy. For the electrochemical characterisation, a GCE was modified
9 by cycling 100 times between 0 and + 1.5 V in an electrolyte solution of 0.1 M NaClO4 (pH 6)
containing 100 µM isoproturon. The modified electrode was then rinsed with DI water and transferred to an electrochemical cell filled with 0.1 M NaClO4 (pH 6). Cyclic voltammogram
in the absence of isoproturon (i.e., blank electrolyte solution) still showed the two pairs of peaks III/III’ and IV/IV’, confirming that the electrode surface has been modified and coated with an electrochemically active component through repetitive cycling (Figure 3). The increase in capacitance (measured at +0.6 V) from 5.9 µF before repetitive cyclic voltammetry, to 47.6 µF also confirmed the electrode surface modification. The peak charge for III’, with a value of 24.4 µC, is much larger than the charge for IV’ with a value of 8.5 µC.
Figure 3: Cyclic voltammogram in 0.1 M NaClO4 (pH 6), scan rate = 100 mV s-1, of a GCE
subjected to 100 CV cycles in isoproturon medium and then transferred into a blank electrolyte solution (curve a, the electrode was modified under the same conditions as in Figure 1), and of an electrode cycled in the absence of isoproturon as a control experiment (curve b, all conditions, other than isoproturon concentration were the same as curve a).
The origin of these two pairs of peaks is unlikely to be due to the presence of poly(4-isopropylaniline) at the electrode surface. The peak-to-peak separation of both III/III’ and IV/IV’ is close to 60 mV while, in the case of polyaniline, the peak to peak separation is closer to 120 mV [50,51]. These peaks are more likely to be due to the formation of an electroactive film resulting from the oxidation of 4-isopropylaniline at the electrode surface than to the formation of a truly conducting polymer. Scheme 1 presents three possible redox active dimers:
10
1 di(isopropyl)azobenzene, 2 di(isopropyl)-2-aminodiphenylamine, 3 di(isopropyl)phenazine
that could be formed at the electrode surface.
Scheme 1: Possible redox active dimers formed by the 4-isopropylaniline oxidation; 1:
di(isopropyl)azobenzene, 2: di(isopropyl)-2-aminodiphenylamine; 3: di(isopropyl)phenazine.
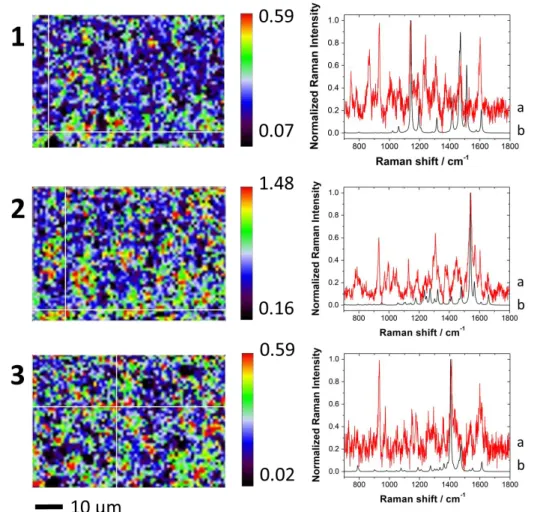
The electrochemical activity of similar aniline dimers was reported for azobenzene [52], 2-aminodiphenylamine [53], and phenazine [54]. The nature of the deposit formed on an electrode surface was investigated ex-situ by confocal Raman microscopy (Figure 4). The spatial distribution of the three compounds 1, 2 and 3 of Scheme 1 was shown using the weight of the NNLS analysis performed on the Raman hyperspectral data. Calculated DFT corrected spectra of compounds 1, 2 and 3 were used as spectral source (i.e. components) for the analysis. The Raman shift of the calculated DFT spectra was corrected using experimental and theoretical spectra of isoproturon (Figure SI3). The three dimers differed from the way monomers reacted with one another. It could be through the formation of either an azo group (dimer 1), or of an amine bridge (dimer 2) or of a phenazine structure (dimer 3). A distinct Raman shift was predicted for each of these three possible bindings (Figure SI4). For dimer 1, a peak at 1142 cm-1 was attributed to stretching of the C-N bond coupled to the in-plane bending
of aromatic C-H, while the C=N-C asymmetric stretching and the deformations of the phenyl rings were responsible for the peak at 1540 cm-1 in the predicted spectrum for dimer 2. The
phenazine structure of dimer 3 gave a peak at 1406 cm-1 due to symmetrical C-N=C bending coupled to the stretching of the aromatic C=C. Dimers 1-3 could be differentiated from the starting monomer, 4-isopropylaniline, which showed a peak at 1620 cm-1, caused by the NH2
symmetrical stretching and the aromatic C=C stretching. Raman peaks predicted by DFT computations for compounds 1, 2 and 3 were found in the experimental data with very good agreement. Higher weight indicated a larger quantity of the compound was found at the data point analysed in the map. It was not possible to find a location in the Raman map which corresponded to a unique chemical compound, so additional peaks coming from the other possible species were always present in addition to those assigned to the specific compound analysed in the map. However, Raman spectra proved that the intermediate species 1, 2 and 3 were present on the electrode surface with patchy spatial distributions. It also seemed that the
11 patches for each compound were not located in the same area of the electrode. Supporting information reported the same kind of analysis for isoproturon and 4-isopropylaniline, and it showed (Figures SI5) that isoproturon was still present on the electrode surface, and 4-isopropylaniline could also be found as an intermediate species. Therefore, Raman data agreed well with electrochemical data and confirmed well the chemical intermediates proposed to explain the mechanism of the isoproturon oxidation.
Figure 4: Confocal Raman spectroscopy obtained after modification by repetitive cyclic
voltammetry in the presence of 100 µM isoproturon. Raman mapping (left) spectra for compounds 1, 2, and 3 of scheme 1. Coloured scales indicated the magnitude of the weight for each compound in the map. Spectra on the right show in black (curves b) the calculated DFT corrected spectrum of compounds 1, 2 and 3 (from top to bottom) and in red (curves a) an example of experimental spectrum in the map indicated by the white crosshair in the corresponding map on the left.
3.3. Amplified signal for isoproturon detection
In previous reports [17–21], electrochemical detection was based on the direct oxidation of isoproturon in acidic media (0 < pH < 1). In addition, isoproturon oxidation was an irreversible electrochemical process and was not improved by pulsed voltammetry techniques. The electrochemical behaviour of isoproturon shown in section 3.2 suggested that its
12 electrochemical detection could be amplified through the electro-oligomerisation at the electrode surface. In addition, the reversible nature of the couple III/III’ favoured the use of square wave voltammetry as the detection method. For further analytical investigation, isoproturon signal amplification was achieved through electro-oligomerisation at + 1.5 V for an optimized time of 300 s (Figure SI6) before detection by square wave voltammetry from 0.8 to 0.0 V. Square wave voltammetry experiments were recorded for increasing isoproturon concentrations ranging from 10 to 100 µM (Figure 5A). The peak current was linear with the concentration from 10 to 80 µM before levelling off. The sensitivity achieved through signal amplification is much higher than the one with isoproturon direct oxidation (black triangles in Figure 4A). These results showed that the isoproturon signal was amplified by the electro-oligomerisation, acting as a preconcentration step at the electrode surface. The signal amplification was possible at pH close to neutral, which constituted an advantage over direct oxidation methods, conducted in strongly acidic conditions [17–21]. The nature of the counter-ion (ClO4-, NO3-, SO42- and Cl-) of the supporting electrolyte was also varied and its impact on
the current associated to the III/III’ peaks (Figure SI7). In all cases, oxidation II occurred although peaks III and III’ were ill-defined in the presence of chloride ions. The order of the oxidation currents for II with various electrolytes agrees with the literature data available for poly(aniline): SO42- > NO3- > ClO4-> Cl- [55,56]. In the presence of chloride ions, oxidative
current at the positive end of the potential window was much higher than with the other ions (Inset of Figure SI7). This could be due to the formation of chlorine at such potentials. Sodium nitrate was selected as a background electrolyte as nitrate ions are more likely to be found in the environment than perchlorate ions.
Furthermore, the analysis of real samples by electrochemical sensors remained challenging because of the presence of interfering species. These are responsible for non-specific adsorption and hence of the hampering of the electrochemical signal. Recent works have reported the use of electrodes modified with mesoporous silica thin films to protect the electrode surface from adsorption of interfering species [28,31,41,42,57–60]. We have investigated here the signal amplification approach described above through a mesoporous silica film (MSF) generated onto the electrode surface. Previous studies suggested that this could be possible as some conductive polymers were successfully electrodeposited through mesoporous silica thin films [61–63]. At the lowest isoproturon concentrations (10 < [isoproturon] < 40 µM), there was no significant difference between the peak current achieved at a GCE (red squares on Figure 4B) and the one achieved at a MSF electrode (blue circles on
13 Figure 4B). However, when [isoproturon] ≥ 40 µM, the peak currents at MSF electrodes were significantly greater than at the GCE. This could be explained by the higher concentration of oxidized species in the vicinity of the electrode and resulting in the electrodeposition of a larger number of oligomers at the MSF surface and hence improving the signal amplification.
Figure 5: (A) Square wave voltammetry of 10-100 µM isoproturon in 0.1 M NaNO3 at a bare
GCE using direct oxidation peak (blank) and the signal amplification by electro-oligomerisation. (B) Calibration curves for isoproturon (10 – 100 µM) using direct oxidation
14 (▲) and signal amplification by electro-oligomerisation at a GCE () and at a MSF electrode (●).
3.4. Analysis of real samples
Spring water samples were analysed by ion chromatography to estimate their ionic strength. The anion concentrations were measured at 24, 8, and 47 µM with retention times of 6.3, 9.1, and 17.4 minutes for Cl-, NO
3-, and SO42-, respectively. Cation concentration were determined
at 143 µM for Na+, 0.3 µM for K+, 50 µM for Ca2+ and 22 µM for Mg2+ with retention times
of 7.5, 13.4, 16.2, and 23.4 min, respectively. In order to conduct electrochemical measurements, 0.1 M NaNO3 was added to the samples. Spring water samples were then spiked
with various isoproturon concentrations to be analysed by the signal amplification method described in section 3.2. Both bare GC and MSF electrode were used for these analyses. For a 20 µM isoproturon concentration, a peak of -0.47 µA is measured at a MSF electrode while no signal was observed at the bare GCE (Figure 6A). As the isoproturon concentration increased, a peak is observed at the bare GCE but it remained significantly lower than the peak current measured at the MSF electrodes (Figure 6B). For a 70 µM isoproturon concentration, the peak current at the MSF electrode is -1.50 µA while it was -0.39 µA at the bare GCE. The greater peak observed at the MSF electrode than at the bare GCE can be attributed to a double effect. Firstly, the MSF can act as a molecular sieve on the electrode surface, limiting electrode surface fouling. In the case of this water sample, the protection offered by the MSF is not complete as peak currents are 6-9 times lower than with clean laboratory solutions. In addition to this role of surface protection, local concentration of oxidized species within MSF might be higher than at a bare electrode and hence favour the oligomerization and the preconcentration as already described for Figure 5B. This improved signal amplification is different from the one already reported for paraquat by our group, as isoproturon is a neutral species and is not accumulated in the anionic films unlike cationic probes such as paraquat [31]. The method is also conceptually different from other signal amplification approaches such as those developed in electrochemical biosensors or immunosensors [64–68], and it offers the advantage of being simpler and does not require the use of expensive biological materials to modify the electrode surface.
15
Figure 6: (A) Square wave voltammetry of 20 (left) and 70 (right) µM isoproturon in a spring
sample (added electrolyte: 0.1 M NaNO3) obtained at a GCE (black curve) and at MSF
electrode. (B) Calibration curves for isoproturon (10 – 100 µM) using signal amplification by electro-oligomerisation at GCE () and MSF electrodes (●).
16 Isoproturon is oxidized at the surface of a GCE to form 4-isopropylaniline, which is further oxidized to form electroactive active oligomers, presenting reversible electrochemical behaviour. This electrochemical signal increased with the number of cycles between -0.15 and +1.5 V, modifying the electrode surface. The presence of these products on the electrode surface was established by electrochemical studies and confirmed by ex-situ Raman spectroscopy mapping. The variety of the Raman spectra supported the products heterogeneity of the successive oxidation of isoproturon and 4-isopropylaniline at the electrode surface. Three dimers of 4-isopropylaniline were suggested as possible products of the oxidation reactions, which were confirmed by comparison of their DFT calculated and experimental spectra. Despite the heterogeneity of the electrode surface, the amount of redox-active oxidation products, which were electrodeposited on the electrode surface, increased with time. The electrodeposition step was thus used as a preconcentration step and the electrochemical signal increased linearly with the isoproturon concentration, offering greater analytical possibilities than with direct oxidation of isoproturon. Finally, this approach was successfully tested with an electrode surface protected with a mesoporous silica film for the detection of isoproturon in spiked river water samples. This signal amplification approach could be extended to a number of methylurea-based herbicides that present a similar chemical structure (e.g. diuron, chlortoluron, fenuron, linuron, monolinuron, metobromuron, metoxuron, monuron, siduron, neburon).
Acknowledgements
The authors thank the French PIA project “Lorraine Université d'Excellence” (Reference No. ANR-15-IDEX-04-LUE). T.N. is grateful to the Higher Education Commission of Pakistan for funding his Ph.D. We also thank Ms Claire Genois for the ion chromatography determination of ion concentrations and Dr Neus Vila for her help on the 4-isopropylaniline distillation.
Content of the supporting information section:
Characterisation of isoproturon peak oxidation by cyclic voltammetry, effect of electrolyte nature; Raman control experiments and DFT calculations; Time dependence of square wave voltammetry peak currents.
17
References
[1] J. Wang, Stripping Analysis: Principles, Instrumentation and Applications, Wiley-VCH, Deerfield Beach, CA, 1985.
[2] K. Brainina, E. Neiman, Electroanalytical Stripping Methods, Wiley, New York, 1993. [3] S. Cheraghi, M.A. Taher, M. Bijad, H. Sadeghifar, A Review: Stripping Voltammetric
Methods as a High Strategy for Trace Analysis of Ions, Pharmaceutical and Food Samples, Curr. Anal. Chem. 13 (2017) 5–12.
[4] A. Economou, Recent developments in on-line electrochemical stripping analysis-An overview of the last 12 years, Anal. Chim. Acta. 683 (2010) 38–51.
https://doi.org/10.1016/j.aca.2010.10.017.
[5] A.J. Borrill, N.E. Reily, J. V. Macpherson, Addressing the practicalities of anodic stripping voltammetry for heavy metal detection: A tutorial review, Analyst. 144 (2019) 6834–6849. https://doi.org/10.1039/c9an01437c.
[6] L. Pujol, D. Evrard, K. Groenen-Serrano, M. Freyssinier, A. Ruffien-Cizsak, P. Gros, Electrochemical sensors and devices for heavy metals assay in water: The French groups’ contribution, Front. Chem. 2 (2014) 1–24.
https://doi.org/10.3389/fchem.2014.00019.
[7] X. Niu, M. Lan, H. Zhao, C. Chen, Y. Li, X. Zhu, Review: Electrochemical Stripping Analysis of Trace Heavy Metals Using Screen-Printed Electrodes, Anal. Lett. 46 (2013) 2479–2502. https://doi.org/10.1080/00032719.2013.805416.
[8] J. Wang, Stripping-based electrochemical metal sensors for environmental monitoring, in: S. Alegret, A. Merkoçi (Eds.), Compr. Anal. Chem., Vol. 49, Elsevier, 2007: pp. 131–141.
[9] J.C. Vire, J.M. Kauffmann, G.J. Patriarche, Adsorptive stripping voltammetry applied to drug analysis: A powerful tool, J. Pharm. Biomed. Anal. 7 (1989) 1323–1335. https://doi.org/10.1016/0731-7085(89)80138-4.
[10] C.M.G. Van Den Berg, Adsorptive cathodic stripping voltammetry of trace elements in sea water, Analyst. 114 (1989) 1527–1530. https://doi.org/10.1039/AN9891401527. [11] M.M. Aleksic, V. Kapetanovic, Application of Adsorptive Stripping Voltammetry for
18 the Determination of Selected Methoxyimino Cephalosporins in Urine Samples., Comb Chem High T Scr. 13 (2010) 758–763.
[12] D.W.M. Arrigan, M.J. Hackett, R.L. Mancera, Electrochemistry of proteins at the interface between two immiscible electrolyte solutions, Curr. Opin. Electrochem. 12 (2018) 27–32. https://doi.org/10.1016/j.coelec.2018.07.012.
[13] M. Fojta, F. Jelen, L. Havran, E. Paleček, Electrochemical Stripping Techniques in Analysis of Nucleic Acids and their Constituents, Curr. Anal. Chem. 4 (2008) 250– 262.
[14] M. Sys, A.S. Farag, I. Svancara, Extractive Stripping Voltammetry at Carbon Paste Electrodes for Determination of Biologically Active Organic Compounds, Monatshefte Fur Chemie. 150 (2019) 373–386.
[15] A.L. Suherman, M. Lin, B. Rasche, R.G. Compton, Introducing “Insertive Stripping Voltammetry”: Electrochemical Determination of Sodium Ions Using an Iron(III) Phosphate-Modified Electrode, ACS Sensors. 5 (2020) 519–526.
https://doi.org/10.1021/acssensors.9b02343.
[16] S. Li, H. Tao, J. Li, Molecularly Imprinted Electrochemical Luminescence Sensor Based on Enzymatic Amplification for Ultratrace Isoproturon Determination, Electroanalysis. 24 (2012) 1664–1670. https://doi.org/10.1002/elan.201200088. [17] P. Noyrod, O. Chailapakul, W. Wonsawat, S. Chuanuwatanakul, The simultaneous
determination of isoproturon and carbendazim pesticides by single drop analysis using a graphene-based electrochemical sensor, J. Electroanal. Chem. 719 (2014) 54–59. https://doi.org/10.1016/j.jelechem.2014.02.001.
[18] P. Manisankar, G. Selvanathan, C. Vedhi, Utilization of sodium montmorillonite clay-modified electrode for the determination of isoproturon and carbendazim in soil and water samples, Appl. Clay Sci. 29 (2005) 249–257.
https://doi.org/10.1016/j.clay.2005.01.006.
[19] P. Manisankar, G. Selvanathan, C. Vedhi, Determination of pesticides using
heteropolyacid montmorillonite clay-modified electrode with surfactant, Talanta. 68 (2006) 686–692. https://doi.org/10.1016/j.talanta.2005.05.021.
[20] P. Manisankar, G. Selvanathan, C. Vedhi, Utilisation of polypyrrole modified electrode for the determination of pesticides, Int. J. Environ. Anal. Chem. 85 (2005)
19 409–422. https://doi.org/10.1080/03067310500050726.
[21] P. Manisankar, P.A. Sundari, R. Sasikumar, S. Palaniappan, Electroanalysis of some common pesticides using conducting polymer/multiwalled carbon nanotubes modified glassy carbon electrode, Talanta. 76 (2008) 1022–1028.
https://doi.org/10.1016/j.talanta.2008.04.056.
[22] G. Kulshrestha, S.K. Mukerjee, The photochemical decomposition of the herbicide isoproturon, Pestic. Sci. 17 (1986) 489–494. https://doi.org/10.1002/ps.2780170506. [23] B.E. Erickson, EU bans endocrine disrupting herbicides, Chem. Eng. News. 94 (2016)
18. https://cen.acs.org/articles/94/i17/EU-bans-endocrine-disrupting-herbicides.html. [24] W. Huang, B.D. Humphrey, A.G. MacDiarmid, Polyaniline , a Novel Conducting
Polymer, J. Chem. Soc. Faraday Trans. 1. 82 (1986) 2385–2400.
[25] A. Walcarius, Mesoporous Materials-Based Electrochemical Sensors, Electroanalysis. 27 (2015) 1303–1340. https://doi.org/10.1002/elan.201400628.
[26] F. Yan, X. Lin, B. Su, Vertically ordered silica mesochannel films: electrochemistry and analytical applications, Analyst. 141 (2016) 3482–3495.
https://doi.org/10.1039/C6AN00146G.
[27] A. Walcarius, Silica-based electrochemical sensors and biosensors: Recent trends, Curr. Opin. Electrochem. 10 (2018) 88–97.
https://doi.org/10.1016/j.coelec.2018.03.017.
[28] P. Zhou, L. Yao, K. Chen, B. Su, Silica Nanochannel Membranes for Electrochemical Analysis and Molecular Sieving: A Comprehensive Review, Crit. Rev. Anal. Chem. (2020) https://doi.org/10.1080/10408347.2019.1642735.
https://doi.org/10.1080/10408347.2019.1642735.
[29] M. Etienne, A. Quach, D. Grosso, L. Nicole, C. Sanchez, A. Walcarius, Molecular Transport into Mesostructured Silica Thin Films: Electrochemical Monitoring and Comparison between p 6 m , P6 3 / mmc , and Pm 3 n Structures, Chem. Mater. 19 (2007) 844–856. https://doi.org/10.1021/cm0625068.
[30] T. Nasir, N.A. Vodolazkaya, G. Herzog, A. Walcarius, Critical Effect of Film Thickness on Preconcentration Electroanalysis with Oriented Mesoporous Silica Modified Electrodes, Electroanalysis. 31 (2019) 202–207.
20 https://doi.org/10.1002/elan.201800533.
[31] T. Nasir, G. Herzog, M. Hébrant, C. Despas, L. Liu, A. Walcarius, Mesoporous Silica Thin Films for Improved Electrochemical Detection of Paraquat, ACS Sensors. 3 (2018) 484–493. https://doi.org/10.1021/acssensors.7b00920.
[32] N. Vilà, P. de Oliveira, A. Walcarius, I.M. Mbomekallé, pH-modulated ion transport and amplified redox response of Keggin-type polyoxometalates through vertically-oriented mesoporous silica nanochannels, Electrochim. Acta. 309 (2019) 209–218. https://doi.org/10.1016/j.electacta.2019.03.119.
[33] A. Walcarius, E. Sibottier, M. Etienne, J. Ghanbaja, Electrochemically assisted self-assembly of mesoporous silica thin films., Nat. Mater. 6 (2007) 602–608.
https://doi.org/10.1038/nmat1951.
[34] A. Goux, M. Etienne, E. Aubert, C. Lecomte, J. Ghanbaja, A. Walcarius, Oriented Mesoporous Silica Films Obtained by Electro-Assisted Self-Assembly (EASA), Chem. Mater. 21 (2009) 731–741. https://doi.org/10.1021/cm8029664.
[35] Z. Teng, G. Zheng, Y. Dou, W. Li, C.-Y.Y. Mou, X. Zhang, A.M. Asiri, D. Zhao, Highly Ordered Mesoporous Silica Films with Perpendicular Mesochannels by a Simple Stöber-Solution Growth Approach, Angewan. Chem. Int. Ed. 51 (2012) 2173– 2177. https://doi.org/10.1002/anie.201108748.
[36] Y. Yamauchi, M. Sawada, M. Komatsu, A. Sugiyama, T. Osaka, N. Hirota, Y. Sakka, K. Kuroda, Magnetically induced orientation of mesochannels in mesoporous silica films at 30 Tesla, Chem. Asian J. 2 (2007) 1505–1512.
https://doi.org/10.1002/asia.200700244.
[37] E.K. Richman, T. Brezesinski, S.H. Tolbert, Vertically oriented hexagonal mesoporous films formed through nanometre-scale epitaxy, Nat. Mater. 7 (2008) 712–717.
https://doi.org/10.1038/nmat2257.
[38] K.C. Kao, C.H. Lin, T.Y. Chen, Y.H. Liu, C.Y. Mou, C.T. Y, Y.H. Liu, C.Y. Mou, A General Method for Growing Large Area Mesoporous Silica Thin Films on Flat Substrates with Perpendicular Nanochannels, J. Am. Chem. Soc. 137 (2015) 3779– 3782. https://doi.org/10.1021/jacs.5b01180.
[39] N. Vilà, E. André, R. Ciganda, J. Ruiz, D. Astruc, A. Walcarius, Molecular Sieving with Vertically Aligned Mesoporous Silica Films and Electronic Wiring through
21 Isolating Nanochannels, Chem. Mater. 28 (2016) 2511–2514.
https://doi.org/10.1021/acs.chemmater.6b00716.
[40] X. Lin, Q. Yang, L. Ding, B. Su, Ultrathin Silica Membranes with Highly Ordered and Perpendicular Nanochannels for Precise and Fast Molecular Separation, ACS Nano. 9 (2015) 11266–11277. https://doi.org/10.1021/acsnano.5b04887.
[41] M.B. Serrano, C. Despas, G. Herzog, A. Walcarius, Mesoporous silica thin films for molecular sieving and electrode surface protection against biofouling, Electrochem. Commun. 52 (2015) 34–36. https://doi.org/10.1016/j.elecom.2015.01.010.
[42] Q. Sun, F. Yan, L. Yao, B. Su, Anti-Biofouling Isoporous Silica-Micelle Membrane Enabling Drug Detection in Human Whole Blood, Anal. Chem. 88 (2016) 8364–8368. https://doi.org/10.1021/acs.analchem.6b02091.
[43] T. Nasir, L. Zhang, N. Vilà, G. Herzog, A. Walcarius, Electrografting of
3-Aminopropyltriethoxysilane on a Glassy Carbon Electrode for the Improved Adhesion of Vertically Oriented Mesoporous Silica Thin Films, Langmuir. 32 (2016) 4323– 4332. https://doi.org/10.1021/acs.langmuir.6b00798.
[44] M.J. Frisch, G.W. Trucks, H.B. Schlegel, G.E. Scuseria, M.A. Robb, J.R. Cheeseman, G. Scalmani, V. Barone, G.A. Petersson, H. Nakatsuji, X. Li, M. Caricato, A.
Marenich, J. Bloino, B.G. Janesko, R. Gomperts, B. Mennucci, H.P. Hratchian, J. V Ortiz, A.F. Izmaylov, J.L. Sonnenberg, D. Williams-Young, F. Ding, F. Lipparini, F. Egidi, J. Goings, B. Peng, A. Petrone, T. Henderson, D. Ranasinghe, V.G. Zakrzewski, J. Gao, N. Rega, G. Zheng, W. Liang, M. Hada, M. Ehara, K. Toyota, R. Fukuda, J. Hasegawa, M. Ishida, T. Nakajima, Y. Honda, O. Kitao, H. Nakai, T. Vreven, K. Throssell, J.A. Montgomery Jr, J.E. Peralta, F. Ogliaro, M. Bearpark, J.J. Heyd, E. Brothers, K.N. Kudin, V.N. Staroverov, T. Keith, R. Kobayashi, J. Normand, K. Raghavachari, A. Rendell, J.C. Burant, S.S. Iyengar, J. Tomasi, M. Cossi, J.M.
Millam, M. Klene, C. Adamo, R. Cammi, J.W. Ochterski, R.L. Martin, K. Morokuma, O. Farkas, J.B. Foresman, D.J. Fox, Gaussian 09, Revision B.01, (2016).
[45] T. Osaki, E. Soejima, Quadratic scaling functions for obtaining Normal vibrational wavenumbers from the B3LYP calculation, Res. Bull. Fukuoka Inst. Tech. 2 (2010) 129–134.
[46] W. Huang, B.D. Humphrey, A.G. Macdiarmid, Polyaniline , a Novel Conducting Polymer, (1986) 2385–2400.
22 [47] D.M. Mohilner, R.N. Adams, W.J. Argersinger, Investigation of the Kinetics and
Mechanism of the Anodic Oxidation of Aniline in Aqueous Sulfuric Acid Solution at a Platinum Electrode, J. Am. Chem. Soc. 84 (1962) 3618–3622.
https://doi.org/10.1021/ja00878a003.
[48] K. Sasaki, M. Kaya, J. Yano, A. Kitani, A. Kunai, Growth mechanism in the
electropolymerization of aniline and p-aminodiphenylamine, J. Electroanal. Chem. 215 (1986) 401–407. https://doi.org/10.1016/0022-0728(86)87033-4.
[49] Y. Wei, Y. Sun, X. Tang, Autoacceleration and kinetics of electrochemical polymerization of aniline, J. Phys. Chem. 93 (1989) 4878–4881.
https://doi.org/10.1021/j100349a039.
[50] J.-C. LaCroix, A.F. Diaz, Electrolyte Effects on the Switching Reaction of Polyaniline, J. Electrochem. Soc. 135 (1988) 1457. https://doi.org/10.1149/1.2096026.
[51] Y. Gawli, A. Banerjee, D. Dhakras, M. Deo, D. Bulani, P. Wadgaonkar, M. Shelke, S. Ogale, 3D Polyaniline Architecture by Concurrent Inorganic and Organic Acid Doping for Superior and Robust High Rate Supercapacitor Performance, Sci. Rep. 6 (2016) 21002. https://doi.org/10.1038/srep21002.
[52] Š. Komorsky-Lovrić, M. Lovrić, Measurements of redox kinetics of adsorbed azobenzene by “a quasireversible maximum” in square-wave voltammetry, Electrochim. Acta. 40 (1995) 1781–1784. https://doi.org/10.1016/0013-4686(95)00097-X.
[53] M.A. Cotarelo, F. Huerta, C. Quijada, R. Mallavia, J.L. Vázquez, Synthesis and Characterization of Electroactive Films Deposited from Aniline Dimers, J. Electrochem. Soc. 153 (2006) D114. https://doi.org/10.1149/1.2198010.
[54] D.N. Bailey, D.M. Hercules, D.K. Roe, Electrochemistry and Photopotentials of Phenazine in Methanol Solutions, J. Electrochem. Soc. 116 (1969) 190.
https://doi.org/10.1149/1.2411793.
[55] Z. Mandic, L. Duic, F. Kovacicek, The influence of counter-ions on nucleation and growth of electrochemically synthesized polyaniline film, Electrochim. Acta. 42 (1997) 1389–1402.
[56] M.J. Ariza, T.F. Otero, Nitrate and chloride transport through a smart membrane, J. Memb. Sci. 290 (2007) 241–249. https://doi.org/10.1016/j.memsci.2006.12.040.
23 [57] F. Yan, W. Zheng, L. Yao, B. Su, Direct electrochemical analysis in complex samples
using ITO electrodes modified with permselective membranes consisting of vertically ordered silica mesochannels and micelles, Chem. Commun. 51 (2015) 17736–17739. https://doi.org/10.1039/C5CC08425C.
[58] B. Cheng, L. Zhou, L. Lu, J. Liu, X. Dong, F. Xi, P. Chen, Simultaneous label-free and pretreatment-free detection of heavy metal ions in complex samples using electrodes decorated with vertically ordered silica nanochannels, Sens. Actuators B Chem. 259 (2018) 364–371. https://doi.org/10.1016/j.snb.2017.12.083.
[59] L. Zhou, H. Ding, F. Yan, W. Guo, B. Su, Electrochemical detection of Alzheimer’s disease related substances in biofluids by silica nanochannel membrane modified glassy carbon electrodes, Analyst. 143 (2018) 4756–4763.
https://doi.org/10.1039/C8AN01457D.
[60] L. Zhou, H. Hou, H. Wei, L. Yao, L. Sun, P. Yu, B. Su, L. Mao, In Vivo Monitoring of Oxygen in Rat Brain by Carbon Fiber Microelectrode Modified with Antifouling Nanoporous Membrane, Anal. Chem. 91 (2019) 3645–3651.
https://doi.org/10.1021/acs.analchem.8b05658.
[61] F. Montilla, M.A. Cotarelo, E. Morallón, Hybrid sol – gel – conducting polymer synthesised by electrochemical insertion : tailoring the capacitance of polyaniline, J. Mater. Chem. 19 (2009) 305–310. https://doi.org/10.1039/b813323a.
[62] D. Salinas-Torres, F. Montilla, F. Huerta, E. Morallón, All electrochemical synthesis of polyaniline/silica sol–gel materials, Electrochim. Acta. 56 (2011) 3620–3625. https://doi.org/10.1016/j.electacta.2010.11.059.
[63] A. Gamero-Quijano, C. Karman, N. Vilà, G. Herzog, A. Walcarius, Vertically Aligned and Ordered One-Dimensional Mesoscale Polyaniline, Langmuir. 33 (2017) 4224– 4234. https://doi.org/10.1021/acs.langmuir.7b00892.
[64] W. Song, H. Li, H. Liang, W. Qiang, D. Xu, Disposable electrochemical aptasensor array by using in situ DNA hybridization inducing silver nanoparticles aggregate for signal amplification, Anal. Chem. 86 (2014) 2775–2783.
https://doi.org/10.1021/ac500011k.
[65] X. Huo, X. Liu, J. Liu, P. Sukumaran, S. Alwarappan, D.K.Y. Wong, Strategic
24 at Electrochemical Immunosensors, Electroanalysis. 28 (2016) 1730–1749.
https://doi.org/10.1002/elan.201600166.
[66] I.H. Cho, J. Lee, J. Kim, M.S. Kang, J.K. Paik, S. Ku, H.M. Cho, J. Irudayaraj, D.H. Kim, Current technologies of electrochemical immunosensors: Perspective on signal amplification, Sensors. 18 (2018) 1–18. https://doi.org/10.3390/s18010207.
[67] W. Zhang, L. Wang, Y. Yang, P. Gaskin, K.S. Teng, Recent Advances on
Electrochemical Sensors for the Detection of Organic Disinfection Byproducts in Water, ACS Sensors. 4 (2019) 1138–1150.
https://doi.org/10.1021/acssensors.9b00272.
[68] A. Kumar, B. Purohit, P.K. Maurya, L.M. Pandey, P. Chandra, Engineered Nanomaterial Assisted Signal-amplification Strategies for Enhancing Analytical Performance of Electrochemical Biosensors, Electroanalysis. 31 (2019) 1615–1629. https://doi.org/10.1002/elan.201900216.