HAL Id: hal-00023902
https://hal-insu.archives-ouvertes.fr/hal-00023902
Submitted on 15 May 2006
HAL is a multi-disciplinary open access
archive for the deposit and dissemination of sci-entific research documents, whether they are pub-lished or not. The documents may come from teaching and research institutions in France or abroad, or from public or private research centers.
L’archive ouverte pluridisciplinaire HAL, est destinée au dépôt et à la diffusion de documents scientifiques de niveau recherche, publiés ou non, émanant des établissements d’enseignement et de recherche français ou étrangers, des laboratoires publics ou privés.
Role of f02 in fluid saturation of oceanic basalt.
Bruno Scaillet, Michel Pichavant
To cite this version:
Bruno Scaillet, Michel Pichavant. Role of f02 in fluid saturation of oceanic basalt.. Nature, Nature Publishing Group, 2004, 430, pp.6999. �10.1038/nature02814�. �hal-00023902�
Earth science: Role of fO
2on fluid saturation in oceanic basalt
[Brief Communications Arising] Scaillet, Bruno; Pichavant, Michel
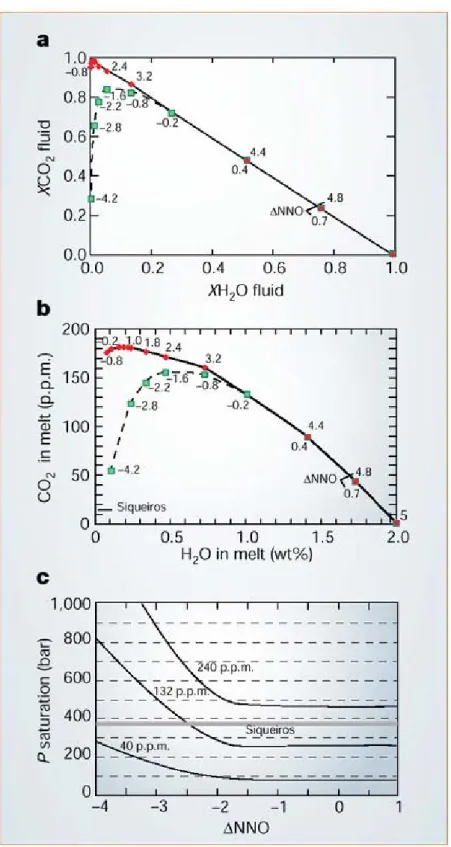
Assessing the conditions under which magmas become fluid-saturated has important bearings on the geochemical modelling of magmas because volatile exsolution may profoundly alter the behaviour of certain trace elements that are strongly partitioned in the coexisting fluid 1. Saal et al.2 report primitive melt inclusions from dredged oceanic basalts of the Siqueiros transform fault, from which they derive volatile abundances of the depleted mantle, based on the demonstration that magmas are not fluid-saturated at their eruption depth and so preserve the mantle signature in terms of their volatile contents. However, in their analysis, Saal et al.2 consider only fluid-melt equilibria, and do not take into account the homogeneous equilibria between fluid species, which, as we show here, may lead to a significant underestimation of the pressure depth of fluid saturation.
For any basalt melt that is at fixed temperature and pressure in fluid-saturated conditions with known H2O and CO2 concentrations, the corresponding volatile fugacities, fH2O and fCO2,
can be calculated 3. The phase rule states that this in turn fixes the fugacities of all other C-O-H fluid species, including fO2 (ref. 4). Figure 1a shows the covariation of the mole fraction of
H2O and CO2 (XH2O and XCO2) in a C-O-H fluid calculated for various fO2 at 1,200 °C and
400 bar (fO2 expressed in log units relative to the solid buffer Ni-NiO, referred to here as
NNO). It can be seen that at a very low mole fraction of H2O (XH2O < 0.05), reduced fluids
are poorer in CO2 than oxidized ones: for instance, at ΔNNO = -2 the mole fraction of CO2 is
0.8, whereas at ΔNNO = -0.8, it is 0.95. This is due to the progressive reduction of CO2 into
CO, which becomes significant at fO2 below ΔNNO = -1 (ref. 4).
Figure 1b shows the H2O and CO2 concentrations of basalt melts that coexist with fluids
shown in Fig. 1a. Under oxidizing conditions (fO2 > ΔNNO = -1), the overall shape of the
curve resembles the pattern of the curve when it is calculated by considering only fluid-melt equilibria 2. By contrast, for fO2 < ΔNNO = -1, the isobaric curve displays an asymmetric
bell-shaped pattern characterized by a strong lowering of the melt CO2 content at low H2O.
As already stated, this is the result of the reduction of CO2 to CO at low fO2, CO being an
insoluble species in silicate melts at low pressures 5. The two curves merge at melt H2O
contents higher than 1 wt%, which shows that, for basalt melts with a higher meltwater content, the calculation of pressure for fluid saturation in the C-O-H system does not require an accurate knowledge of their redox state - unlike H2O-poor basalts, such as oceanic basalts
2.
The fO2 of primitive melt inclusions at Siqueiros is at present not well constrained but is
estimated to be around ΔNNO = -2 (ref. 2), which would fall at the upper end of the range of
fO2 estimated for mid-ocean-ridge basalt 6 (MORB). However, given the general inverse
correlation between fO2 and MgO of MORB documented worldwide 6, the Siqueiros magmas
would be expected near the lower end of the range (that is, ΔNNO = -3.5; ref. 6). The CO2
contents of Siqueiros melt inclusions average at 132 ± 34 p.p.m. but range from 43 p.p.m. up to 243 p.p.m. (ref. 2).
Figure 1c shows the evolution of the pressure of fluid saturation with fO2 of basalt melts
having 40, 132 and 240 p.p.m. CO2 and 0.1 wt% H2O. It can be seen that, except for the
fO2 < ΔNNO = -2.5. Considering the uncertainties associated with the determination of
dissolved CO2 in MORB glasses (± 15 p.p.m.) and with the redox state of Siqueiros magmas,
we contend that the condition of fluid saturation before eruption cannot be disregarded for at least the most CO2-rich Siqueiros melt inclusions.
Figure 1b shows the H2O and CO2 concentrations of basalt melts that coexist with fluids
shown in Fig. 1a. Under oxidizing conditions (fO2 > ΔNNO = -1), the overall shape of the
curve resembles the pattern of the curve when it is calculated by considering only fluid-melt equilibria 2. By contrast, for fO2 < ΔNNO = -1, the isobaric curve displays an asymmetric
bell-shaped pattern characterized by a strong lowering of the melt CO2 content at low H2O.
As already stated, this is the result of the reduction of CO2 to CO at low fO2, CO being an
insoluble species in silicate melts at low pressures 5. The two curves merge at melt H2O
contents higher than 1 wt%, which shows that, for basalt melts with a higher meltwater content, the calculation of pressure for fluid saturation in the C-O-H system does not require an accurate knowledge of their redox state - unlike H2O-poor basalts, such as oceanic basalts
2.
The fO2 of primitive melt inclusions at Siqueiros is at present not well constrained but is
estimated to be around ΔNNO = -2 (ref. 2), which would fall at the upper end of the range of
fO2 estimated for mid-ocean-ridge basalt 6 (MORB). However, given the general inverse
correlation between fO2 and MgO of MORB documented worldwide 6, the Siqueiros magmas
would be expected near the lower end of the range (that is, ΔNNO = -3.5; ref. 6). The CO2
contents of Siqueiros melt inclusions average at 132 ± 34 p.p.m. but range from 43 p.p.m. up to 243 p.p.m. (ref. 2).
Figure 1c shows the evolution of the pressure of fluid saturation with fO2 of basalt melts
having 40, 132 and 240 p.p.m. CO2 and 0.1 wt% H2O. It can be seen that, except for the
lowest CO2 contents, most melts would be fluid-saturated at their collection pressure for an
fO2 < ΔNNO = -2.5. Considering the uncertainties associated with the determination of
dissolved CO2 in MORB glasses (± 15 p.p.m.) and with the redox state of Siqueiros magmas,
we contend that the condition of fluid saturation before eruption cannot be disregarded for at least the most CO2-rich Siqueiros melt inclusions.
We note that this condition is in agreement with earlier findings showing that the redox state of oceanic basalts is compatible with mantle melting under fluid-present or graphite-saturated conditions 7,8. Therefore, although the variable CO2 content of quenched oceanic basaltic
glasses results from syneruptive degassing 3, part of this variability may also reflect regional-to-local variations in fO2. In general, a quantitative modelling of volatiles' behaviour in
Figure 1 Effect of fO2 on fluid speciation and fluid saturation in basalts. a, Covariation of XH2O and XCO2 (where Xi is the
mole fraction of species i) in a C-O-H fluid calculated for various values of fO2 (numbers along each curve). The calculations
were done by fixing fH2 (either 0.01 bar or 1 bar, corresponding to red and green symbols, respectively) and fH2O, which
allows us to calculate fCO2 in the C-O-H system 4. Once fH2 and fH2O are fixed, fO2 can be calculated through the
equilibrium H2 + 0.5 O2 = H2O. T, 1,200 °C; P, 400 bar. b, H2O-CO2 solubility diagram for a basalt at 1,200 °C and 400 bar
and equilibrated with fluid compositions shown in a. For any given fH2O and fCO2 set of values, the corresponding H2O and
CO2 contents of the melt are computed according to ref. 3. The fO2 is shown along each line in log units calculated relative to
the solid buffer Ni-NiO. The Siqueiros bar shows the range of H2O content of Siqueiros melt determined by Saal et al.2. c,
Evolution of the pressure of fluid saturation with fO2 of a basalt melt having 40, 132 and 240 p.p.m. CO2 and 0.1 wt% H2O,
which are minimum, average and maximum CO2 contents, respectively, of the Siqueiros melt inclusions 2. At an fO2 below
ΔNNO = -1, the pressure of saturation in fluid rises because of the continuous increase in CO of the coexisting gas phase. Grey horizontal line corresponds to the average collection pressure of Siqueiros basalts.