FTL COPY, DON'T REMOVE
33412, MIT
02139
MASSACHUSETTS INSTITUTE OF TECHNOLOGY
CONCEPT STUDIES FOR FUTURE INTRACITY AIR TRANSPORTATION SYSTEMS
Department of AeronhUtics and Astronautics Flight Transportation Laboratory
December, 1970
FTL Report R-70-3.
INDUSTRIAL LIAISON PROGRAM
DISTRIBUTED FOR USE BY
MEMBER COMPANIES ONLY
CONCEPT STUDIES FOR FUTURE INTRACITY AIR TRANSPORTATION SYSTEMS
Department of Aeronautics and Astronautics Flight Transportation Laboratory
December, 1970 FTL Report R-70-,-:
Prepared for the National Aeronautics and Space Administration under Contract No. 22-009-580
in Support of the Joint DOT/NASA Civil Aviation Policy.
-r
ii
I,
PREFACE
This study was performed for the Joint DOT/NASA Civil Aviation Research and Development study during the period 1 August - 30 November, 1970. Its purpose was to review the future role for air transportation services in the short haul intra-urban area (less than 50 miles) over the planning horizon from 1970 to 1995. It was to be a "concepts" study to see what form new systems might take, and consequently identify promising areas for research and development work.
TABLE OF CONTENTS
Section
SECTION
PREFACE . . . . . . . . . . . . . . . . . . . . 1 SUMMARY AND RECOMMENDATIONS. . . . . . . . . A. Summary . . . . . . . . . . . . . . . . . . . B. Recommendations and Conclusions. . . . . . . . C. A Conceptual Program for Urban Air Systems
Development . . . . . . . . . . . . . . . . . 2 URBAN TRANSPORTATION AND ITS RELATIONSHIP
TO URBAN PATTERNS . ... . . . . . . . . . . . . . 3 MARKETING FACTORS FOR URBAN AIR
TRANSPORTA-TION. . . . . . . . . . . . . . . . . . . . . . . . . . 1 1 A. Identification Of Urban Markets . . . . . . . . .
B. Modal Split Model . . . . . . . . . . . . . . . C. Conclusions. . . . . . . . . . . . . . . . . . 4 CONCEPTS FOR URBAN AIR TRANSPORTATION
SYSTEMS. . . . . . . . . . . . . . . . . . . . . . A. Metrobus Concepts . . . . . . . . . . . . . . B. Metrotaxi Concepts . . . . . . . . . . . . . . C. Description of Urban Air System Companies . . .
1. Vehicles . . . . . . . . . . . . . . . . . 2. Ground Operations . . . . . . . . . . . . . 3. Metroports . . . . . . . . . . . . . . . . 4. Air Traffic Control . . . . . . . . . . . . 5 PROBLEM AREAS FOR URBAN AIR TRANSPORTATION.
A. Community Acceptance. . . . . . . . . . . . . 1. Accessibility Factor . . . . . . . . . . . . 2. Airspace Factors . . . . . . . . . . . . . 3. Noise Factors. . . . . . . . . . . . . . . 4. Ground Space Factors . . . . . . . . . . . 5. The Site Selection Process . . . . . . . . . B. The Relationship of Urban Air Systems to
Other Air Transportation. . . . . . . . . . . .
Page . . 1 3 5 7 . .11 13 22 29 29 30 32 32 35 35 46 49 49 A9 50 51 52 52 54
TABLE OF CONTENTS (Continued)
Section Page
6 AREAS FOR RESEARCH AND DEVELOPMENT FOR
URBAN AIR SYSTEMS . . . . . . . . . . . . . . . . . . 57
A. Quiet V/STOL Vehicles . . . . . . . . . . . . . . 57
B. Community Noise Criteria . . . . . . . . . . . . . 57
C. V/STOL Take Off and Landing Operations . . . . . . 58
D. V/STOL Air Traffic Control Systems . . . . . . . . 58
E. Automated Passenger Processing System . . . . . . 59
F. Market Research . . . . . . . . . . . . . . . . . 59 REFERENCES... ... . . . . . . . .. - 61 BIBLIOGRAPHY . . . . . . . . . . . . . . . . . . .. .. . . .. . 63 APPENDIX A. . . . . . . . . . . . . . . . . . .. . . -. - - -. . A-1 APPENDIX B. . . . . . . . . . . . . . . . . . . . . -. - - - -. . B-1 APPENDIX C. . . . . . . . . . . . . . . . . . . . . .. - -. . . . C-1
LIST OF ILLUSTRATIONS
Figure No.
Modal Split Model . . . . . . . . . . . . . . . . . AIRURBAN MARKET SHARE (in Competition with Auto) AIRURBAN MARKET SHARE (in Competition with Auto) and NRT-40 mph, NRT-60 mph . . . . . . . . . . . AIRURBAN MARKET SHARE (in Competition with Auto) (NON-RESIDENT CASE) (in Competition with NRT- 40). AIRURBAN MARKET SHARE (in Competition with Auto) AIRURBAN MARKET SHARE (in Competition with Auto) AIRURBAN MARKET SHARE (in Competition with Auto) Intra-Urban Air System. . . . . . . . . . . . . . . Block Times vs Stage Length . . . . . . . . . . . . Direct Operating Cost vs Stage Length . . . . . . . . Urban Aircraft Interior Design . . . . . . . . . . . Side View - Urban Aircraft Interior Design . . . . . . A Typical City Center VTOL Metroport. . . . . . . . A Suburban Ground Level Metroport With Underground Parking. . . . . . . . . . . . . . . . . . . . . .
Pad and Terminal Arrangement . . . . . . . .. -. The Passenger Processing Flow Diagram . . . . . . The Automated Passenger Check-In System. . . .. . VTOL vs STOL Site Acreage Requirements . . . . ..
Present Helicopter Fares vs Distance - 1970 . . . . . Trip Time vs Trip Distance . . . . . . . . . . . . . Megalopolitan Trip Diagram. . . . . . . . . . . . . Variation of Average Access Distance With Number of Ports. . . . . . . . . . . . . . . . . . . . . . Access Time vs Number Of Access Points . . . . . . Access Time and Distance to Nearest Station . . . . . Optimal Number of Stations in Market Area. . . . . . Optimal Sum of Access and Waiting Times for Common Carrier System . . . . . . . . . . . . . . . . . . 1 2 3 4 5 6 7 8 9 10 11a 11b 12 13 14 15 16 17 A-1 A-2 B-1 B-2 B-3 B-4 B-5 B-6 Page . . . 15 . . . 20 . . . 23 . . . 24 . . . 25 . . . 26 . . . 27 . . . 31 . . . 36 . . . 37 . . . 38 . . . 38 . . . 39 . . . 40 - - - 43 . . - 44 - . . 45 - - . 53 .A-14 A-15 . . . B-2 . . . B-4 . . . B-6 B-7 B-17 . . . B-18
LIST OF ILLUSTRATIONS (Continued)
Figure Page
C-1 1975 Expressway System in the Boston Region . . . . . . . C-2 C-2 Major Elements of the Massachusetts Bay Transportation
Authority Master Plan . . . . . . . . . . . . . . . . . . C-4 C-3 Railroad Network in the Boston Region . . . . . . . . . . C-6 C-4 Regional Boston Area: Preliminary Distribution of
System Vertiports. . . . . . . . . . . . . . . . . . . . C-14
LIST OF TABLES
Table No. Page
1 Accuracy of Fit for the Modal Split Model . . . . . . . . . 14 2 Standard Case Assumptions for Modal Split Model. . . . . . 16 3 Summary of Parametric Variation. . . . . . . . . . . . . 17 4 AIRURBAN MARKET SHARE (in Competition with Auto) . . . 19 A-1 Los Angeles Airways, Financial and Traffic Statistics. . . . A-2 A-2 Chicago Helicopter Airways, Financial and Traffic Statistics. A-5 A-3 New York Airways, Financial and Traffic Statistics . . . . . A-7 A-4 San Francisco and Oakland Helicopter Airlines . . . . . . . A-10 A-5 Total Helicopter Carriers . . . . . . . . . . . . . . . . A-11 C-1 Internal Person Trips by Purpose . . . . . . . . . . . . . C-8 C-2 List of Metroports for Boston Region . . . . . . . . . . . C-15 C-3 Analysis of Travel Demand for the Boston Regional
A rea . . . . . . . . . . . . . . . . . . . . . . . . . . C -17 C-4 Projection of 1980 Travel Demand for the Boston
SECTION 1
SUMMARY AND RECOMMENDATIONS
A. Summary
This report is concerned with describing the possible application of future air transportation systems within urban areas of the United States. The planning horizon extends to 1995 and the report focuses on the period 1980-85 for introduc-tion of urban air systems. The general conclusion of the study is that urban air systems will be technically and operationally feasible, but that economic viability remains inextricably linked to future governmental policies on urban development, and consequently policies for development of urban transportation. In view of the uncertainties in these policies, it becomes difficult to be definitive about the forms of future urban air systems and the research and development needs to develop these systems.
The marketing section of the report identifies the kinds of urban travel markets, and attempts to apply a modal split model to show the share of the travel
market which an air system would capture in competition with automobile or new forms of rapid transit. The results indicated the need for a high frequency of air service, and low values of access and egress times and costs, and reasonably competitive fares. The air system did not gain any appreciable share of the travel until trip distances were over 20 miles. Since most of the trips in an urban area
are under this distance, the overall penetration of the urban travel market was less than one per cent. Application of the modal split model to data for a 1980 case study of the Boston area indicated that the loads were much too low to justify a large scale urban system. Although the modal split model results can be
questioned and more work on such models is indicated, the general nature of these marketing conclusions is unlikely to change.
There were two concepts for urban air systems described in this study: a "metrobus" concept which used 40-80 passenger vehicles as a public carrier in the urban area and a "metrotaxi" concept which used 4-5 passenger VTOL air taxis as a private-for-hire carrier. The components of these systems (vehicles, metroports, air traffic control system) were described as they might exist for the 1980-85 period. Appendix B describes an analysis for any public urban transporta-tion system which demonstrates that a large number of stopping points are required
of a large scale urban system in order to reduce the access and egress times and therefore the total trip time. Its conclusion is that a public urban system can never compete with a private system like the automobile for the total mass market, but must attract a much reduced travel volume consisting of trips between local areas surrounding its stopping points. This result led to access plus egress times for the air urban system on the order of 30 minutes by automobile or taxi which greatly reduced its speed advantage particularly for the shorter trips.
The dominant problem in implementing an urban air system is community acceptance of the metroport, and the prime factor would be the noise of the air vehicles. A peak noise level of 85 EPndb at 500 feet is suggested as acceptable based on experience with 70 heliports in the Boston area. However, there is a neec for establishing a community noise criteria based on factors other than peak noise such as frequency of service, background noise levels, number of listeners, etc. and using it to establish noise categories for metroport operation. This would give the community some assurance that the volume of noise pollution from the site can be controlled.
Planning for a future urban air system is linked to planning for both future airport development and future intercity V /STOL systems. Land side congestion problems at major airports can be relieved through the provision of remote check in facilities which have an air link to the airport. The construction of new airports at sites somewhat removed from urban areas may become reasonable if urban air service exists. Similar factors affect the problems of passengers transferring from airports to metroports for intercity V/STOL service. The metroports are a
ground facility common to the metrobus concept for urban air systems and intercity V/STOL, and as such link the development of these two systems.
B. Recommendations and Conclusions
1. The urban transportation system is a tool in the hands of urban planners for determining urban form. As such, public policies will determine the roles of future public systems, and provide financing and operational subsidies.
2. It is difficult to envisage any large scale adoption of an urban public transportation system unless it has:
a. thousands of stoppings points to provide walking access and egress.
b. frequent and reliable service from those stopping points. c. faster, or cheaper service than private auto.
3. An urban air system using quiet helicopter or tilt rotor vehicles, advanced vehicle stabilization and control systems, and a new ATC system is techni-cally and operationally feasible. It would provide the urban planner with a new tool suitable for trips from 15 to 50 miles having the flexibility of being easily moved or modified as urban development occurs.
4. While the large scale urban public system would seem to be a new rail or subway system supported by bus routes, the urban air system seems to have some advantages in the following particular applications:
a. Collection, distribution (and transfer) of intercity passengers to and from airports and metroports.
b. Public transportation for new towns or satellite developments outside a large city.
c. Public transportation on a limited scale for existing low density, urban "sprawl" areas (such as Los Angeles).
d. Public transportation on a limited scale over certain geographic conditions (water, mountains).
5. In its applications, the urban air system should be coordinated, with the development of urban and intercity transportation systems, such as express-ways, rail and subway transit, bus transit, intercity V /STOL air systems.
The development of urban transportation centers at a few points within our present metropolitan areas is an attractive method of causing this coordina-tion.
6. If the development of urban air systems becomes a public policy, there is a need for public funds for the construction of prototype operating systems to demonstrate technical and operational feasibility, and to provide a means for carrying out demonstration projects pointed towards obtaining marketing
and operating cost information for the various applications which might be envisaged. The mechanism by which such totally new transportation systems are developed and tested for our society by an alliance of private interests, such as manufacturers, operators, investors, etc. and public interests such as regional planning authorities, local zoning boards, local and federal governments, does not exist at present.
7. The successful development of urban air systems requires effort in the following R&D areas:
a, Research and development of quiet rotor vehicles b. Development of auto-stabilized VTOL vehicles
c . Development of new automated ATC systems
C. A Conceptual Program for Urban Air System Development
In the course of this study the following concept evolved as an attractive development program as a means of initiating urban air services. Its emphasis is on coordination of new federal programs for mass transit and airport development, and links the initiation of new urban air services to the problems of airport access.
The central element of the program is the construction of suburban transpor-tation centers linking the highway, rail transit, and air networks together at points on the periphery of urban areas 15 miles or more from the nation's major airports.
The locations would be chosen at the conjunction of major expressways, and present or future rail or transit lines. The center would consist of a large parking garage built over rail or transit yards, or an expressway interchange. Local bus services
and taxis would interchange with subway or rail transit at ground levels while on the top level V/STOL services would be provided by VTOL or STOL systems for
intercity and urban travelers.
The center would provide a focus for public transportation systems in the suburban areas. Collection of passengers from the surrounding region could be performed by local bus services, local taxis, private auto, or by air using metro-taxi service. Commuters could get express transit service from this point to the
central business district.
Airline travellers could be checked in remotely by agents of the various airlines and transferred by fast air service to the present airport or any new airport which could be constructed at a rather remote location serving more than one metropolitan area.
Future short haul intercity travelers could be checked in and get V/STOL service directly from this location to similar points in other cities.
If there are to be public air transportation links to "new town" develop-ments as satellites on the periphery of our major cities, the urban air service would be provided from the suburban transportation centers.
The initial market for urban air service would be airport access for the airline traveler. From previous efforts the following points seem to be crucial in making this kind of service a success:
1. Complete remote check-in facilities must be available for passengers. The service should be a good substitute for what is available at the airport. Individual airlines should be represented by their own ground personnel at the site when their traffic volumes warrant it.
2. Facilities for well wishers and greeters should be provided at the surburban terminal.
3. The transfer time to the airport should be less than the driving time. This indicates an air link operated by the urban air carrier for the airlines.
4. At the airport a central urban air terminal should be used such that all airlines are equally treated. Good on-airport transfer systems for both passengers and bags should exist for every airline.
5. Parking spaces should be available at the remote check in with cheaper long term rates than at the airport.
6. Joint fares should be created, and all airlines should be able to directly book space for their passengers on the urban air system. The passenger should pay an extra fee for the service somewhat comparable to outof -pocket expenses for going directly to the airport.
This course of action suggests initial development of urban air services in the airport access markets, and is strongly connected with the airways-airport development program in offering solutions to problems such as airport access, land side congestion, and new airport location at remote sites. It is also connected with future intercity V/STOL development programs, and possible future develop-ments of urban air services into the metrobus and metrotaxi market concepts described in this report.
SECTION 2
URBAN TRANSPORTATION
AND ITS RELATIONSHIP TO URBAN PATTERNS
There is a very strong interrelationship between the form of our cities and their urban transportation systems. Before the advent of the automobile, the city
generally had a dense central core of commercial and industrial activity and a star-shaped development along the radial lines of transportation such as highways or rail lines. Residential areas grew up along these lines, and people relied upon them for travel to and from work. This pattern is still quite visible in the older cities such as Boston, New York, or Philadelphia.
With the advent of private transportation in the form of the automobile, the absolute requirement for a public system as a link between business and home was broken, and residential development began in the areas between the radial trans-portation lines. Newer cities such as Los Angeles grew up during the automobile period into a new form of city described as "urban sprawl". During the past two decades the spectacular growth of suburban population has placed continuous demands for improved urban highway networks which has resulted in the construction of a network of urban expressways in and around the major cities. This construction has allowed the suburban growth to continue. From 1960 to 1968, the suburbs grew in population by 14 percent, while the populations of central core areas of the cities either decreased or remained roughly constant.
The point has been reached where probably most of the urban highway net-work has been constructed since strong local objections have been raised in several cities. The issues raised with regard to further highway construction indicate the need for a total urban planning approach to direct the growth of our cities, and to create a better way of life for the urbanite. The urban transportation system is a major tool for the urban planner in shaping our urban areas, and the question of what new forms of public transportation will look like lies nested in a series of
other questions about urban development.
The development and use of new public systems to balance the present high-way system is a current issue in public policy to be determined by planners at the
local and federal level. Viewed as a public resource, the construction and opera-tion of the new public systems and their services need not be such as to provide the financial viability required for private enterprise systems. The community
benefits in the form of lower noise and pollution levels, reduced roadway conges-tion and highway construcconges-tion costs, rehabilitaconges-tion of certain segments of the city with their increased contribution to local property tax rolls, etc. - all may indicate
spending public funds on the urban transportation system. With such a viewpoint, the fares charged to users of the system becomes one of the planner's tools in en-couraging travel on the system in order to foster certain types of development in the urban area.
The recent passage of the "Railpax" and "Mass Transit 1970" bills portends the adoption by city planners of commuter rail and subway systems in the next dec-ade. The ability to use the leverage of federal funding indicates reasonable assur-ance of local approval for new projects and proposals which offer new alternatives for urban travel, particularly for commutation.
An urban air system using quiet VTOL vehicles is a very flexible tool for the urban planner. It requires substantially less initial investment, takes less time to initiate new service, and can be easily moved as new urban developments occur. It is suitable for low density, sprawl type urban areas since ports can be located throughout the area. It allows the planner to create satellite development areas on the periphery of the major urban area, at distances between 50 and 100 miles from the central core. Multiple satellite developments can be linked and as demands begin to indicate the extension of rail lines to the satellite or new town, the air service can be reduced or discontinued. By creating the possibility for fast travel for urban trips from 15 to 50 miles in length, an urban air system can play a sig-nificant role in creating a new form of urban living.
In those areas of the nation where metropolitan areas are beginning to over-lap and form a megalopolitan area, the introduction of a future V/STOL intercity air system looks reasonably probable. In these areas, a new form of intercity terminal called the metroport will be distributed throughout urban areas, offering the opportunity to use air service for trips between 50 and 250 miles. The possi-bility for concurrent development of urban air services in such areas looks very attractive in providing feeder service to the metroports, and making possible the joint use of metroports by V/STOL and urban air systems.
It is difficult to envisage any kind of public system penetrating the urban travel market against competition from the automobile in the low population density suburban areas. As shown in Appendix B, the need for a large number of access points to make it possible to walk to the system causes a very low volume of pas-sengers per pickup point, and makes the investment and operating costs for the public system very high. There certainly will not be any room for competing public systems. Instead the answer (if any) will lie in the direction of coordination of public systems; for example, subway or rail fast transit lines with park and ride
facilities, and the provision of local bus services to feed the transit stations. If an urban air system is to be provided, it should be planned as part of the total urban system with stops co-located with the rail transit stops and providing services not provided by the rest of the system.
This coordination would seem to be best effected through the construction of suburban transportation centers which would provide the interface between rail, transit, bus, auto, and, hopefully, urban and intercity V /STOL systems.
SECTION 3
MARKETING FACTORS
FOR URBAN AIR TRANSPORTATION
A. Identification of Urban Markets
The kinds of passenger trips undertaken in an urban area can be classified by trip purpose into business, personal, and commuter, and by trip ends into
inter-city or urban. Each of these categories is an identifiable travel market with differing characteristics.
The urban portion of intercity trips deals with access and egress to and from intercity terminals such as airports, V/STOL metroports, high speed train, or intercity bus. For the business traveller, he will be without his private automobile in at least one city away from home, where the local segment of the trip will be from the intercity terminal to local places of business or overnight accommodations. These trips are particularly susceptible to service by an air system since they are attracted by high speed, highly convenient service even if the travel cost is higher. The urban modes competing for these trips are taxis, rentacars, 'limousines, and new modes such as new rapid transit (NRT) and air urban service. The personal intercity traveller is more likely to be met by friends or relatives, and to prefer lower cost, lower speed systems for the away-from-home urban portions of his trip.
Passenger trips within a given urban area can also be divided into business and personal. Business trips are those taken for the purposes of visiting other local places of business; for example, salesman's visits, or a lawyer's or banker's trips. Originally these took place for the most part within the core or central business district of the city. However, the development of suburban industrial parks and shopping centers is now causing these trips to increase in length, and in cases where there are multiple nucleii in the urban "sprawl" or where new satellite communities are being developed, a reasonable volume of urban business trips in the range of 5 to 50 miles can be expected as exchanges occur between these multiple business districts. The private auto will compete strongly with other public modes for these trips.
entertainment, dining or sports, for shopping or medical purposes, or for visiting friends. The private auto will likely be predominant for such trips since the travel group will generally consist of a family of one or more persons sharing its travel cost. As well the trip may have multiple destinations for shopping, visiting, etc.
Commuter trips are trips from place of residence to place of business in the early morning, and vice versa after the close of the business day. While there is a tremendous volume of such trips, the combination of directionality, plus peaking, plus 5 out of 7 days make it difficult for any public system to obtain a good average utilization of its resources. These trips are sensitive to cost since the traveller pays for them out of his own pocket and makes them every working day of his life.
Since place of work and place of residence are the trip ends, the systems which are available to handle these trips strongly influence urban form and urban growth. Places to live are chosen on the basis of the means and cost of getting to work every day. The construction of new housing and apartments, and the prices set upon them for sale or rent are influenced by the time, cost and convenience of commuting. Similarly, the location chosen for new industry, or the retention of old industry at their present down-town sites is affected by the services offered by public commuter systems. The individual traveller balances the price he pays for commutation in decisions with regard to housing and decisions about changing jobs. Longer range commuting would be possible with an urban air system where places of residence
could be 50 or more miles from work. Conversely, the alternative job opportunities for a given residence would be greatly enlarged by the existence of such a system.
But the critical problem as for any public system, lies in the costs of allowing its resources to be fully utilized only 10 hours or so out of every week.
The market opportunities for cargo or freight in an urban area are numerous and can be classified along similar lines as the passenger trips. The bulk of these movements are handled today by local trucking on a door-to-door, minimum
handling basis. The opportunities for using a public system to aid in this distribution process using its off peak resources seems an attractive idea especially if some method of containerization and automation in the handling problems can be intro-duced. For example, air cargo containers could be made up at off-airport collection points for delivery to the airport by urban air vehicles used for commutation at 7-9 a.m. and 4-6 p.m. This would require a "quick-change" interior similar to those used today for certain jet transports.
Mail and express may represent a cargo market for urban air transport particularly in the major metropolitan areas. The desire for simple, prompt
movements between regional postal collection points, and for distribution to a variety of intercity terminals such as airports, metroports, rail terminals, etc.
lowered. The development of a large scale urban air system could provide lower cost services than the experiences to date with helicopter services would indicate.
One of the major problems in planning for new transportation systems is estimating the travelling public's response to alternative forms of new service. No satisfactory answer to these problems exists simply because there is a complete lack of comparable travel data over all modes. If such data had been gathered recurrently over recent years, covering various changes in the levels of service, it might be possible to construct good econometric models of transportation demand.
Here we shall attempt to use one such model - a modal split model based on total trip time and cost and we shall calibrate it on the estimates of short hand intercity travel in the Northeast Corridor in the year 1965 as given by Reference 11. One cannot have much confidence in the results of such a process because of the lack of good data, but the effort is important in indicating the relative importance of access -egress time and costs, and frequency of service on the relative shares that a competitive system might capture in a given short haul passenger travel market.
B. Modal Split Model
The modal split model used here assumes that total trip time, T, and total trip cost, C, as variables which the travelling public will use in determining their choice of mode of travel. The times for access, egress, passenger processing,
and waiting for the next line haul service are included to represent the "convenience" of the system. The passengers image of the comfort, safety, and reliability are
assumed here to be equal for all future modes.
The modal split model gives the functional relationship between the share of traffic attracted to a mode and the total trip time and cost associated with the use
of that mode. The mathematical formulation is given by figure 1.
Using a set of twenty city pairs and 1965 data for market share by mode, the empirical values a and P were determined with the help of conjugate gradient method described in Reference 12. The calibration resulted in the values:
a =-3.1 3 = -2.7
These "elasticities" are fairly high values indicating that the modal shares will be sensitive to changes in both total trip time and total trip cost. The values used are strong determinants of the share that any new air system will be able to achieve.
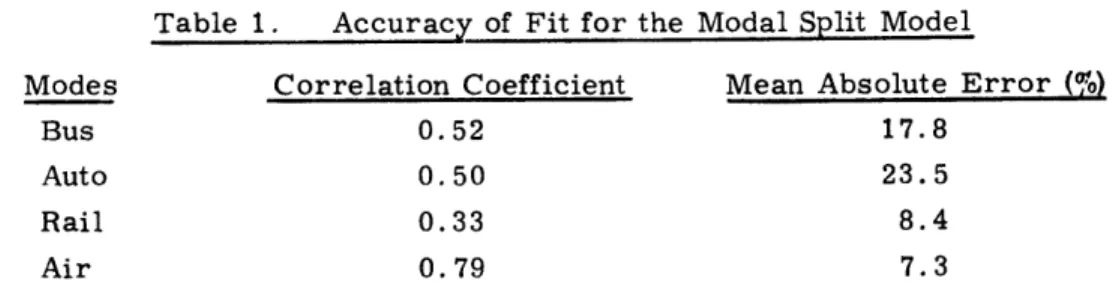
An indication of the accuracy of this calibration is given in Table 1 which presents correlation coefficients and mean absolute error in percent.
Table 1. Accuracy of Fit for the Modal Split Model
Modes Correlation Coefficient Mean Absolute Error (o)
Bus 0.52 17.8
Auto 0.50 23.5
Rail 0.33 8.4
Air 0.79 7.3
The correlation coefficient expresses the degree of correlation between the actual modal share and the share which would be assigned by exercising the model. The mean absolute error expresses the average error which would be expected in estimating the modal share. The results are not such as to inspire any confidence in the model except perhaps for the air mode. It is difficult to express a degree of
confidence in any of the numerous methods for determining modal split or market shares. In the absence of better models, we shall exercise this one to show the hypothetical results it would provide.
Mode Characteristics
The empirical values for the elasticities a and 0 were used to determine the sensitivity of the air mode to variation in its characteristics. Two other competing future modes were considered in the case of intra-urban travel for distances varying from five to fifty miles. The total trip cost and total trip time characteristics of each of the competing modes are tabulated in Table 2. In each case the relationship between total trip cost, total trip time and distance was taken to be linear. In Table 2 the total trip time is given in minutes and the total trip cost in dollars.
Air
Total trip time is a function of five parameters. The passenger processing time (T
p)
is fixed at 2 minutes. The single parameter, access (T a) plus egress (T )was retained as a variable. In our analysis, it varies from 15 to 60 minutes in 15 minute intervals. Tw represents the time to wait for next service. As shown in Figure 1, Tw depends on daily frequency. We vary the one-way frequency in this analysis from 10 to 60 flights per day. Tw, therefore, varies from 48 minutes for 10 flights/day to 8 minutes for 60 flights/day. The block time (Tb) is a linear function with time. Four different aircraft cruising speeds are considered varying from 140 to 260 miles per hour in steps of 40 miles. For a fifty mile trip the variation in block time is from 22 minutes to 13 minutes for the range in cruising speeds.
The total trip cost (TTC) consists of trip fare and cost of access and egress. Three cases of trip fares are considered here. Initially, for all three cases the cost of access and egress is taken to be one dollar. Then the cost of access and
MS
umn
WHERE
MSijm
Cijm
Tijm
T
Ta'
e,
T
Tw
Tb
TD
f..
fijm
a
@
a
m-1 ,m
=
SHARE OF TRAFFIC BETWEEN i AND
j
TRAVEL
=
TOTAL TRIP COST
=ACCESS + EGRESS +
1
=TOTAL TRIP TIME
-
Ta
+
Tp + Tw + Tb + Te
=
TIME FOR ACCESS, EGRESS
=
TIME TO PROCESS PASSENGER AT STATION
-
TIME TO WAIT FOR NEXT SERVICE
=TD/ 2
=
BLOCK TIME ON MODE m
=
DAILY HOURS OF OPERATION FOR MODE m
=DAILY FREQUENCY OF SERVICE FOR MODE m
=
TRIP COST ELASTICITY
=TRIP TIME ELASTICITY
JNG ON MODE m
RIP FARE
Figure 1 Modal split model.
- T.
ijm
- T.
Table 2
Standard Case Assumptions for Modal Split Model
MODE
AIR - 180 mph
AUTO - 60 mph
NEW RAPID TRANSIT (NRT) 40 mph Ta Tp Tw Tb 15 2 4 50 1+ 60D 180 (Note 1) 0 0 0 10+-qD 5 0 10 40 D
Te TOTAL TRIP TIME - mins
42.6 + 3
15 + D
(Note 2)
20 + 1. 5D
TOTAL TRIP COST - dollars
5 + 0.10D
1 + 0.06D
0.2 + 0.04D
1. Note: For air, the block distances were reduced 15% assuming the aircraft can proceed along more direct routes than the ground modes.
egress is varied with duration of access and egress. See Table 3. TTC1 then is 5 dollars and 10 cents per mile. This fare is very close to the Los Angeles Airways fare structure. TTC2 is 3 dollars and 5 cents per mile. TTC3 is 5 dollars and 20 cents per mile, representing upper and lower bounds on reasonable air fare
structures for V /STOL air systems.
Auto
The total trip time is broken into a fixed portion of 15 minutes per trip and a variable portion at 60 or 40 miles per hour. In the fixed part 5 minutes is allowed for access, egress or parking at either end of the trip. The shorter the trip, the lower the average speed. For example a 15 mile trip would take 30 minutes and average 30 miles per hour. A 45 mile trip would take 60 minutes and average 45 miles per hour.
In the case of auto the total trip cost consists of one dollar for access and egress (parking) and 6 cents per mile. This represents the out of pocket cost.
New Rapid Transit (NRT)
In this case the access and egress time is taken to be 5 minutes each. Tw' time to wait for next service, is taken to be constant at 10 minutes. The cruising speed takes on two values; 40 miles per hour and 60 miles per hour.
The total trip cost, in both cases, is taken at 20 cents per trip and 4 cents per mile. This cost represents present day operations which are very heavily
subsidized.
Table 3
Summary of Parametric Variation
1. Air System Forces TTC1 = 5 + 0. 10D
TTC2 = 3 + 0.05D dollars
TTC3 = 5 + 0.20D
2. Air Access and Egress, Ta +Te = 15, 30, 45, 60 minutes C +C = 1, 2, 3, 4 dollars 3. Air System Daily Frequency, N = 10, 20, 30, 40, 50, 60 flights /day 4. Air System Cruise Speed, V = 140, 180, 220, 260 mph
5. New Rapid Transit Speed, V = 40, 60 mph
Sensitivity Analysis
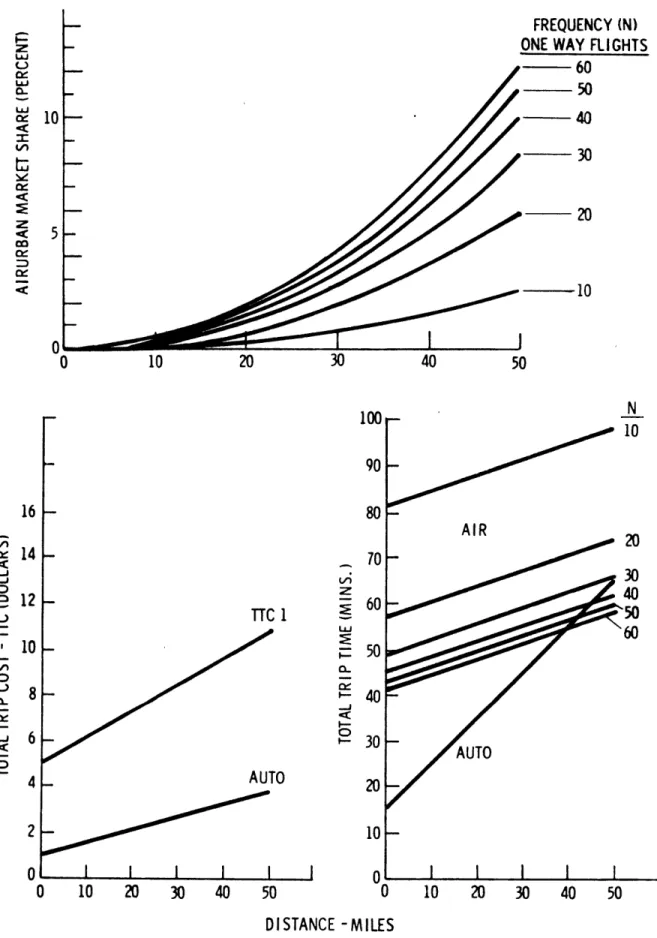
Table 3 gives the variation in various system parameters used in our study. Figures 2 through 7 and Table 4 show typical results of the sensitivity analysis. Before discussing the results we would like to introduce a new parameter related to the air mode, called average penetration . The average market penetration ? with within 50 miles radius can be computed as follows
kMS)()
where i = 10, 20, 30, 40, 50 miles MS = Market Share
The basic assumption in computing p is that the distribution of trip distances in a given urban area is inversely proportional to the square of the travel distance. This is a common assumption of "gravity" demand models. The average percentage penetration is a measure of the percentage of total market trips attracted to the air mode within an urban area. For example, suppose the total market demand in a given area was one million person trips per day, then 0. 1% air penetration would
indicate that 1000 person trips per day would be made by air. Due to the speed advantage the air mode attracts higher percentage of the market at larger stage lengths compared to shorter stage lengths, whereas, there are a much greater number of trips at the shorter stage lengths compared to the longer stage lengths.
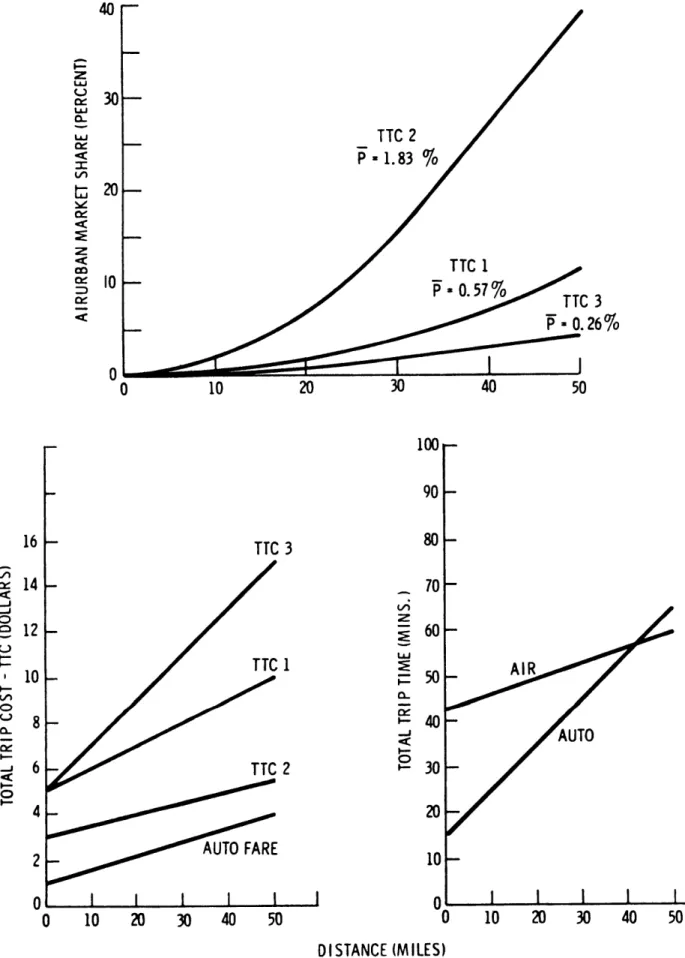
Unless stated otherwise, the results plotted in Figures 2 through 7 repre-sent the standard case for the air mode:
Cruise Speed = 180 mph Trip frequency = 50 flights/day
Access and Egress Time Ta + T e= 30 minutes
Fare = TTC1 = 5 + 0. 10D dollars
In Figure 2 the air mode is in competition with the auto. The upper diagram shows the sensitivity of the market share to total trip cost. The lower diagrams show the relationship of total cost, total trip time and distance. As mentioned earlier, TTC1 represents typical present day fares exemplified by LAA. TTC2 is based on a more advanced system assuming improved management concepts with
reduced indirect operation costs or the presence of subsidy. TTC3, higher costs than the previous two, is added for completeness. If we reduce the variable part of the auto speed to 40 mph, the market share for the air mode increases. For the
standard case for the air mode, Table 4 shows that the average penetration p would increase from 0.57% to 1.04% when the auto cruise speed is reduced from 60 to 40 mph.
Table 4
AIRURBAN MARKET SHARE (%) In Competition with Auto
AUTO SPEEDt 60 MPH 40 MPH 0.18 0.44 1.60 3.81 7.13 11.36 0.25 0.77 3.41 8.81 16.71 26.01 VARIATION
tDollars
0.64 1.51 4.89 10.42 17.40 24.92 IN ACCESS AND ( I ) (435) 30 45 0.11 0.03 0.29 0.08 1.12 0.35 2.80 0.97 5.46 2.04 '9.02 3.65 0. 57% 1.04% 1.56% 0.37% 0. 12% 0.05% AIRURBAN CHARACTERISTICS Speed = 180 MPH T + T = 30 Mins. a e Frequency = 50 Flights/Day ± Auto Cost = 1 + 0.06 D * Auto Speed = 60 MPH DISTANCE 5 10 20 30 40 50 EGRESS(4
60)
0.01 0.03 0.14 0.40 0.89 1.67TTC 2
P- 1.83
TTC 1
- 0.5710
20
100
90
80
0
10
20
30
40
50
20
10
-0
AUTO
10
20
30
40
50
DISTANCE (MILES)
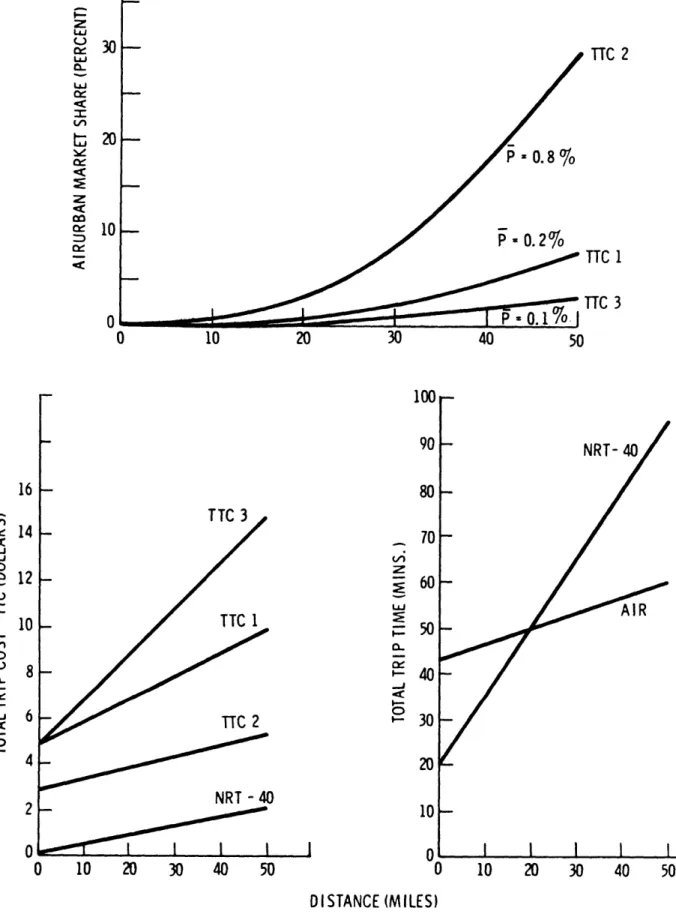
In Figure 3 the air mode is in competition with two other modes; auto and new rapid transit (NRT). The new rapid transit is introduced as to separate cases. One operates at a higher speed than the other. Both rapid transit systems operate at the same low fare level, 20 cents plus 4 cents per mile. This fare level is exemplified by our present day operations. Due to the much lower fare level of the
rapid transit, the air market share drops significantly. The average penetration for the standard case drops from 1. 83% to 0. 10% with the 40 mph rapid transit and to 0. 06% with the 60 mph rapid transit.
Figure 4 shows the results of air mode competing with rapid transit (40mph) only. This case represents the non-resident passenger. The auto has been left out of the competing modes, since the non-resident passenger does not have the avail-ability of his personal car. In the non-resident case, air market share curves are shown for all three fare levels. Figure 4 resembles Figure 1 except that the
competing mode is rapid transit instead of auto. The average penetration is lower for non-resident case due, in part, to the lower transit fare relative to the auto.
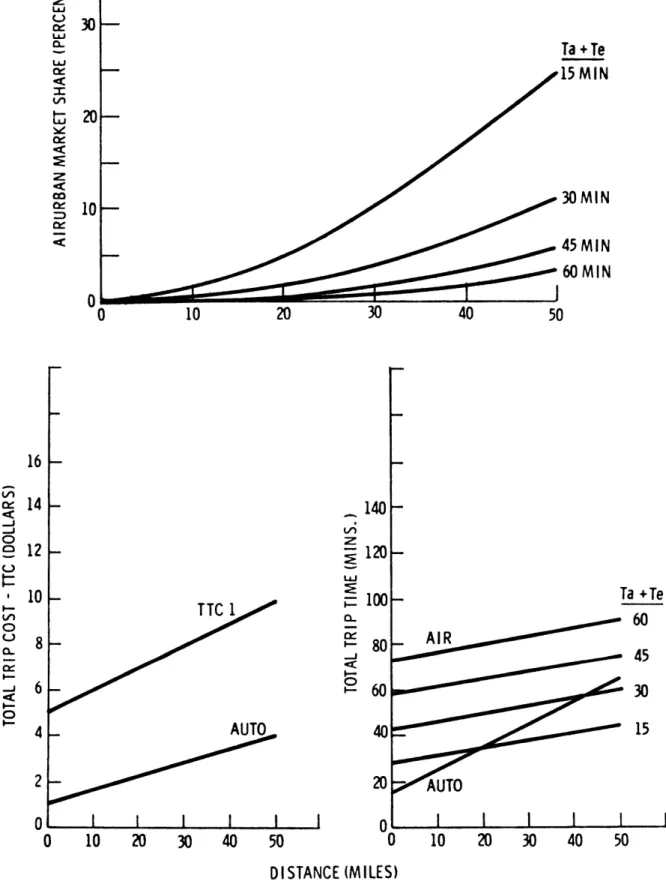
Figure 5 shows the results of access and egress time variation. Four levels of access plus egress time are selected varying from 15 minutes to 60 minutes. Due to the short hauls involved, a reduction of 15 minutes in access and egress from 60 minutes to 45 minutes influences the air market share less than the same amount of reduction from 30 minutes to 15 minutes. As shown in Appendix B Figure B3, it would be impossible to reduce access and egress times below 30 minutes without requiring hundreds of terminals, if access is through walking. An average access time of 15 minutes for a given terminal implies, that there would be some passengers who would access the terminal in less than 15 minutes and some who would require more time than the average 15 minutes. The market share will therefore depend on the community density around that terminal.
The results shown in Figure 5 are for an access and egress cost of one dollar for all access and egress times ranging from 15 to 60 minutes. In the parametric variation, we changed the cost of access and egress to vary from one to four dollars corresponding to access plus egress time of 15 to 60 minutes. Table 4 shows the changes in the market shares for the air mode. The average penetration ~ varies from 1. 56% (access and egress cost of one dollar and duration of 15 mins.) to 0. 05% (four dollars and 60 minutes).
Figure 6 depicts the results of variation in aircraft speed. In the four cases selected the speed was varied from 140 miles per hour to 260 miles per hour. As expected the higher aircraft speeds do not influence the market share significantly at distances less than 20 miles. At distances less than 20 miles the fixed part of the total trip time is predominant relative to the total trip time.
The effect of frequency variation is shown in Figure 7. The frequency was varied from 10 to 60 one-way flights per day. As shown in Figure 1, the daily frequency effects the total trip time. The term Tw represents the average waiting time for a random arrival of passengers before passengers can make a departure.
From previous studies (Reference 3) performed in the Flight Transportation Labora-tory at MIT, it has been found that Tw is well approximated by T/2n where T is the total time during the day in which the mode is in operation and n is the daily frequency. In the case of the air mode it is assumed that flights are scheduled from 7:00 a. m. to 11:00 p. m. daily, giving T the value of 16 and Tw = 480/n minutes. If the daily frequency is varied from 10 to 60 flights per day, T varies from a high of 48 minutes (n= 10) to a low of 8 minutes (n= 60).
As seen in Figure 7, the effect of increasing daily frequency is to reduce Tw which in turn reduced the total trip mean and increases the market share. The effect of further increasing frequency, beyond the range shown, would produce diminishing returns, since the waiting time (T w) becomes small relative to the total trip time.
Summary of Model Results
The model gives a hypothetical set of results which would lead to the following general conclusions:
1. Overall penetration of an urban air system in competition with automobile or newer forms of subsidized rapid transit will be very small fraction of the total trips in the urban area, generally under less than 1%. This is because the time advantages of the air system appear at ranges over 15 miles where there is a small volume of urban trips.
2. Penetration values are very sensitive to access and egress times and the frequency of the air service. Changing access times or waiting times from 15 minutes of 7. 5 minutes roughly doubles the market share.
3. The effect of roughly doubling cruise speed from 140 mph to 260 mph increases market share by only 40%. The speed effect is masked by the system times for access, egress, and waiting for service which total over 40 minutes for the example shown.
C. Conclusions
The results of the above modal for model split amongst competing urban transportation modes must be viewed with caution. There is a need for gathering
marketing data on competing modes of transportation in urban areas where competion now exists, with a view towards attempting to develop modal split models in which we may plore enough conficence to begin to make decisions recording new forms.
TTC 1
WITH NRT-40
P -
0.10
10
20
30
40
50
100
90
80
IR - TTC 1AUTO
60
MPH
101
0
0
0
10
20
30
40
50
NRT - 40 MPI
'AUTO
10
20
30
40
50
DISTANCE (MILES)
Figure 3 AIRURBAN MARKET SHARE
- 0.8
%
0.2%
40
50
100
90
80
20-10
0-0
0
10
20
30
40
50
NRT-40
AIR
10
20
30
40
50
DISTANCE (MILES)
Figure 4 AIRURBAN MARKET SHARE (In Competition with NRT-40)
(NON-RESIDENT CASE)
TTC
2
TTC 1
(30-ULJ Ta + Te
--
15
MIN
t20-eo
30 MIN
10-45 MIN
60
MIN
0
0
10
20
30
40
50
16
-o14
-
140
-012
-
120-10
T T1
100-
Ta +Te
O).0 60 8 - 80'-80
45
6 -
60
30
4
AUO4-15
2
20 -
AUTO
1
0 -
01
1
0
10
20
30
40
50
0
10
20
30
40
50
DISTANCE (MILES)
AIR SPEED
260 MPH
220 MPH
180 MPH
140 MPH
10
20
30
40
100
90
80
16
-14
-12
-0
TTC 1
8
-6
4
AUTO FARE
2
0
10
20
30
40
50
MPH
9140
o-180
220
260
AUTO
10
20
30
40
50
DI STANCE (MILES)
FREQUENCY (N)
ONE WAY FLIGHTS
. - 60
0:60
50
0j10-
-
40
--
30
t:
<C
20
z
<
5
-co-10
0
0 10203
40
50
100
N
90
16
80
~14 -70
LA
30R
n
12
-
-60-TTC 1
50
LU 610 -
50
8
-
40
-00 CL~40-6 -
230
-I.-
AUTO
04 -
AUTO
20
-2
10-0
10
20
30
40
50
0
10
20
30
40
50
DISTANCE -MILES
of urban transportation. Indeed, it may never be possible to perform realistic analysis, and it then becomes necessary to perform marketing experiments as part of demonstration projects using prototype of new transportation systems. This will be a time consuming and expensive process, and cannot be undertaken for all of the concepts which exist.
In the absence of good analytical methods, and in view of the time and expense of demonstrating new forms of public transportation, it may not be possible to
present rational arguments favoring one system over another. Instead we may be forced to rely upon the intuition and judgement of all those persons involved in developing the nation's transportation system.
The judgements which can be made as a result of this study drawn from the work of this section and Appendix B are:
1. It is likely to be impossible for any form of public transportation to replace private forms of transportation as the predominant system in the urban area because of the problem of access to the public system.
2. In particular markets, where geography, or roadway congestion, or trip distinces are over 20 miles. Public forms of transportation can compete successfully, although they may require public subsidy for construction and operation.
3. If mass transit rail, systems are adopted by US cities as a result of the Mass Transit Act of 1970, it is unlikely that urban air systems would be allowed to compete for the commuter and personal shopping travel markets. The development of urban air systems must be coordinated with each city's plans for public transportation systems.
SECTION 4
CONCEPTS FOR URBAN AIR TRANSPORTATION SYSTEMS
While there is a great number of concepts for urban air systems which can be described in specific detail, they can be grouped into two general categories which shall be called "Metrobus" and "Metrotaxi" in this report. The present helicopter systems which provide airport services at New York, Los Angeles, and San Francisco are examples of Metrobus systems. The small helicopter systems similar to the operations of Air General described in Appendix C, are examples of metrotaxi systems. In both categories there are a large number of conceptual systems and their combinations and variants. In general we are considering urban air systems operating within a given metropolitan area of radius less than 50 miles, and providing reliable, convenient, frequent service using VTOL or STOL vehicles with cruising speeds from 180 to 400 mph.
A. Metrobus Concepts
Metrobus concepts use 40-100 seat VTOL (or perhaps STOL) vehicles in a regularly scheduled service between well developed stopping points called metro-ports. Services would be operated night and day in all kinds of weather conditions. The travel markets served would vary from one application to the next, but it would be able to cover airport access, commuter, air cargo pickup, mail, regional business, and the "new town" transportation link described earlier.
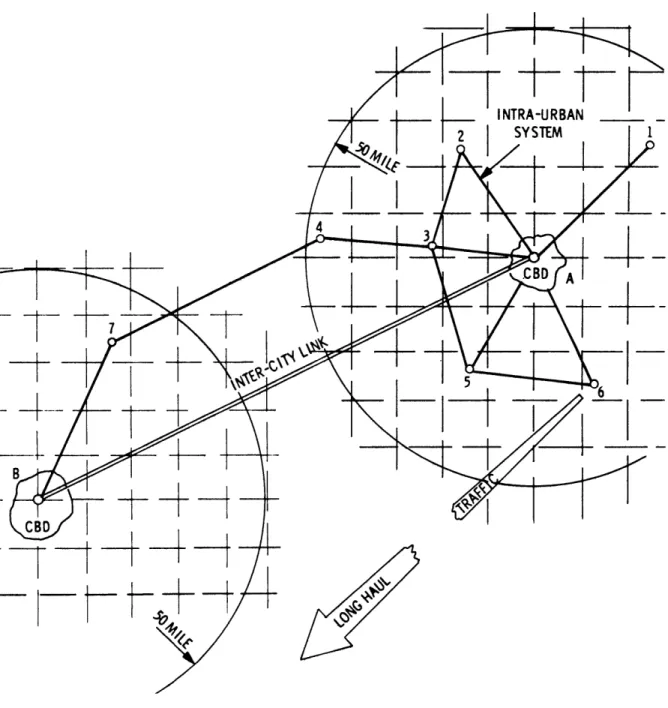
Figure 8 presents the general geographical arrangement which defines the Intra-Urban area. Although the entire area may be heavily populated, certain major concentrations of facilities with central business districts exist, as A and B. Radii of 50 miles are indicated by the circles. If one were to subdivide the area arbi-trarily into squares 10 miles on a side, approximately 80 squares are contained within the 50 mile radius. The 10 mile dimension merely reflects the difficulties the air mode has in competing with ground modes for block distances less than 10 miles. One can postulate a metroport at each of these squares, but it is unlikely such a dense distribution would exist.
Although the CTOL airports would constitute a few of the nodes of the system, the function of the system is more than just that of an airport feeder or distributor.
In Figure 8, node 6 is intended to suggest the location of a large CTOL traffic hub or perhaps an international airport near city A. The vehicles are 40-100 passen-ger, quiet VTOL aircraft of the type summarized in Section C1. There would be perhaps several vertiports located at suburban centers, industrial and business complexes, and passenger collection points to permit relatively short access and
egress times.
An abbreviated suggestion of a route structure is given in the figure. It appears that much of the travel market would be radial, to and from the outer sub-urban complexes and the central business district. However, just as circumferen-tial highways have been found necessary, there would be circumferencircumferen-tial air routes also, such as 2-3-5-6, as shown.
Service would be scheduled, with sufficient frequency to provide low wait times. Some routes would be multi-stop, such as 4-3-A, but with a capability for omitting landings when no passenger movement existed at certain stops.
The objective of the system is to provide convenient, expeditious air trans-portation throughout the 50 mile region. Frequently another major urban complex
B exists not much further than 100 miles from A. Thus the boundaries of the intra-urban systems for the two cities are close, and there may be market demand for movement from one to the other, such as the route 3-4-7 of Figure 8. While this provides a link between city A and city B, there no doubt will be a more direct inter-city link between the two central business districts as shown.
B. Metrotaxi Concepts
There would appear to be a small but significant market for an air taxi ser-vice as a new form of private-for-hire transportation. Such a serser-vice would
initi-ally use small 4-5 place helicopters which would reach a small vertiport or mini-mally developed landing area nearest the passenger perhaps within 5 to 10 minutes of a telephone call. Eventually higher speed quiet tilt rotor vehicles may be avail-able and both aircraft have been considered in this preliminary study. The passen-ger would then be taken in as direct a manner as possible to his destination. One can envision a two-fare structure, depending upon whether the passenger wanted to reserve the vehicle just for himself or was willing to put up with perhaps one or two stops to service other passengers along the way.
Such a taxi system could provide access and egress from the CTOL airports and the V /STOL metroports, as well as serving the specialized needs of particular users. The latter assumes the establishment of a large number of authorized land-ing areas both on roof tops and ground areas such as parkland-ing lots. There would be a great number of these throughout the area which would be used only as needed. Experience with Air General has shown that the noise levels of present small