HAL Id: hal-03159406
https://hal.inrae.fr/hal-03159406
Submitted on 9 Mar 2021HAL is a multi-disciplinary open access archive for the deposit and dissemination of sci-entific research documents, whether they are pub-lished or not. The documents may come from teaching and research institutions in France or abroad, or from public or private research centers.
L’archive ouverte pluridisciplinaire HAL, est destinée au dépôt et à la diffusion de documents scientifiques de niveau recherche, publiés ou non, émanant des établissements d’enseignement et de recherche français ou étrangers, des laboratoires publics ou privés.
Contribution of exome sequencing to the identification
of genes involved in the response to clopidogrel in
cardiovascular patients
Pierre Fontana, Mark Ibberson, Brian Stevenson, Leonore Wigger, Youssef
Daali, Anne Niknejad, François Mach, Mylène Docquier, Ioannis Xenarios,
Thomas Cuisset, et al.
To cite this version:
Pierre Fontana, Mark Ibberson, Brian Stevenson, Leonore Wigger, Youssef Daali, et al.. Contri-bution of exome sequencing to the identification of genes involved in the response to clopidogrel in cardiovascular patients. Journal of Thrombosis and Haemostasis, Wiley, 2020, 18 (6), pp.1425-1434. �10.1111/jth.14776�. �hal-03159406�
1
Contribution of exome sequencing to the identification of genes involved in the response to clopidogrel in cardiovascular patients
Pierre Fontana1,2 ; Mark Ibberson3 ; Brian Stevenson3 ; Leonore Wigger3 ; Youssef Daali1, 4 ;
Anne Niknejad3 ; François Mach2; Mylène Docquier5 ; Ioannis Xenarios3 ; Thomas Cuisset6;
Marie-Christine Alessi6; Jean-Luc Reny1,7
1 Geneva Platelet Group, Faculty of Medicine, University of Geneva, Switzerland
2 Division of Angiology and Haemostasis, Geneva University Hospitals, Geneva, Switzerland 3 SIB Swiss Institute of Bioinformatics, Vital-IT Group, University of Lausanne, Lausanne,
Switzerland
4 Division of Clinical Pharmacology and Toxicology, Geneva University Hospitals, Geneva,
Switzerland
5 iGE3 Genomics platform, University of Geneva
6 Aix Marseille University, INSERM, INRA, C2VN, APHM, Marseille, France
7 Division of General Internal Medicine, Geneva University Hospitals, Geneva, Switzerland
Corresponding author: Jean-Luc Reny
Geneva Platelet Group
Department of Internal Medicine Geneva University Hospitals Rue Gabrielle Perret-Gentil, 4 CH-1205 Geneva
Switzerland
Phone: +41-22-372 90 59 Fax: +41-22-372 91 16
2
Essentials
The identification of genetic determinants of clopidogrel response may help tailoring anti-P2Y12 drugs.
We performed exome sequencing in 96 patients with extreme phenotype in a derivation and validation cohort.
Variants in CYP2C8, CYP2C18 and CYP2C19 genes were found both in the derivation and validation cohorts.
Exome sequencing emphasizes the role of CYP-related genes as major regulators of clopidogrel response.
Abstract
Background: On-clopidogrel platelet reactivity (PR) is associated with the risk of thrombotic or bleeding event in selected populations of high-risk patients. PR is a highly heritable phenotype and a few variants of cytochrome genes, essentially CYP2C19, are associated with PR but only explain 5-12% of the variability.
Objective: The aim of this study is to delineate genetic determinants of on-clopidogrel PR using high throughput sequencing.
Methods: We performed a whole exome sequencing of 96 low- and matched high-PR patients in a discovery cohort. Exomes from genes with variants significantly associated with PR were sequenced in 96 low- and matched high-PR patients from an independent replication cohort. Results: We identified 585 variants in 417 genes with an adjusted p-value < 0.05. In the replication cohort, all top variants including CYP2C8, CYP2C18 and CYP2C19 from the discovery population were found again. An original network analysis identified several candidate genes of potential interest such as a regulator of PI3K, a key-actor in the downstream signaling pathway of the P2Y12 receptor.
Conclusion: This study emphasizes the role of CYP-related genes as major regulators of clopidogrel response, including the poorly-investigated CYP2C8 and CYP2C18.
3
Keywords: clopidogrel, drug response, platelet reactivity, exome sequencing, network analysis.
4
Introduction
Dual antiplatelet therapy with aspirin and a P2Y12 inhibitor is a cornerstone in the treatment of
acute coronary syndrome [1]. The variability of the biological response to antiplatelet drugs has been investigated for around 15 years and shown to be a predictor of recurrent ischemic events, particularly in high risk cardiovascular patients [2]. Important questions remain unanswered, such as the best tailored antiplatelet regimen according to platelet reactivity and the causes of suboptimal inhibition of platelet reactivity by these drugs. Although non-genetic factors play a definite role in the variability of antiplatelet drug responsiveness [3, 4], family-based studies suggest a moderate to strong heritability of platelet reactivity, with a h2 ranging
from 0.38 to 0.78 for epinephrine- and adenosine diphosphate-induced aggregation, respectively [5], and a strong heritability when assessing the effectiveness of one major anti-P2Y12 drug, clopidogrel, with a h2=0.73 [6]. However, the first candidate-based studies aiming
to identify gene variations associated with clopidogrel responsiveness yielded disappointing results and the identified variants explained only around 10% of the observed variability [7], and genome-wide association studies did not add much yet [6] precluding a relevant clinical application [7]. Genetic determinants of clopidogrel response is of particular importance nowadays, since antiplatelet de-escalation strategies from more potent anti-P2Y12 drugs to
clopidogrel are contemplated in selected clinical settings [8] and that genotyping could be useful to tailor antiplatelet strategy [9].
Other high throughput technologies such as whole exome sequencing (WES) may help in the identification of the molecular basis involved in the interindividual response variability to antiplatelet drugs such as clopidogrel. One of the first attempts investigated two groups of 4 patients each, with either low or high on-treatment platelet reactivity, and identified only one synonymous variant in the gene B4GALT2 as a potential determinant of clopidogrel response [10]. Several factors may explain the relative poor yield of this approach, including a small sample size and the overall method of interpretation based on single and independent variants rather than combined variants with potential synergistic effects. In the present work, we performed an exome sequencing of 2x48 cardiovascular patients with extreme platelet
5
phenotype in a discovery and a replication cohort in order to identify candidate genes and biological pathways that may explain the high heritability of clopidogrel responsiveness.
Methods Research plan
The research plan was pre-specified and filed with the Swiss National Research Fund P3
database (http://p3.snf.ch/project-153206). Both studies for the present discovery and the replication populations were approved by each local ethics committees and all patients provided an informed written consent also covering sample and data sharing.
Discovery population
The discovery population has been described in detail elsewhere [3, 11]. Briefly, the ADRIE study (Antiplatelet Drug Resistance and Ischemic Events; ClinicalTrials.gov identifier NCT00501423) is a prospective study focusing on the clinical relevance of the platelet response to aspirin and/or clopidogrel in stable cardiovascular patients.
The patients attended a first outpatient visit (V1) at least one month after the last acute ischemic event and at least 10 days after any NSAID intake, for a physical examination and blood sampling. Blood samples were collected for DNA extraction. Laboratory analyses included platelet function tests, including the quantification of the phosphorylation status of the vasodilator phosphoprotein (VASP assay), highly specific for platelet P2Y12 receptor inhibition
by clopidogrel. In total, 534 patients treated with clopidogrel 75 mg daily for less than 5 years were included for a selection of extreme platelet reactivity phenotype patients.
Replication population
The replication population has been described in detail elsewhere [12]. Briefly, consecutive patients admitted for non-ST-elevation acute coronary syndromes to the Timone Hospital (Marseille) were eligible for this study if they had undergone successful coronary stenting. Patients were discharged with the following dual antiplatelet therapy: aspirin 75 mg and
6
clopidogrel 150 mg daily. Blood samples were collected for DNA extraction. Laboratory analyses included platelet function tests, including the VASP assay, were performed at clinical follow-up one month after hospital discharge. The study protocol was approved by the ethics committee of the institution, and patients gave written informed consent for participation.
Selection and matching of extreme platelet reactivity patients
In both the discovery and replication populations, extreme platelet reactivity phenotype patients (low and high platelet reactivity – LPR and HPR) were randomly selected with matching of patients on diabetes and body weight, both variables shown to be determinant of platelet reactivity [3]. VASP cut-offs of 70% and 35 % for the HPR and LPR groups in the discovery cohort were an arbitrary compromise between the extremeness of the platelet reactivity phenotype and the ability to reach a close to perfect matching with respect to known important confounding factors. Similarly, for the replication cohort VASP cut-offs of 60% and 40 % were selected for the HPR and LPR groups.
Compliance to clopidogrel
In order to evaluate the compliance to clopidogrel prescription in HPR patients, plasma samples were analyzed for the quantitation of the major inactive metabolite of clopidogrel (clopidogrel carboxylic acid). Compared to the unstable clopidogrel active metabolite that has a very short half-live (20-30 min) and unchanged clopidogrel found at very low concentrations, clopidogrel carboxylic acid is present at very high concentration and can be easily monitored at any time between two successive doses [13]. After oral administration of a 75-mg tablet of clopidogrel, a mean Cmax of 2735 ng/ml was measured for clopidogrel carboxylic acid while only a Cmax of 0.7 ng/ml of clopidogrel was detected [14]. Trough levels, 24h post dosing, were 100 ng/ml for carboxylic acid and below the limit of detection for clopidogrel. Therefore, 50 ng was selected as a cut-off concentration for compliance taking into account inter-individual variability.
7
Clopidogrel metabolite quantification was performed using 50 μL of plasma mixed to 200 μL of acetonitrile. After centrifugation, the supernatant was directly injected to the LC-MSMS system composed of an Agilent 1290 LC system (Agilent, Paolo Alto, USA) coupled to a 6500 QTtrap® triple quadrupole linear ion trap mass spectrometer (AB Sciex, Darmstadt, Germany) in positive electrospray ionization mode. The method was fully validated and showed acceptable performances in terms of trueness and precision according to FDA guidelines for bioanalytical methods validation [15].
Whole exome and custom capture - sequencing
Sequencing was performed at the iGE3 Genomics Platform of the University of Geneva. The SureSelect Target Enrichment technology was used for library preparation (Agilent Technologies, Santa Clara, CA, USA). For exome capture, the XT2 enrichment system (protocol version B, April 2012) was used for one third of the samples and the XT system (protocol version 1.3.1, February 2012) for the rest. The Human All Exon v4 capture was used for the 96 samples. For the custom capture, the QXT enrichment system (transposase based) was used (protocol version C0, January 2015).
Library molarity and quality was assessed with the Qubit and Tapestation using a DNA High sensitivity chip (Agilent Technologies). Pools of 8 and 40 libraries were prepared respectively for exome and custom captures. Pools were loaded at 10 pM for clustering on 2 and 1 Paired-end Illumina Flow cell lanes, respectively. Reads of 100 bases were generated using the TruSeq SBS HS v3 chemistry on an Illumina HiSeq 2500 sequencer.
Average coverage of the exome bait region was about 70-fold, with more than 98% of bases having at least 10x coverage. Sequence reads were aligned to the GRCh37 reference assembly using BWA MEM [16] and duplicate reads marked with Picard tools [17]. After local realignment at indels and base recalibration, nucleotide variants were identified in a two-step procedure implemented in version3.2-2 of the Genome Analysis Tool Kit (GATK) [18] which compares base calls across all 96 samples to improve accuracy. The GATK VQSR algorithm
8
was subsequently used to dynamically filter the variants, employing statistical methods with external data sets of known quality.
Statistical analysis
Comparison of variant frequencies between HPR and LPR patients
We reasoned that variants contributing to the LPR/HPR phenotype should be over-represented in either the HPR or the LPR group. To test for this we created a contingency table for each variant, counting the occurrence of the reference or the variant allele in each group (LPR_variant, LPR_reference, HPR_variant, HPR_reference), and derived a p-value based on a Fisher test. P-values were corrected for multiple comparisons using the Benjamini Hochberg method.
Logistic regression analysis was performed on data from both the discovery population and the replication population. Prior to applying a logistic regression test to each variant location, the data set was filtered to exclude variant locations with very little variability across subjects. Subjects have 0, 1, or 2 alleles that differ from the reference genome. For the filtering, this allele count was treated as a numerical measurement, and variant locations with variance < 0.5 across all subjects were removed. A basic logistic regression model was set up as follows: the platelet reactivity phenotype (LPR or HPR) was used as the binary response variable; presence or absence of non-reference alleles was included as binary predictor variable (non-reference allele absent (0); present in one to two copies (1)). This logistic regression model was first applied to variants from all genes in the discovery population in order to identify genes with variants showing a statistically significant association with the PR phenotype. The same logistic regression model was then applied on these latter genes in the replication cohort. The result lists contain one row per variant location and are sorted by p-value. P-values were adjusted for multiple testing within each of the two results lists by the Benjamini-Hochberg method, which controls for false discovery rate, counting a single test for each variant.
9
Principal Component Analysis (PCA)
Since our goal was to find genetic variants that can be used to in some way to “define” the PR phenotype, a principal component analysis (PCA) using all significant variants in the discovery cohort was performed. PCA is a dimensionality reduction analysis that reduces multidimensional data (in this case the different variants) into a smaller number of dimensions; these are termed the principal components (PCs) of the variation, PC1 represents the largest fraction of the total variation then PC2, then PC3 etc. A scatterplot of the first 2 PCs allows a visual evaluation of the ability of the identified variants to separate HPR and LPR patients.
Discriminant Analysis of Principal Components (DAPC)
Provided that the genetic variation is able to separate the HPR and LPR groups by PCA, we want to find the minimum number of variants that could distinguish between the two groups. Finding such a set of variants is a prerequisite for testing in a separate cohort of patients. For this we performed discriminant analysis of the principal components [19]. The goal of DAPC is to construct one or more linear discriminants from a set of principal components that maximally separate samples into predefined groups. In our case we have 2 groups, HPR and LPR. A common problem with this type of analysis is that if too many principal components are used for the discriminant analysis, the resulting linear discriminant can overfit the data. One way for testing for this is to randomize the sample labels and repeat the analysis; if the linear discriminant is able to still separate randomly assigned groups then there is an overfitting problem. Another way is to perform a cross-validation, where 10% of the samples are removed randomly N times, and the performance of the resulting linear discriminant measured on these samples. If too many PCs are used, the cross-validation performance will be lower, indicating overfitting. To try to minimize overfitting, two scores were calculated for different numbers of PCs, and the number of PCs to use was taken as the lowest number predicted from both scores. The first score, the a score, was calculated measuring the proportion of true assignments in the original data compared to assignments made on randomized data; the second score (b score) was a cross-validation test removing 10% of samples 100 times and
10
measuring the average performance. The analysis was performed with different numbers of genetic variants, ordered by increasing p-value starting from 10 up to 300 in order to identify the minimum number of variants required to achieve a success rate of 100%.
Simulation of the effect of increasing extreme patients on variant discovery
The 96 patients in the discovery cohort were ranked according to PR phenotype. Three different methods were used for the ranking: (i) the difference in PR between matching pairs was calculated and the patients ranked according to this difference (high to low); (ii) the PR value of the HPR individual in the matching pair was used to rank the patients (high to low); (iii) the PR value independent of pair was used to rank the patients (high to low). Contingency tables for testing HPR versus LPR differences were then created with 12, 24, 36, 48, 60, 72 and 96 patients for each of the three ranked lists by including first the most extreme patients and then including successively less extreme patients. Fisher P values were then calculated for each variant with increasing numbers of patients and corrected for multiple comparisons using Benjamini Hochberg FDR correction. The mean numbers of significant variants after multiple testing correction from the three ranked methods were then plotted against number of extreme phenotype patients.
Network construction and pathway analysis
We investigated the variant genes associated with HPR in the ADRIE cohort further by building a molecular network using two complementary sources. Firstly, we manually curated literature around these genes and extracted information from the relevant publications on the type (e.g. activation or inhibition, binding) and description of experimentally determined interactions (evidence tags), what cell type or tissue the interaction was observed and the conditions of the experiment. We used several databases to search for relevant information, including Pubmed, Google Scholar, iHOP, EVEX and GeneCards. All interactions were evaluated by tracing back to the original article text and figures and were only included if the curator judged that there was sufficient evidence for a functional link between two genes. In addition to annotating direct
11
links between the genes selected from the discovery cohort based on the statistically significant variants, we also searched manually for additional genes, which may ‘bridge the gap’ between the selected genes. Such linking genes are not part of the list of 417 genes, but were included to help complete the network of functional interactions. Since it is difficult to be exhaustive using a manual annotation approach, we also complemented the network by searching the STRING database and extracting all experimentally determined interactions between the selected genes. These interactions were then merged with the manually created network.
Results
Characteristics of extreme platelet reactivity patients
Extreme platelet reactivity phenotype patients from the discovery ADRIE population were treated with 75 mg clopidogrel once daily. Extreme platelet reactivity phenotype patients from the replication MARSEILLE population were treated with 150 mg clopidogrel once daily. Patients in both discovery and validations samples were matched for diabetes and body weight as shown in Table 1. Compliance to clopidogrel was confirmed in all HPR patients. A pair of matched samples in the validation population had to be excluded because of an unnoticed duplicate inclusion of one patient that was identified with the exome sequencing and confirmed with the original patient identification. Further analyses were thus performed on 94 samples from the validation population.
Whole exome sequencing (WES) identified a set of variants able to segregate extreme patients in the discovery ADRIE population
WES was performed in the 96 patients from the discovery ADRIE population as described in the Methods, which led to the discovery of a total of 474'896 variants.
The evaluation of the putative over-representation of genetic variants in either groups (LPR or HPR) identified 585 variants in 417 genes with an adjusted p-value < 0.05 (Table S1 in the supplementary online-only material). Figure 1 shows a Manhattan plot of the results indicating
12
the top 10 significant gene variants. The most significant variants identified were CYP2C19 and CYP2C18 (MTND4P19 is a pseudo gene that is in linkage disequilibrium (LD) with CYP2C19/18; Figure 1). CYP2C19, CYP2C18, CYP2C8 are all three cytochrome P450 genes mapped to chromosome 10. CYP2C18 and 2C8 variants were in linkage disequilibrium with CYP2C19*2 (rs4244285), a variant involved in the bio-activation of clopidogrel. The next most significant variant was in NOC3L, which is also mapped to chromosome 10 and encodes for a nucleolar complex-associated protein 3 previously shown to play a role in adipogenesis [20]. In addition to the well-known cytochrome P450 variants, and NOC3L, we identified several other variants in additional genes, such as SVIL, CD82, HLA-B, MED16 and TBCD1 (Figure 1), which could potentially define yet unknown molecular pathways underlying the platelet reactivity phenotype. In order to gain more insight into whether such a panel of gene variants could, in theory, be sufficient to segregate HPR and LPR patient groups, we performed a principal component analysis (PCA) using the 585 selected variants on the ADRIE samples. Figure 2 shows a scatterplot of the first two principal components and indicates clear separation of the HPR (red) and LPR (blue) patient groups. This analysis informed us that, whilst many of the variants identified might differ only by chance between HPR and LPR patient groups in this population, 585 variants were sufficient to clearly separate the patient groups based solely on their genotypes.
We next estimated the minimum number of variants that are needed to separate HPR and LPR patients in this cohort. To do this we performed a discriminant analysis of principal components (DAPC) [19]. The analysis was performed with different numbers of genetic variants, ordered by increasing p-value starting from 10 up to 300, and using cross-validation (repeating the analysis 100 times, leaving out 10% of samples at random each time) to minimize overfitting. The minimum number of variants required to achieve perfect separation of HPR and LPR samples was 130 (top 130 variants in table S1). Figure 3 shows a density plot of the individual patient scores on the discriminant function.
Using a conventional logistic regression with multiple testing adjustment based on 143’490 filtered different variants not accounting for LD, 11 variants located in four different genes
13
(CYP2C8, CYP2C19, CYP2C18, NOC3L) were identified as significant, with adjusted p-values < 0.05 (Table 2). Of note, these 11 variants were not sufficient to discriminate HPR and LPR on PCA analysis.
In summary, our results from the ADRIE discovery cohort predicted 585 variants corresponding to 417 differing genes between HPR and LPR individuals. These variants were able to separate HPR and LPR patient groups by PCA. We predicted that at least 130 variants would be required to separate HPR from LPR groups in this population using a supervised discriminant analysis, while from a conventional and more stringent logistic regression selection, only 11 variants in 4 genes were associated with the platelet reactivity phenotype. These 11 variants in four genes, though robustly associated with the PR phenotype, were not sufficient to discriminate between HPR and LPR patients. We therefore used the initial 417 genes predicted from our initial analysis as the most likely potential candidates for the construction of a network and for further validation in an independent cohort.
Sample size issue
There is no formal method to evaluate the number of subjects needed for this kind of whole exome study or to assess its power to identify new genes and pathways relevant to the platelet reactivity phenotype of interest. We thus simulated the incremental contribution of increasing number of patients on the number of significant variants identified as described in Methods. Figure S1 (see supplementary online-only material) shows with various approaches that, from 12 up to 96 patients, the number of discovered variants levels off from 48 to 96 patients, indicating that the addition of further patients from the discovery cohort is not likely to lead to the identification of many more variants significantly associated with PR phenotype.
Curated network of variant genes able to segregate extreme patients of the discovery cohort A curated molecular network was built as described in the Methods section using the variant genes identified in the ADRIE discovery cohort (n=417). A representation of the network is shown in Figure 4. This network allows the visualization of the interaction of the genes most
14
significantly associated with HPR and LPR, including CYP2C18, CYP2C19 and CYP2C9. When considering clusters of this network, we identify genes with a high density of connections such as the gene coding for mitogen-activated protein kinase 1 (MAP2K1), fibronectin 1 (FN1) and phosphoinositide-3-Kinase regulatory subunit 1 (PIK3R1).
Targeted exome sequencing of a gene panel in an independent replication cohort
Based on our findings from the ADRIE cohort, we performed a targeted exome capture of the 417 selected genes and sequencing on the independent MARSEILLE replication cohort to determine which of these genes would bear variants associated to the PR phenotype. A total of 23’285 variants in 417 genes were identified which, after filtering, lead to 7’698 different variants. We performed logistic regression comparing HPR and LPR variants as described in Methods. When focusing on the genes identified in the discovery ADRIE cohort (CYP2C8, CYP2C19, CYP2C18 and NOC3L) only 18 out of 38 variants were significantly different between HPR and LPR patients using the same logistic regression approach in the MARSEILLE replication cohort. These significant variants are in the CYP2C8, CYP2C19, CYP2C18 and NOC3L genes (Table 3).
Discussion
This study demonstrates that the genes more consistently associated with the variability of clopidogrel responsiveness both in the derivation and validation cohorts are most likely related to the activation of the prodrug and include CYP2C8, CYP2C18 and CYP2C19. As expected, the well-known CYP2C19*2 polymorphism (rs 4417205) belongs to the variants associated with clopidogrel responsiveness in both cohorts.
It is however likely that numerous other genes with a minor magnitude of impact on this phenotype are implicated [21, 22]. Indeed, in our derivation cohort, several other genes were pointed out, with 130 of them being able to perfectly discriminate between the two groups of extreme patients with LPR and HPR. The construction of a network enabled a representation
15
of the connections between those genes with the identification of highly connected genes that may delineate important players in the variability of clopidogrel responsiveness. One of them is fibronectin 1, a component of subendothelial matrices and abundant in plasma [23]. Fibronectin binds to platelet, at least in part through the fibrinogen GPIIbIIIa receptor and could impact VASP phosphorylation through outside-in signaling via cAMP-dependant protein kinase [24, 25]. Another highly connected gene is the regulatory subunit 1 of phosphoinositide-3-Kinase (PI3K), also named p85α and encoded by the PIK3R1 gene. This protein is a key regulator of one of the main two signaling pathways downstream the P2Y12 receptor, PI3K,
which is activated upon P2Y12 stimulation by ADP, while VASP phosphorylation occurs via
activation of adenylate cyclase [26]. It is of importance to mention that VASP phosphorylation does not play a key part in integrin activation but is rather a marker of the P2Y12 activation
state [26], highlighting the role of PI3K and its regulators in P2Y12-related platelet activation.
Together with the well-known CYP2C19 gene, the CYP2C18 and CYP2C8 genes were also validated, consistent with the findings of an association between single-nucleotide polymorphisms in the CYP2C18-CYP2C19-CYP2C9-CYP2C8 cluster with diminished clopidogrel response in healthy subjects [6]. This emphasizes the potential relevance of these two genes that were not investigated up to now in vitro. Indeed, the metabolism of clopidogrel is still not totally understood, even though the CYP3A4, CYP2C19, and CYP1A2 seem to be the genes most implicated [27, 28]. The use of human microsomes or supersomes could delineate the in vitro contribution of CYP2C18 and CYP2C8, as it was done for other cytochrome P450 enzymes [29]. Finally, the NOC3L gene was identified in both cohorts. This gene codes for a protein shown to play a role in adipogenesis [20], and we can speculate that the NOC3L gene may impact the pharmacokinetics and pharmacodynamics of clopidogrel through adipogenesis since the impact of obesity on clopidogrel response is well documented [30].
Scott et al. reported that the B4GALT2 gene variants rs1061781 and rs1859728 were more likely present in the LPR controls in their study [10]. We find that they are equally-represented in both LPR and HPR in the ADRIE discovery cohort (p value of 0.57 and 0.76 respectively),
16
and therefore were not selected for validation in the MARSEILLE cohort. Several causes may account for this apparent discrepancy, including differences in populations and in platelet function evaluation. Indeed, aggregation-based assays used in this previous study [10] are less specific than the VASP assay [31]. In addition, our data are in line with another study not able to confirm the association between B4GALT2 gene variants and VASP [32].
There are some limitations in this study. Our validation cohort did not allow validation of the majority of the genes depicted in the network, although 18% of genes (11 out of 62 genes) from the top 100 variants ranked based on increasing p-value of the derivation cohort belong to the top 100 variants of the validation cohort. The difference in the characteristics of the 2 cohorts of patients may have accounted for this finding, allowing to validate only genes with the strongest impact – those affecting the activation of the prodrug. Indeed, while patients of the derivation cohort were on clopidogrel 75 mg/day, those of the validation cohort were on 150 mg/day. We speculate that doubling the maintenance dose of clopidogrel may have affected the validation of genes, with a minor impact on clopidogrel responsiveness. The different clopidogrel doses in the discovery and replication cohorts, 75 and 150 mg daily respectively, may have decreased the sensitivity to replicate primary cohort findings in the discovery cohort. Although there does not appear to be an interaction between clopidogrel doses and the association between CYP2C19*2 status and platelet reactivity [33], this cannot be extrapolated to other variants. The time from drug intake to dosing for PR may also have differed between the discovery and replication cohorts, which could also have interfered. However, this was studied and shown to have no major impact for the discovery cohort [3], although it has not been verified in the replication cohort. The present data cannot be extrapolated to African or Asian descent populations as those were not represented in our cohorts. Finally, due to a predefined need to have HPR and LPR matched on important determinants of PR the cutoffs to define HPR and LPR in the discovery cohort (70 and 35% respectively) and in the replication cohort (60 and 40% respectively) were rather close, thus limiting the extremeness of PR between the groups under comparison. These cut-offs still allowed to have very contrasted VASP-PRI (%) mean (SD) values with 25.8 (7.5) versus 76.0
17
(4.8) in the LPR and HPR discovery cohort groups respectively and 23.9 (8.6) versus 69.5 (6.6) in the LPR and HPR replication cohort groups respectively.
Altogether, this study emphasizes the role of CYP-related genes as major regulators of clopidogrel response, including poorly-investigated CYP such as 2C8 and 2C18, and through an original network approach pointed to other candidate genes, such as a regulator of PI3K, a key-actor in downstream signaling pathway of the P2Y12 receptor. This gene warrants to be
tested in other studies for validation, including those with other anti-P2Y12 inhibitors.
Funding
This work was supported by the Swiss National Foundation for Scientific Research (320030_153206), the Stifung für Herz und Kreislaufforschung Foundation and the ISTH2007 Presidential Fund.
Author contributions
P.F., M.I., L.W. and J.-L.R. wrote the first draft of the manuscript. P.F., I.X. and J.-L.R. designed the study. P.F., M.D., J.-L.R., F.M., Y.D., T.C. and M.-C.A. collected the data. M.I, B.S., L.W., A.N., I.X. performed the bioinformatics analysis.
Acknowledgments
We thank Oliver Delaneau and Christophe Combescure for the random selection of extreme phenotype patients and their matching; Niloufar Marsousi for her help with the LC/MS-MS quantification of plasma carboxy-clopidogrel; Séverine Nolli for her expert assistance with the management of samples.
Conflict of interest
PF reports travel grants from Sobi, MCA reports board membership for Astra Zeneca and Lilly; lectures for Roche. The other authors do not report any conflict of interest.
18
References
1 Valgimigli M, Bueno H, Byrne RA, Collet JP, Costa F, Jeppsson A, Juni P, Kastrati A, Kolh P, Mauri L, Montalescot G, Neumann FJ, Petricevic M, Roffi M, Steg PG, Windecker S, Zamorano JL, Levine GN. 2017 ESC focused update on dual antiplatelet therapy in coronary artery disease developed in collaboration with EACTS: The Task Force for dual antiplatelet therapy in coronary artery disease of the European Society of Cardiology (ESC) and of the European Association for Cardio-Thoracic Surgery (EACTS). Eur Heart J. 2018; 39: 213-60. 2 Reny JL, Fontana P, Hochholzer W, Neumann FJ, Ten Berg J, Janssen PW, Geisler T, Gawaz M, Marcucci R, Gori AM, Cuisset T, Alessi MC, Berdague P, Gurbel PA, Yong G, Angiolillo DJ, Aradi D, Beigel R, Campo G, Combescure C. Vascular risk levels affect the predictive value of platelet reactivity for the occurrence of MACE in patients on clopidogrel. Systematic review and meta-analysis of individual patient data. Thromb Haemost. 2016; 115: 844-55.
3 Fontana P, Berdague P, Castelli C, Nolli S, Barazer I, Fabbro-Peray P, Schved JF, Bounameaux H, Mach F, De Moerloose P, Reny JL. Clinical predictors of dual aspirin and clopidogrel poor responsiveness in stable cardiovascular patients from the ADRIE study. J Thromb Haemost. 2010; 8: 2614-23.
4 Geisler T, Grass D, Bigalke B, Stellos K, Drosch T, Dietz K, Herdeg C, Gawaz M. The Residual Platelet Aggregation after Deployment of Intracoronary Stent (PREDICT) score. J Thromb Haemost. 2008; 6: 54-61.
5 Bray PF, Mathias RA, Faraday N, Yanek LR, Fallin MD, Herrera-Galeano JE, Wilson AF, Becker LC, Becker DM. Heritability of platelet function in families with premature coronary artery disease. J Thromb Haemost. 2007; 5: 1617-23.
6 Shuldiner AR, O'Connell JR, Bliden KP, Gandhi A, Ryan K, Horenstein RB, Damcott CM, Pakyz R, Tantry US, Gibson Q, Pollin TI, Post W, Parsa A, Mitchell BD, Faraday N, Herzog W, Gurbel PA. Association of cytochrome P450 2C19 genotype with the antiplatelet effect and clinical efficacy of clopidogrel therapy. JAMA. 2009; 302: 849-57.
19
7 Fontana P, Cattaneo M, Combescure C, Reny JL. Tailored Thienopyridine therapy: no urgency for CYP2C19 genotyping. J Am Heart Assoc. 2013; 2: e000131.
8 Sibbing D, Aradi D, Alexopoulos D, Ten Berg J, Bhatt DL, Bonello L, Collet JP, Cuisset T, Franchi F, Gross L, Gurbel P, Jeong YH, Mehran R, Moliterno DJ, Neumann FJ, Pereira NL, Price MJ, Sabatine MS, So DYF, Stone GW, Storey RF, Tantry U, Trenk D, Valgimigli M, Waksman R, Angiolillo DJ. Updated Expert Consensus Statement on Platelet Function and Genetic Testing for Guiding P2Y12 Receptor Inhibitor Treatment in Percutaneous Coronary Intervention. JACC Cardiovasc Interv. 2019; 12: 1521-37.
9 Claassens DMF, Vos GJA, Bergmeijer TO, Hermanides RS, van 't Hof AWJ, van der Harst P, Barbato E, Morisco C, Tjon Joe Gin RM, Asselbergs FW, Mosterd A, Herrman JR, Dewilde WJM, Janssen PWA, Kelder JC, Postma MJ, de Boer A, Boersma C, Deneer VHM, Ten Berg JM. A Genotype-Guided Strategy for Oral P2Y12 Inhibitors in Primary PCI. N Engl J Med. 2019.
10 Scott SA, Collet JP, Baber U, Yang Y, Peter I, Linderman M, Sload J, Qiao W, Kini AS, Sharma SK, Desnick RJ, Fuster V, Hajjar RJ, Montalescot G, Hulot JS. Exome sequencing of extreme clopidogrel response phenotypes identifies B4GALT2 as a determinant of on-treatment platelet reactivity. Clin Pharmacol Ther. 2016; 100: 287-94.
11 Reny JL, Berdague P, Poncet A, Barazer I, Nolli S, Fabbro-Peray P, Schved JF, Bounameaux H, Mach F, de Moerloose P, Fontana P. Antiplatelet Drug Response Status Does Not Predict Recurrent Ischemic Events in Stable Cardiovascular Patients: Results of the Antiplatelet Drug Resistances and Ischemic Events Study. Circulation. 2012; 125: 3201-10. 12 Cuisset T, Grosdidier C, Loundou AD, Quilici J, Loosveld M, Camoin L, Pankert M, Beguin S, Lambert M, Morange PE, Bonnet JL, Alessi MC. Clinical implications of very low on-treatment platelet reactivity in patients treated with thienopyridine: the POBA study (predictor of bleedings with antiplatelet drugs). JACC Cardiovasc Interv. 2013; 6: 854-63.
13 Mani H, Toennes SW, Linnemann B, Urbanek DA, Schwonberg J, Kauert GF, Lindhoff-Last E. Determination of clopidogrel main metabolite in plasma: a useful tool for monitoring therapy? Therapeutic drug monitoring. 2008; 30: 84-9.
20
14 Savu SN, Silvestro L, Surmeian M, Remis L, Rasit Y, Savu SR, Mircioiu C. Evaluation of Clopidogrel Conjugation Metabolism: PK Studies in Man and Mice of Clopidogrel Acyl Glucuronide. Drug Metab Dispos. 2016; 44: 1490-7.
15 Marsousi N, Daali Y, Fontana P, Reny JL, Ancrenaz-Sirot V, Calmy A, Rudaz S, Desmeules JA, Samer CF. Impact of Boosted Antiretroviral Therapy on the Pharmacokinetics and Efficacy of Clopidogrel and Prasugrel Active Metabolites. Clin Pharmacokinet. 2018. 16 Li H, Durbin R. Fast and accurate short read alignment with Burrows-Wheeler transform. Bioinformatics. 2009; 25: 1754-60.
17 Li H, Handsaker B, Wysoker A, Fennell T, Ruan J, Homer N, Marth G, Abecasis G, Durbin R. The Sequence Alignment/Map format and SAMtools. Bioinformatics. 2009; 25: 2078-9.
18 DePristo MA, Banks E, Poplin R, Garimella KV, Maguire JR, Hartl C, Philippakis AA, del Angel G, Rivas MA, Hanna M, McKenna A, Fennell TJ, Kernytsky AM, Sivachenko AY, Cibulskis K, Gabriel SB, Altshuler D, Daly MJ. A framework for variation discovery and genotyping using next-generation DNA sequencing data. Nature genetics. 2011; 43: 491-8. 19 Jombart T, Ahmed I. adegenet 1.3-1: new tools for the analysis of genome-wide SNP data. Bioinformatics. 2011; 27: 3070-1.
20 Tominaga K, Johmura Y, Nishizuka M, Imagawa M. Fad24, a mammalian homolog of Noc3p, is a positive regulator in adipocyte differentiation. Journal of cell science. 2004; 117: 6217-26.
21 Kunicki TJ, Nugent DJ. The genetics of normal platelet reactivity. Blood. 2010; 116: 2627-34.
22 Trenk D, Hochholzer W. Genetics of platelet inhibitor treatment. Br J Clin Pharmacol. 2014; 77: 642-53.
23 Cho J, Mosher DF. Role of fibronectin assembly in platelet thrombus formation. J Thromb Haemost. 2006; 4: 1461-9.
21
24 Unsworth AJ, Kriek N, Bye AP, Naran K, Sage T, Flora GD, Gibbins JM. PPARgamma agonists negatively regulate alphaIIbbeta3 integrin outside-in signaling and platelet function through up-regulation of protein kinase A activity. J Thromb Haemost. 2017; 15: 356-69. 25 Li Z, Ajdic J, Eigenthaler M, Du X. A predominant role for cAMP-dependent protein kinase in the cGMP-induced phosphorylation of vasodilator-stimulated phosphoprotein and platelet inhibition in humans. Blood. 2003; 101: 4423-9.
26 Gachet C. Antiplatelet drugs: which targets for which treatments? J Thromb Haemost. 2015; 13 Suppl 1: S313-22.
27 Ancrenaz V, Daali Y, Fontana P, Besson M, Samer C, Dayer P, Desmeules J. Impact of genetic polymorphisms and drug-drug interactions on clopidogrel and prasugrel response variability. Curr Drug Metab. 2010; 11: 667-77.
28 Storelli F, Daali Y, Desmeules J, Reny JL, Fontana P. Pharmacogenomics of Oral Antithrombotic Drugs. Curr Pharm Des. 2016; 22: 1933-49.
29 Kazui M, Nishiya Y, Ishizuka T, Hagihara K, Farid NA, Okazaki O, Ikeda T, Kurihara A. Identification of the human cytochrome P450 enzymes involved in the two oxidative steps in the bioactivation of clopidogrel to its pharmacologically active metabolite. Drug Metab Dispos. 2010; 38: 92-9.
30 Norgard NB, Monte SV. Obesity and Inflammation and Altered Clopidogrel Pharmacokinetics and Pharmacodynamics. Drug metabolism letters. 2017; 11: 3-13.
31 Reny JL, Bonvini RF, Bonvini JM, Roffi M, Fontana P. Poor responsiveness to antiplatelet drugs in acute coronary syndromes: clinical relevance and management. Cardiovasc Ther. 2012; 30: e41-50.
32 Pallet N, Belleville-Rolland T, Savalle A, Lejeune M, Mauge L, Bertil S, Loriot MA, Gaussem P. Beta-1,4-galactosyltransferase 2 c.909C>T gene variant is predictive of on-clopidogrel platelet reactivity. Pharmacogenomics. 2018; 19: 937-45.
33 Mega JL, Hochholzer W, Frelinger AL, 3rd, Kluk MJ, Angiolillo DJ, Kereiakes DJ, Isserman S, Rogers WJ, Ruff CT, Contant C, Pencina MJ, Scirica BM, Longtine JA, Michelson
22
AD, Sabatine MS. Dosing clopidogrel based on CYP2C19 genotype and the effect on platelet reactivity in patients with stable cardiovascular disease. JAMA. 2011; 306: 2221-8.
23
Figure Legends
Figure 1: Manhattan plot of variants in the discovery cohort with their p-value for the association with the platelet reactivity phenotype.
Figure 2: Scatterplot of the first 2 principal components (PCs) from PCA of 585 significantly different variants (HPR vs LPR; p-value [adjusted] < 0.05).
Figure 3: Density of individual scores on the DAPC discriminant function derived from the top 130 variants, with groups represented in red and blue.
Figure 4: Curated network of variant genes for on-treatment high platelet reactivity. Genes and small molecules are represented by nodes and the relationships between them by edges. Node color indicates provenance: Current study (orange), Other study (blue); Node size is proportional to mean –log P (nominal) of genetic association calculated by logistic regression comparing HPR and LPR in discovery and validation cohorts; Edge colour indicates provenance of relationship: Literature curation (blue), STRING (green), literature curation AND STRING (black). Arrowheads indicate activation; circles represent inhibition; No arrowhead or circle indicates unknown relationship.
24
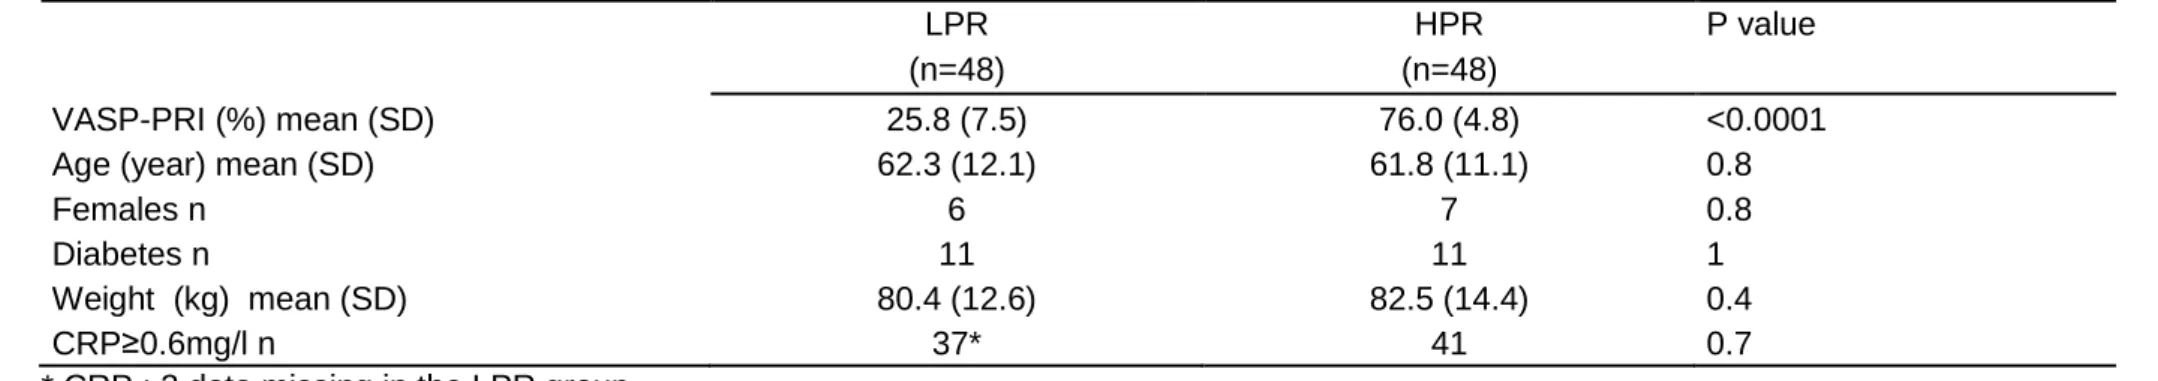
Table 1. Extreme phenotype patients in the discovery (A) and replication (B) populations A
LPR HPR P value
(n=48) (n=48)
VASP-PRI (%) mean (SD) 25.8 (7.5) 76.0 (4.8) <0.0001
Age (year) mean (SD) 62.3 (12.1) 61.8 (11.1) 0.8
Females n 6 7 0.8
Diabetes n 11 11 1
Weight (kg) mean (SD) 80.4 (12.6) 82.5 (14.4) 0.4
CRP≥0.6mg/l n 37* 41 0.7
* CRP : 3 data missing in the LPR group B
LPR HPR P value
(n=47) (n=47)
VASP-PRI (%) mean (SD) 23.9 (8.6) 69.5 (6.6) <0.0001
Age (year) mean (SD) 65.6 (13.8) 66.5 (11.5) 0.7
Females n 11 13 0.2
Diabetes n 17 17 1
Weight (kg) mean (SD) 76.9 (15.0) 75.4 (12.9) 0.6
CRP≥0.6mg/l n 42 44* 0.3
* CRP : 1 data missing in the HPR group
LPR: low platelet reactivity; HPR: high platelet reactivity; VASP-PRI: vasodilator stimulated phosphoprotein platelet reactivity index; CRP: C reactive protein
25
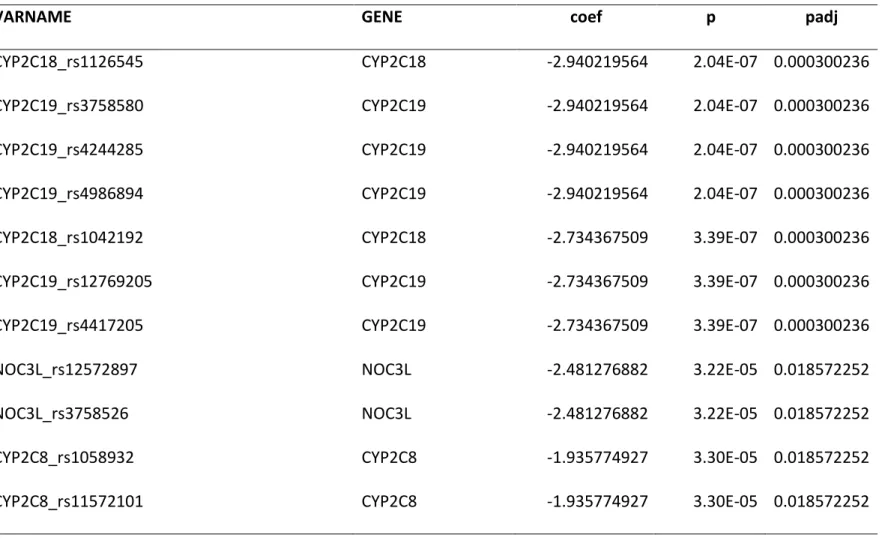
Table 2: Genes with their variants significantly associated with the PR phenotype in the discovery cohort. P values are from a logistic regression performed in the discovery cohort and adjusted for the total number of filtered variants (6191 variants from 395 genes).
VARNAME
GENE
coef
p
padj
CYP2C18_rs1126545
CYP2C18
-2.940219564
2.04E-07 0.000300236
CYP2C19_rs3758580
CYP2C19
-2.940219564
2.04E-07 0.000300236
CYP2C19_rs4244285
CYP2C19
-2.940219564
2.04E-07 0.000300236
CYP2C19_rs4986894
CYP2C19
-2.940219564
2.04E-07 0.000300236
CYP2C18_rs1042192
CYP2C18
-2.734367509
3.39E-07 0.000300236
CYP2C19_rs12769205
CYP2C19
-2.734367509
3.39E-07 0.000300236
CYP2C19_rs4417205
CYP2C19
-2.734367509
3.39E-07 0.000300236
NOC3L_rs12572897
NOC3L
-2.481276882
3.22E-05 0.018572252
NOC3L_rs3758526
NOC3L
-2.481276882
3.22E-05 0.018572252
CYP2C8_rs1058932
CYP2C8
-1.935774927
3.30E-05 0.018572252
26
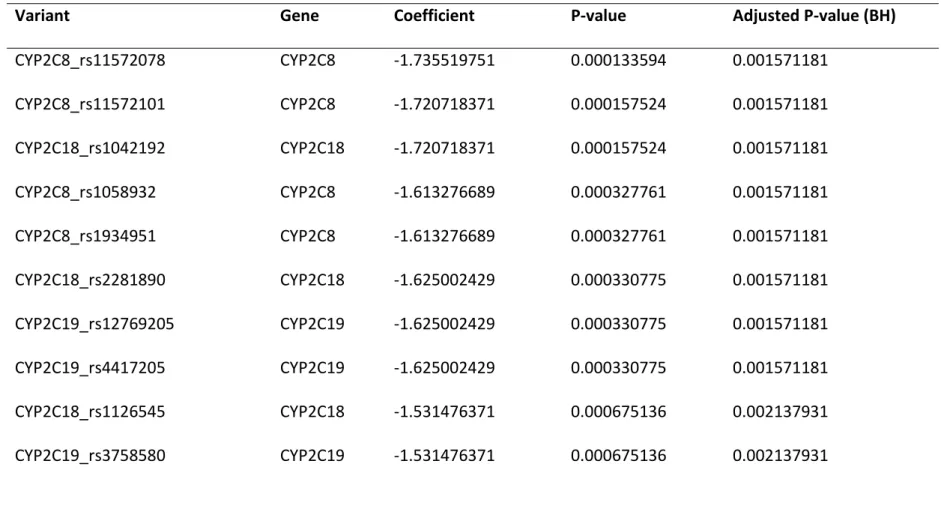
Table 3: Genes with their variants significantly associated with the PR phenotype in the replication cohort. P values are from a logistic
regression performed in the replication cohort exome sequencing dataset and adjusted on the number of different variants (38 variants from four genes).
Variant
Gene
Coefficient
P-value
Adjusted P-value (BH)
CYP2C8_rs11572078
CYP2C8
-1.735519751
0.000133594
0.001571181
CYP2C8_rs11572101
CYP2C8
-1.720718371
0.000157524
0.001571181
CYP2C18_rs1042192
CYP2C18
-1.720718371
0.000157524
0.001571181
CYP2C8_rs1058932
CYP2C8
-1.613276689
0.000327761
0.001571181
CYP2C8_rs1934951
CYP2C8
-1.613276689
0.000327761
0.001571181
CYP2C18_rs2281890
CYP2C18
-1.625002429
0.000330775
0.001571181
CYP2C19_rs12769205
CYP2C19
-1.625002429
0.000330775
0.001571181
CYP2C19_rs4417205
CYP2C19
-1.625002429
0.000330775
0.001571181
CYP2C18_rs1126545
CYP2C18
-1.531476371
0.000675136
0.002137931
CYP2C19_rs3758580
CYP2C19
-1.531476371
0.000675136
0.002137931
27
CYP2C19_rs4244285
CYP2C19
-1.531476371
0.000675136
0.002137931
CYP2C19_rs4986894
CYP2C19
-1.531476371
0.000675136
0.002137931
CYP2C8_rs7098376
CYP2C8
1.272350102
0.003746146
0.010950273
CYP2C8_rs11572093
CYP2C8
1.251688277
0.004050432
0.01099403
CYP2C8_rs1058930
CYP2C8
-2.028535169
0.011324903
0.028689754
NOC3L_rs12572897
NOC3L
-1.137833002
0.014275149
0.033903479
CYP2C18_rs1926706
CYP2C18
-1.239279618
0.019694153
0.044022224
NOC3L_rs3758526
NOC3L
-1.016547336
0.025542856
0.053923807
28
Figure Legends
Figure 1: Manhattan plot of variants in the discovery cohort with their p-value for the association with the platelet reactivity phenotype.
Figure 2: Scatterplot of the first 2 principal components (PCs) from PCA of 585 significantly different variants (HPR vs LPR; p-value [adjusted] < 0.05).
Figure 3: Density of individual scores on the DAPC discriminant function derived from the top 130 variants, with groups represented in red and blue.
Figure 4: Curated network of variant genes for on-treatment high platelet reactivity. Genes and small molecules are represented by nodes and the relationships between them by edges. Node color indicates provenance: Current study (orange), Other study (blue); Node size is proportional to mean –log P (nominal) of genetic association calculated by logistic regression comparing HPR and LPR in discovery and validation cohorts; Edge colour indicates provenance of relationship: Literature curation (blue), STRING (green), literature curation AND STRING (black). Arrowheads indicate activation; circles represent inhibition; No arrowhead or circle indicates unknown relationship.