UNIVERSITÉ DE MONTRÉAL
MICROSTRAINING ACTIFLO® SETTLED WATERS AS A PRETREATMENT FOR UF MEMBRANES
LORETO ARAYA VICENTELO
DÉPARTEMENT DES GÉNIES CIVIL, GÉOLOGIQUE ET DES MINES ÉCOLE POLYTECHNIQUE DE MONTRÉAL
MÉMOIRE PRÉSENTÉ EN VUE DE L’OBTENTION DU DIPLÔME DE MAÎTRISE ÈS SCIENCES APPLIQUÉES
(GÉNIE CIVIL) AOÛT 2016
UNIVERSITÉ DE MONTRÉAL
ÉCOLE POLYTECHNIQUE DE MONTRÉAL
Ce mémoire intitulé :
MICROSTRAINING ACTIFLO® SETTLED WATERS AS A PRETREATMENT FOR UF MEMBRANES
présenté par : ARAYA VICENTELO Loreto
en vue de l’obtention du diplôme de : Maîtrise ès sciences appliquées a été dûment accepté par le jury d’examen constitué de :
M. COMEAU Yves, Ph. D., président
M. BARBEAU Benoit, Ph. D., membre et directeur de recherche M. BÉRARD Jean-François, M.Sc.A., membre
DEDICATION
To my beloved parents and sisters,
ACKNOWLEDGEMENTS
Firstly, I would like to express my appreciation to my research director Dr. Benoit Barbeau, for giving me the opportunity of being one of his students and to work on this project. I will always be grateful for his teaching and priceless advices.
I would also like to thank to the professors Michèle Prévost and Yves Comeau, for sharing their knowledge and experience in the lectures.
I would like to thank to the technical staff at CREDEAU laboratory, for their invaluable professional experience and assistance in the analytical methods and experimental setup implementation: Mireille Blais, Yves Fontaine, Julie Philibert, Jacinthe Mailly, Denis Bouchard, and Melanie Bolduc.
My sincere gratitude goes to Mathieu Lapointe, Evelyne Doré, Sara Kazza and Kim Lompe for offering their time and valuable technical advices.
Thanks to the staff of the Chair on Drinking Water Treatment and Department of CGM, for helping me in different ways: Elise Deshommes, Isabelle Papineau, Valentin Pfeiffer, Laura Razafinjanahary, Shokoufeh Nour, Manon Latour.
Thanks to the students and former students of the Department of CGM, for their company and support: Hadi, Sanaz, Émile, Laura, Celso, Patricia, Oscar, Giovanna, Dominic.
Thanks to Veolia engineers, Edith Laflame and Jean-François Bérard, for their technical support regarding microstrainers and the Actiflo process.
This research project would not have been possible without the cooperation and technical support of the staff of the drinking water treatment facilities of Pont-Viau, Saint-Damase, Lévis, and L’Assomption.
This study was financially supported by NSERC Canada and partners of Industrial Chair on Drinking Water Treatment at École Polyechnique de Montréal.
Thanks to the Comisión Nacional de Investigación Científica y Tecnológica (CONICYT, Chile) for the awarded Postgraduate Master fellowship program.
Finally, thanks to my family, for their support at a long distance, and thanks to Jaime for his caring and comprehension during these past two years.
RÉSUMÉ
Les micro-tamis sont recommandés comme préfiltres pour protéger les membranes à basse pression, soit la microfiltration (MF) ou l'ultrafiltration (UF). Cependant, dans le cas d'un système Actiflo®/UF intégré (procédé Opaline®), le micro-tamis installé entre les deux procédés a présenté des limites opérationnelles, comme une fréquence accrue de rétro-lavages en raison du colmatage rapide des micro-tamis ce qui réduit la productivité. À ce jour, la plupart des études sur la combinaison de la coagulation-floculation avec des membranes d'UF ont ciblées la question de l'encrassement des membranes plutôt que le colmatage des micro-tamis. Par conséquent, l'objectif de ce projet était d'identifier les causes du colmatage des micro-tamis alimentés par un processus Actiflo®. Ceci a été réalisé par (i) la caractérisation des eaux décantées de l’Actiflo® de quatre installations d’eau potable de la province de Québec (Pont-Viau, Saint-Damase, Lévis et L'Assomption); (ii) l’identification des mécanismes d'encrassement des micro-tamis en utilisant le modèle Hermia Unifié et (iii) le développement d’un indice de filtrabilité capables de prédire le taux d'encrassement des micro-tamis. En plus, une évaluation de l'efficacité du rétro-lavage des micro-tamis a été réalisée.
La mise en œuvre d'une installation d'essai de filtrabilité à l'aide de micro-tamis en nylon (100-200 μm) et en acier inoxydable T304 (75-152 μm) en mode dead-end a été réalisée, pour obtenir des courbes de variation de perte de charge à un débit constant (vitesse d’approche 0,08 m/s) qui ont été modélisées avec le modèle d’Hermia Unifié. Le rétro-lavage a été réalisée dans les tamis en acier inoxydable à différentes vitesses de rétro-lavages (0,16-0,35 m/s) sous conditions d'oxydation (jusqu'à 100 mg Cl2/L de chlore à l'aide de NaOCl) et sous conditions alcalines en utilisant du NaOH jusqu’à atteindre un pH de 12,6.
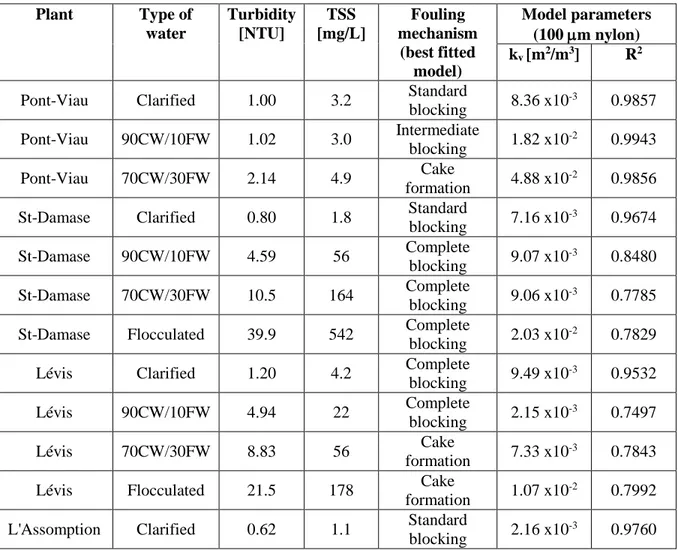
Selon les résultats, l'encrassement des micro-tamis produit par l'eau décantée des Actiflo® peut être représenté avec le modèle Hermia Unifié avec un bon ajustement pour le tamis en nylon (R2 > 0,95) et en acier inoxydable (R2 > 0,97). Pour le tamis en nylon à 100 μm, le blocage standard des pores était le mécanisme d'encrassement dominant produit par trois des quatre eaux décantées, lequel était causé principalement par des petits flocs non lestés, ce qui signifie que l'obstruction des pores par microsable était négligeable. Pour les tamis en en acier inoxydable entre 75 et 103 μm, le blocage standard des pores était aussi l’encrassement dominant produit par de l’eau décantée de Pont-Viau, causée principalement par des flocs lestés dont le microsable a eu un effet important
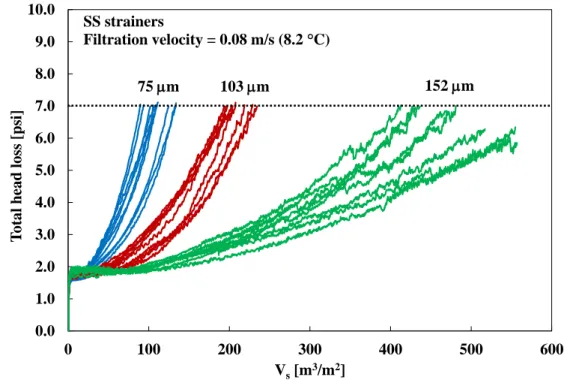
dans le colmatage des pores. Pour le tamis en acier inoxydable à 152 μm, le blocage des pores intermédiaire a été le mécanisme d’encrassement, causé principalement par des flocs non lestés. La concentration des solides en suspension (MES) était le meilleur prédicteur du taux d'encrassement (ou coefficient d’encrassement kv) obtenu à partir de la modélisation. En conclusion, le microsable et le polymère intégrés dans les flocs ont un effet important sur le type de mécanisme d'encrassement des micro-tamis. Pour les micro-tamis à ouvertures inférieures (associées aux valeurs élevées de kv), les flocs lestés ont une grande importance, tandis qu'à tailles d'ouverture plus élevés (associées aux faibles valeurs de kv), ce sont les flocs non lestés qui colmatent. D'autre part, le pH, la vitesse de rétro-lavage et la taille d'ouverture du tamis ont un effet significatif sur l'enlèvement des solides après le rétro-lavage, surtout à un pH élevé (pH >11) lequel a produit l'enlèvement des solides la plus élevée (>80%). Le rétro-lavage avec de l’eau fortement chlorée ne présente pas un effet important sur l'enlèvement des solides (jusqu'à 27%).
Enfin, ce projet de recherche fournit de nouvelles connaissances pour comprendre les mécanismes du colmatage d'une eau décantée d’un processus Actiflo® à micro-tamis, qui pourraient être prises en compte dans l'optimisation de l'opération des Actiflo® et la sélection d'un micro-tamis approprié.
ABSTRACT
Microstrainers has been recommended as a pre-filter to protect low-pressure membranes of microfiltration (MF) or ultrafiltration (UF). However, in the case of an integrated Actiflo®/UF system, the microstrainer installed between the two processes has presented operational limitations, such as increased frequency of backwashing due to fast clogging of microstrainers, which may reduce water productivity. To date, most studies on the combination of coagulation-flocculation with UF membranes have focused on membrane fouling rather than microstrainer clogging. Therefore, the objective of this project was to identify the causes of microstrainers clogging fed by an Actiflo® process. This was carried out by the characterization of the settled waters from Actiflo® of four drinking water treatment facilities of the province of Québec (Pont-Viau, Saint-Damase, Lévis, and L’Assomption); identifying the fouling mechanisms of microstrainers using the Unified Hermia model; and finding water characteristics and a filterability index able to predict the fouling rate on microstrainers. In addition, an evaluation of the backwash efficiency of microstrainers was performed.
The implementation of a filterability test setup using small strainers made of nylon (100-200 μm) and stainless steel T304 (75-152 μm) in dead-end mode was carried out, to obtain head loss variation curves at a constant flow rate (approach velocity 0.08 m/s) that were fitted to the Unified Hermia model. The backwashing was performed in the stainless steel strainers at different backwash velocities (0.16-0.35 m/s) for oxidizing conditions (up to 100 ppm of chlorine using NaOCl) and alkaline conditions using NaOH to reach up to pH 12.6.
According to the results, the fouling at microstrainers produced by the settled water of Actiflo® can be represented with the Unified Hermia model with a good fit for nylon (R2 > 0.95) and stainless steel (R2 > 0.97) strainers. For the 100 μm nylon strainer, the standard pore blocking was the dominant fouling mechanism produced by three out of four settled waters, caused mainly by small un-ballasted flocs, which means that pore clogging by microsand was negligible. For 75 and 103 μm SS strainers, the standard pore blocking was also the dominant fouling produced by Pont-Viau settled water, caused mainly by ballasted flocs, where microsand has an important effect in pore clogging. For the 152 m SS strainer, was the intermediate pore blocking, caused mainly by un-ballasted flocs agglomeration. The total suspended solids concentration was the best predictor of the fouling coefficient (kv) obtained from modeling. In conclusion, both microsand and polymer,
integrated into the flocs, have an important effect on the type of fouling mechanism at microstrainers. The fouling coefficient is sensitive to the strainer opening size, which means finer opening sizes are associated with high kv values (mainly caused by small ballasted flocs), while larger opening sizes are associated with low kv values (mainly caused by un-ballasted flocs). On the other hand, the pH, backwash velocity and strainer opening size have a significant effect on solids removal after backwashing. Especially pH under strong alkaline conditions (pH >11) which yielded the highest solids removal (>80%). The backwashing under oxidizing conditions did not present a significant effect on solids removal (up to 27%).
Finally, this research project provides new knowledge to understand the fouling mechanisms of a settled water from the Actiflo® process at microstrainers, which might be considered in the optimization of the Actiflo® operation and the selection of a proper microstrainer.
TABLE OF CONTENTS
DEDICATION ... III ACKNOWLEDGEMENTS ... IV RÉSUMÉ ... V ABSTRACT ...VII TABLE OF CONTENTS ... IX LIST OF TABLES ...XII LIST OF FIGURES ... XIII LIST OF SYMBOLS AND ABBREVIATIONS... XV LIST OF APPENDICES ... XVIICHAPTER 1 INTRODUCTION ... 1 1.1 Background ... 1 1.2 Objectives ... 1 1.2.1 General objective ... 1 1.2.2 Specific objectives ... 2 1.2.3 Research hypothesis ... 2
1.3 Structure of the thesis ... 2
CHAPTER 2 LITERATURE REVIEW ... 3
2.1 Ballasted flocculation/clarification: Actiflo® ... 3
2.1.1 Presentation of the technology ... 3
2.1.2 Main operational parameters for the Actiflo® ... 4
2.1.3 UF membranes applications with Actiflo®... 5
2.2 Use of polymers in water treatment ... 6
2.2.2 Residual polymer in water and its impact on downstream processes ... 8
2.2.3 Adsorption of polymers on surfaces... 10
2.3 Prefiltration with microstrainers ... 11
2.3.1 Type of microstrainers and design criteria ... 12
2.3.2 Backwashing ... 13
2.3.3 Required specifications of MF/UF membranes manufacturers for the selection of microstrainers ... 14
2.4 Filtration fouling behavior: Unified Hermia model ... 14
2.4.1 Complete pore blocking ... 16
2.4.2 Intermediate pore blocking ... 16
2.4.3 Standard pore blocking ... 17
2.4.4 Cake layer formation ... 17
2.5 Conclusions of the literature review ... 18
CHAPTER 3 MATERIALS AND METHODS ... 19
3.1 Sampling sites and type of water ... 19
3.2 Characterization methods of water samples ... 20
3.3 Filterability tests ... 21
3.3.1 Filterability on microstrainers ... 21
3.3.2 Filterability on a 0.45 μm membrane filter ... 22
3.4 Backwashing tests ... 23
3.5 Data analysis ... 24
3.6 Characterization of clogging on strainers ... 24
CHAPTER 4 RESULTS AND DISCUSSION ... 25
4.1 Settled water characteristics ... 25
4.3 Impact of water quality on fouling ... 33
4.3.1 Evaluation of fouling mechanisms ... 33
4.3.2 Prediction of fouling coefficients (kv) based on water quality ... 38
4.3.3 Filterability index as fouling predictor ... 41
4.4 Impact of design/operating conditions on fouling... 42
4.4.1 Strainer material ... 42
4.4.2 Pore opening size ... 43
4.4.3 Effective velocity ... 44
4.5 Impact of operating conditions on backwashing ... 45
4.5.1 Pore opening size ... 47
4.5.2 Backwash velocity ... 47
4.5.3 Effect of pH ... 49
4.6 Water consumption for backwashing ... 51
4.7 Infrared spectrum of polymer ... 52
CHAPTER 5 CONCLUSIONS AND RECOMMENDATIONS... 57
BIBLIOGRAPHY ... 60
LIST OF TABLES
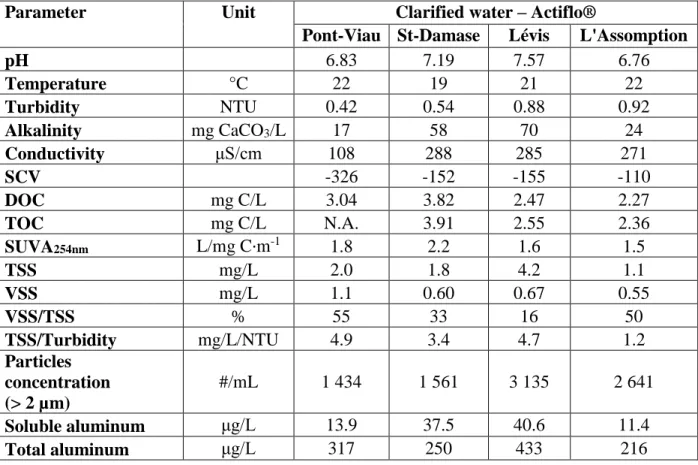
Table 2.1: Analytical techniques to determine acrylamide (WHO, 2011) ... 9 Table 2.2: Required microstrainers opening sizes of MF/UF membranes technologies ... 14 Table 2.3: Linear equations based on Unified Hermia model (adapted from Huang et al. (2008)) ... 16 Table 3.1: Actiflo® operational conditions of four drinking water facilities ... 20 Table 4.1: Clarified water characterization of various drinking water facilities with Actiflo® .... 26 Table 4.2: Fouling mechanisms determined with the Unified Hermia model for various water
qualities on a 100 m nylon strainer ... 34 Table 4.3: Fouling mechanisms determined with the Unified Hermia model for clarified water
(Pont-Viau) on SS strainers ... 36 Table 4.4: Effective velocity according to microstrainer open area ... 44 Table 4.5: Normalized Reynolds number (Red/) at various BW velocities through SS strainers 49 Table 4.6: BW water consumption regarding the produced water using SS strainers ... 52
LIST OF FIGURES
Figure 2.1: Actiflo® process (adapted from Jeschke and Hansen (1999)) ... 4
Figure 2.2: Cationic polyacrylamide (adapted from Bolto and Gregory (2007)) ... 7
Figure 2.3: Anionic polyacrylamide (adapted from Bolto and Gregory (2007)) ... 8
Figure 2.4: Complete pore blocking type of fouling (adapted from Huang et al. (2008)) ... 16
Figure 2.5: Intermediate pore blocking type of fouling (adapted from Huang et al. (2008)) ... 17
Figure 2.6: Standard pore blocking type of fouling (adapted from Huang et al. (2008)) ... 17
Figure 2.7: Cake layer formation (adapted from Huang et al. (2008)) ... 18
Figure 3.1: Schematic diagram of the filterability test on microstrainers ... 22
Figure 4.1: Pressure variation during filterability of various clarified waters using a 100 m nylon strainer ... 28
Figure 4.2: Pressure variation during filterability of various clarified waters using a 200 m nylon strainer. It includes image of 200 m strainer after filterability of Lévis clarified water ... 29
Figure 4.3: Pressure variation during filterability of a mixed water (90% = CW, 10% = FW) ... 30
Figure 4.4: Pressure variation during filterability of a mixed water (70% = CW, 30% = FW) ... 30
Figure 4.5: Pressure variation during filterability of 100% flocculated waters using 100 m nylon strainer ... 31
Figure 4.6: Replicates of pressure variation during filterability of clarified water on site (Pont-Viau) using different SS strainer opening sizes. 75 m (blue), 103 m (red) and 152 m (green) 32 Figure 4.7: 100 m nylon strainers clogged with clarified water from: (a) Pont-Viau, (b), Saint-Damase, (c) Lévis, and (d) L’Assomption. ... 35
Figure 4.8: SS strainers clogged with clarified water (Pont-Viau) represented by: (a) standard blocking on 75 μm (F9), (b) standard blocking on 103 μm (F12), and (c) intermediate blocking on 152 μm (F31). ... 37
Figure 4.9: Total suspended solids (TSS) and turbidity effect on fouling coefficient (kv) predicted
by a standard pore blocking model for a 103 m SS strainer ... 38
Figure 4.10: Particle concentration effect on fouling coefficient (kv) predicted by a standard pore blocking model for a 103 m SS strainer ... 39
Figure 4.11: TSS and turbidity effect on fouling coefficient (kv) predicted by a complete pore blocking model for a 100 m nylon strainer ... 40
Figure 4.12: Effect on fouling coefficient (kv) prediction by retained solids on SS strainers per filtered volume ... 41
Figure 4.13: Filterability index on fouling coefficient (kv) prediction ... 42
Figure 4.14: Fouling coefficient (kv) values according to SS strainer opening size. T= 8.2 °C .... 44
Figure 4.15: Interaction effect of strainer opening size and BW velocity on solids removal ... 45
Figure 4.16: Interaction effect of strainer opening size and pH on solids removal ... 46
Figure 4.17: Interaction effect of BW velocity and pH on solids removal ... 46
Figure 4.18: Solids removal after backwashing according to strainer opening size ... 47
Figure 4.19: Solids removal after backwashing according to backwash velocity ... 48
Figure 4.20: Solids removal after backwashing according to pH ... 50
Figure 4.21: Effect of pH after the first backwash cycle on 75 m SS strainer. (a) pH 5.9 and (b) pH 12.6 ... 50
Figure 4.22: Filterability test performance after various backwashing cycles ... 51
Figure 4.23: IR spectra of pure dry APAM and 75 m SS strainers. (A) Clogged strainer, (B) strainer after BW at pH 5.9, (C) strainer after BW at pH 12.6, and (D) clean strainer ... 54
Figure 4.24: IR spectra of pure dry APAM and 103 m SS strainers. (A) Clogged strainer, (B) strainer after BW at pH 5.9, (C) strainer after BW at pH 12.6, and (D) clean strainer ... 55
Figure 4.25: IR spectra of pure dry APAM and 152 m SS strainers. (A) Clogged strainer, (B) strainer after BW at pH 5.9, (C) strainer after BW at pH 12.6, and (D) clean strainer ... 56
LIST OF SYMBOLS AND ABBREVIATIONS
APAM Anionic polyacrylamide Open area of strainers
BW Backwashing
CPAM Cationic polyacrylamide CW Clarified water
ΔP Head loss or differential pressure DADMAC Diallyldimethylammonium chloride DOC Dissolved organic carbon
DW Demineralized water
FTIR Fourier Transform Infrared spectroscopy
FW Flocculated water
kv Fouling coefficient
MDDELCC Ministère du Développement durable, de l’Environnement et de la Lutte contre les changements climatiques
MF Microfiltration
MW Molecular weight
NOM Natural organic matter
PAM Polyacrylamide
PDADMAC Poly(diallyldimethylammonium chloride) PVDF Polyvinylidene fluoride
Red Reynolds number based on wire diameter SCV Streaming current value
SS Stainless steel TOC Total organic carbon TSS Total suspended solids UF Ultrafiltration
UV Ultraviolet
LIST OF APPENDICES
Appendix A – Experimental setup of filterability tests using microstrainers ... 65
Appendix B – Operational data of Pont-Viau Actiflo® during filterablity test on site ... 66
Appendix C – Characterization of flocculated water of different Actiflo®... 67
Appendix D – Characterization of clarified water in filterability tests for each SS strainer ... 68
Appendix E – Normal probability plot of fouling coefficients ... 69
Appendix F – Factorial ANOVA under alkaline conditions (pH ≥ 11) ... 70
Appendix G – Main effects ANOVA of backwashing factors (under oxidizing and alkaline conditions) ... 71
CHAPTER 1
INTRODUCTION
1.1 Background
The interest in using low-pressure membrane processes as an alternative filtration method to replace granular media filters, i.e. sand or sand-anthracite filters, has been increased in drinking water treatment plants, to improve the barrier against colloids, suspended solid, and pathogens, and also to continuously produce good quality water with low energy consumption (Brehant, Bonnelye, & Perez, 2002; Lee, 2000). The low-pressure membranes such as microfiltration (MF) or ultrafiltration (UF) require a pretreatment of the feed water by using microstrainers, in order to remove larger particles able to accelerate membrane fouling and/or plug fiber flow channels. The opening sizes of microstrainers recommended by UF manufacturers ranged between 25 and 1000 μm (MDDELCC, 2015b).
The use of UF membranes downstream of a ballasted flocculation/clarification process (Actiflo®) has been commercialized by Veolia Water Technologies. One operational challenge faced with this application is the excessive clogging of microstrainers possibly due to the export of microsand and/or the residual polymer in settled water. Fast clogging of microstrainers generates repeated sequences of backwash that may reduce water productivity. To date, most studies on the combination of coagulation-flocculation with UF membranes have focused on membrane fouling rather than microstrainer clogging. In this project, the study of the phenomenon of microstrainers clogging as they are fed by Actiflo® settled waters was proposed.
1.2 Objectives
1.2.1 General objective
The purpose of this project is identify the causes of microstrainers clogging fed by an Actiflo® process. In order to accomplish this main goal, the following specific objectives were proposed.
1.2.2 Specific objectives
1. Characterize clarified and flocculated waters collected from four full-scale Actiflo® processes;
2. Identify the clogging mechanisms of microstrainers using the Unified Hermia models; 3. Predict the fouling rate using water characteristics and a filterability index;
4. Evaluate the backwash efficiency of microstrainers.
1.2.3 Research hypothesis
The objectives mentioned above led to verify the following research hypothesis:
The pore clogging behavior on microstrainers downstream Actiflo® process is represented by the Unified Hermia model.
The clogging on microstrainers is caused mainly by the residual polymer rather than microsand export.
The backwash performance of microstrainers is enhanced by alkaline rather than oxidizing conditions.
1.3 Structure of the thesis
Chapter 1 presents a brief introduction and objectives of this research project. Chapter 2 presents a literature review about the Actiflo® process and its application with UF membranes, the action of polymer in water treatment, the prefiltration with microstrainers, and the filtration fouling mechanisms. Chapter 3 explains the methodology used to carry out the specific objectives. Chapter 4 presents the results obtained and discussion. Finally, Chapter 5 presents the conclusions of this thesis.
CHAPTER 2
LITERATURE REVIEW
2.1 Ballasted flocculation/clarification: Actiflo®
The ballasted flocculation/clarification process is commercialized under the name Actiflo® by Veolia Water Technologies. In the following sections, a description of the Actiflo® process and its application in combination with UF membranes will be presented.
2.1.1 Presentation of the technology
Actiflo® is a water treatment technology, which includes in one compact unit the coagulation, flocculation, maturation, and settling steps (Figure 2.1). In the coagulation tank, the addition of coagulant destabilizes the suspended solids and colloidal matter in the influent stream. The water then flows into the injection (or pre-flocculation) tank were polymer and microsand (used as ballast agent) are added to initiate the flocs formation. Next, the water flows through the maturation tank, where a relatively gentle mixing provides ideal conditions for bridging between the microsand, the polymer and the destabilized particles, producing denser flocs than conventional precipitation systems, which increases its settling velocity in the inclined lamella settling tank. The clarified water passes lamellas and is collected into a series of weirs leaving the unit to a downstream filtration treatment. The settled microsand-sludge floc is pumped from the bottom of the settler to a hydrocyclone where the microsand is separated from the flocs and reinjected into the Actiflo® for reuse (Blumenschein, Latker, & Banerjee, 2006; Plum et al., 1998). Typically, 80% of the recycle flow is wasted (sludge) and 20% is pumped back into the injection tank with the microsand (ECO:LOGIC, 2009). Nowadays, the Actiflo® technology is considered validated at full-scale in the province of Québec according to the Guide de conception des installation de production d’eau potable (MDDELCC, 2015a).
Figure 2.1: Actiflo® process (adapted from Jeschke and Hansen (1999))
2.1.2 Main operational parameters for the Actiflo®
The main control parameters to be considered in the operation of an Actiflo® include the coagulant type and dose, polymer type and dose (anionic, cationic or non-ionic), concentration of microsand in the maturation tank, the microsand diameter and the upflow velocity in the settling step. The Actiflo® settling process can operate with an upflow velocity ranged between 40 to 85 m/h for drinking water applications (Veolia Water Technologies, 2015).
Among the most common coagulants are aluminium sulfate (alum), ferric chloride, ferric sulphate, polyaluminium silicate sulfate (PASS) and polyaluminium chloride (PACl) (Blumenschein et al., 2006; MDDELCC, 2015a). The optimal coagulant dosage will depend of the quality of the water to be treated, e.g., pH, alkalinity, total suspended solids, etc. (R. Desjardins, 1997; MDDELCC, 2015a). In the case of organic polymers used as coagulant in drinking water treatment, typical doses are 1 – 10 mg/L (Bolto & Gregory, 2007) but they are not used in the Actiflo®. Instead, the process uses organic polymers with medium and high molecular weight (typically polyacrylamide or PAM) for improved flocculation. The activated silica can also be used as coagulant aid or flocculant (MDDELCC, 2015a) in the Actiflo® but is typically dosed in combination with PAM. For drinking water treatment, typical doses for organic polymers used as coagulant aids are 0.1 – 0.2 mg/L (Bolto & Gregory, 2007). Nevertheless, the polymer dosage, which is typically slightly higher in
Actiflo® (about 0.3 mg/L), and type will have an important impact on turbidity removal (Blumenschein et al., 2006).
The typical microsand concentration in the maturation tank ranged between 2 to 5 g/L (C. Desjardins et al., 2002; Jeschke & Hansen, 1999). Additionally, it is important to consider that the turbidity of the settled water would increase slightly with increasing concentrations of microsand due to the inability of the floc to hold greater amounts of the ballasting agent, this suggests to find an optimal dose of microsand for each mix of coagulant, polymer dose and source water (Young & Edwards, 2003). On the other hand, the typical effective diameter (d10) of the microsand can range between 50 to 150 μm with a specific gravity of 2.65 (Blumenschein et al., 2006; MDDELCC, 2009). According to Young and Edwards (2003), there are some effects at different sizes of microsand, a significant amount of a larger-size microsand (210 – 300 μm) settled rapidly without being incorporated to the floc. Recently, Lapointe and Barbeau (2016) have shown that the optimal microsand size depends on the final flocs size: large flocs can integrate larger sand grains. Veolia commercializes two microsand sizes to reflect on this observation. The larger media is typically used in wastewater applications while the smaller one is proposed for drinking water applications where the lower coagulant dosages and lower initial suspended solid concentrations lead to small floc sizes (Lapointe & Barbeau, 2016).
2.1.3 UF membranes applications with Actiflo®
It has been reported that some facilities have installed membrane filtration (UF or MF) downstream of the Actiflo® process (Layson, 2010; Lefrançois, 2015). Under such scenario, a microstrainer is installed after settling, prior to the membranes. The microstrainer opening size will vary depending on the membrane technologies. Due to the concerns related to the export of microsand from the Actiflo®, some facilities include microstrainers with low opening sizes (75 – 200 µm) and have subsequently experienced rapid fouling of the microstrainers. In addition, there has also been concern over the impact of residual polymer from the Actiflo® unit on the UF membrane fouling (Lee, 2000). In this study, the use of an anionic polymer at lower dosages ( 0.117 mg/L) was suggested. In other study about an integrated Actiflo®/MF system (Layson, 2010), it was recommended to prevent overdosing of polymer (>0.3 mg/L) since it will result in large amounts of unreacted polymer leaving the Actiflo® and subsequent membrane fouling. Likewise, the excess of polymer will promote the retention of microsand within membranes, increasing their abrasion.
Therefore, the control of microsand carryover and excess of polymer has taken a major importance in an integrated Actiflo®/membrane system, mainly its impact in useful life of membranes.
2.2 Use of polymers in water treatment
According to Kronberg, Holmberg, and Lindman (2014), a polymer is a large molecule built up of smaller chemical units called monomers and it can have a linear, branched, or cross-linked configuration. When the polymer is synthesized with only one type of monomer, it is termed homopolymer. If the polymer is synthesized with more than one type of monomer, it is termed copolymer. Moreover, the polymers that carry a high net charge are sometimes called polyelectrolytes.
The polymers commonly used in drinking water treatment plants are characterised by their ionic nature: cationic, anionic, and non-ionic. According to their use in coagulation or flocculation, there are other important parameters to be considered in the selection of polymers such as the molecular weight (MW) and charge density (Bolto & Gregory, 2007). Regarding their MW values, can be classified as low (<105), medium (105 - 106), and high (>106). The charge density can be expressed as a percentage of ionic groups relative to all the groups in the polymer (mol%) or as milliequivalents per gram (meq/g). It can be classified as low (ca. 10 mol%), medium (ca. 25 mol%), or high (50 - 100 mol%).
The following sections will focus on cationic and anionic polymers, their adsorption on surfaces and their residual occurrence in water after settling and the resulting impacts on downstream filtration processes.
2.2.1 Cationic and anionic polymers
Cationic and anionic polymers have been generally used in Actiflo® process (Blumenschein et al., 2006; Lee, 2000). The characteristics of both types of polymer are explained below.
2.2.1.1 Cationic polymers
Usually, cationic polymers contain quaternary ammonium groups that have a formal positive charge irrespective of pH, which means that are strong polyelectrolytes (Bolto & Gregory, 2007). Among these polymers, cationic polyacrylamide (CPAM) is widely used in water treatment. It can be used as coagulant (if it has a high charge density) or coagulant aid (if it has a low charge density
and high MW). It can be prepared by copolymerization of acrylamide (CH2CHCONH2) with a cationic monomer, such as diallyldimethylammonium chloride (DADMAC) (Gregory & Barany, 2011). The molecular structure of CPAM is represented in Figure 2.2. The cationic content in the CPAMs can range between 10 to 100 mol%. Moreover, the hydrolysis of ester groups (RCOOR’) and consequent loss of cationic charge of CPAMs has been found to be charge density and pH dependent, thus hydrolysis of CPAMs is promoted under more alkaline conditions (Bolto & Gregory, 2007).
Figure 2.2: Cationic polyacrylamide (adapted from Bolto and Gregory (2007))
Among the natural cationic polymers, the most prominent is chitosan, which has a medium MW and charge density that is pH dependent (e.g., it is slightly charge (17%) at neutral pH levels). On the other hand, starch has a medium MW and the charge density can be low or medium (Bolto & Gregory, 2007).
2.2.1.2 Anionic polymers
Generally, anionic and non-ionic polymers are used in flocculation. The anionic polymers with high MW (106 - 1012) allow to start floc formation and also contribute to their growth (Baudin & Fabre, 2006). The most commonly used anionic polymers contain weakly acidic carboxylic acid groups (RCOOH), thus the charge density depends on pH (Bolto & Gregory, 2007). Some anionic polymers are anionic polyacrylamide (APAM)1, polyacrylic acid (PAA), polyvinyl sulfate, natural biopolymers, etc.
According to Bolto and Gregory (2007), APAM can be prepared either by copolymerisation of acrylamide and acrylic acid or its salts, or by polymerisation of acrylamide (PAM) followed by
1 APAM is also named as partially hydrolyzed polyacrylamide (HPAM).
n m
C=O C=O
partial hydrolysis of amide groups (–CONH2). The charge density of APAM ranged from 10 to 100 mol%. The molecular structure of APAM is presented in Figure 2.3.
Figure 2.3: Anionic polyacrylamide (adapted from Bolto and Gregory (2007))
APAM and PAM degradation through hydrolysis of its amide groups has been studied (Ma, Shuler, Aften, & Tang, 2015). This hydrolysis can occur under all pH conditions. Both basic and acidic conditions produce a faster hydrolysis than neutral conditions. The reactions of the three mechanisms mentioned before are shown below.
At neutral conditions: 𝑅– 𝐶𝑂𝑁𝐻2+ 𝐻2𝑂 → 𝑅– 𝐶𝑂𝑂𝐻 + 𝑁𝐻3 (1) At strong basic conditions: 𝑅– 𝐶𝑂𝑁𝐻2+ 𝑂𝐻−→ 𝑅– 𝐶𝑂𝑂−+ 𝑁𝐻3 (2) At acidic conditions: 𝑅– 𝐶𝑂𝑁𝐻2+ 𝐻3𝑂+ → 𝑅– 𝐶𝑂𝑂𝐻 + 𝑁𝐻
4+ (3) Ma et al. (2015) also indicate that divalent cations (e.g. Ca2+ or Mg2+) at higher concentrations not only can form complexes with the carboxylic groups (–COO-) on APAM, but also they can catalyze the amide hydrolysis increasing the degree of APAM hydrolysis.
2.2.2 Residual polymer in water and its impact on downstream processes
Firstly, it is important to mention the polymer toxicity in drinking water treatment. In the case of anionic and non-ionic polymers are considered, generally, to have low aquatic toxicity. However, cationic organic polymers are considered to be more toxic to aquatic organisms and, therefore, some countries have restricted their use in drinking water treatment such as Germany and France, while in Japan and Switzerland their use is not allowed (Bolto & Gregory, 2007).
According to the World Health Organization (WHO, 2011), some polymers residues or monomers may escape in finished drinking water, which can pose a potential hazard to human health. This is especially the case for the residual acrylamide monomer of PAMs, which is considered as
n m
C=O C=O NH2 O
-“probably carcinogenic to humans”. The monomer content is generally 0.05% of the polymer dosage added in water. Considering that in drinking water treatment, the maximum authorized dose of polymer is typically 1 mg/L (it varies from one polymer to another), this suggests a maximum theoretical acrylamide monomer concentration of 0.5 μg/L. Practical concentrations of the residual monomer of the anionic and non-ionic PAM may be lower by a factor of 2 or 3, since acrylamide concentrations are usually controlled by limiting either the acrylamide content of PAM flocculants or the dose of polymer used. Therefore, it is important to avoid overdosing polymer.
Detection of trace acrylamide monomer in water is challenging. Some of the existing analytical techniques to detect acrylamide are summarized in Table 2.1. Determination methods of residual PDADMAC and Epi/DMA polymers, have also been studied (Majam & Thompson, 2006; Mwangi, Ngila, Ndungu, & Msagati, 2013).
Table 2.1: Analytical techniques to determine acrylamide (WHO, 2011) Analytical technique Detection limit [μg/L]
Gas chromatography (GC/ECD) 0.032
High-performance liquid chromatography (HPLC) 0.2
HPLC with ultraviolet (UV) detection 10
Polymers and their residual contaminants may also react with chemicals added in downstream water treatment processes such as ozonation and chlorination to form undesirable by-products (Majam & Thompson, 2006). The formation of disinfection by-products has been studied following post-chlorination in the presence of cationic, anionic, and non-ionic polymers (Bolto, 2005). The reaction of chlorine with cationic polymers such as PDADMAC or CPAM, at normal residual polymer concentration, produced in general an insignificant level of trihalomethanes (THM) even though the residual acrylamide monomer of CPAM could theoretically be a major THM precursor. In the case of APAM and PAM reaction with chlorine, they also did not form significance levels of THMs.
The degradation of PAM by advanced oxidation (O3/H2O2/UV) has also been studied (Ren, Sun, & Chung, 2006). This study indicates that under increasing ozone dosages, more PAMs were
oxidized, where PAM reacted with the formed hydroxyl free radicals (·OH), producing intermediates or final by-products.
2.2.3 Adsorption of polymers on surfaces
The adsorption affinity of polymer to surfaces can be explained by interactions such as electrostatic attraction, hydrogen bonding, hydrophobic interaction, and ion binding. The electrostatic attraction describes the adsorption of polyelectrolytes on surfaces of opposite charge, which gives a very high adsorption affinity and can produce a flatter adsorbed configuration of the polymer, especially with highly charge polyelectrolytes. In the case of hydrogen bonding, the adsorption of a polymer occurs on surfaces with suitable H-bonding sites (e.g. silanol groups on silica) which, for example, can form bonds with the amide groups (–CONH2) of PAM. On the other hand, the hydrophobic interaction is represented by adsorption of non-polar segments of polymer chains on hydrophobic surfaces. Finally, the adsorption by ion binding is promoted at certain concentration of salts with divalent cations such as calcium (Ca2+) and magnesium (Mg2+) (Gregory & Barany, 2011). The amount of a polyelectrolyte adsorbed on a given charged surface at equilibrium depends on the charge density of both polymer and the surface, the concentration and solubility of the polymer, the chemical affinity of the polymer to the surface and the ionic strength. Moreover, pH can have influence on the polymer and the surface charge, and also the ionic strength (Solberg & Wågberg, 2003). On the other hand, Kronberg et al. (2014) indicates that high MW polymers are more susceptible to adsorb than low MW polymers, and also that a lower solubility of polymers promotes a higher adsorption on surfaces.
In the case of CPAM adsorption on negatively charged silica surfaces, the adsorption and film thickness of the polymer increases as the ionic strength of the solution increases. Although a non-electrostatic interaction have been found between silica and CPAM (Solberg & Wågberg, 2003). In another study, the adsorbed amount of CPAM on silica seems to be independent of the charge density, although when the charge density reaches 10% the presence of hydrophobic segments seems to reduce the amount adsorbed (Samoshina, Diaz, Becker, Nylander, & Lindman, 2003). In addition, decreasing pH can considerably reduce the adsorption of cationic polymers on silica, because the negative charge of the silica is reduced as well (Gregory & Barany, 2011; Kronberg et al., 2014).
APAM adsorption on negative silica surface has also been studied (Samoshina et al., 2003), in which they found that only a small amount of the polymer was adsorbed. Therefore, adsorption of anionic polymers on negative surfaces may require a certain concentration of divalent metal ions, which can bind quite strongly to carboxylate groups (–COO-) of anionic polymers and act as links between these groups and negative sites on a particle surface. Thus, a higher ionic strength (at a certain optimum value) would enhance flocculation (Bolto & Gregory, 2007; Gregory & Barany, 2011). However, flocculation by APAM can be negatively affected in the presence of multivalent metal ions such as Fe3+ due to complexation of the metal with carboxylate groups on the polymer chain, decreasing its charge density (Bolto & Gregory, 2007).
According to Guezennec et al. (2015), by increasing temperature the adsorption of APAM on clay surfaces (e.g. kaolinite) will increase. This effect of temperature has the same result for APAM adsorption on PVDF UF membranes (Yi et al., 2012; Yi et al., 2011). On the other hand, according to Kronberg et al. (2014), it is possible to produce the desorption of a polymer from a surface by three different methods. The first one is to add a second component that has a strong affinity with the surface and thus displaces the polymer from the surface. The second method is by manipulating the driving force for adsorption (e.g. counterions), which it is applied for weakly charged polymers subjected to solutions at higher salt concentrations (or ionic strength). The third method is to alter the solubility of the polymer, by changing the pH or by adding a surfactant that associates with the polymer.
2.3 Prefiltration with microstrainers
According to MDDELCC (2015b), UF membranes technologies require a pre-treatment of the feed water by using microstrainers to protect the hollow fibers from damage or fouling from large particles. The microstrainers are mechanical filters that generally include a woven stainless steel screen, which are able to remove particles as fine as 1 μm. However, microstrainers used ahead of UF/MF systems have opening sizes higher than 200 µm typically. Among the advantage of this process are the operational simplicity, small footprint, low complexity in piping and valving (AMIAD Water Systems, 1998). However, one of the main limitations to its use is its tendency to clog rapidly, which may then requires frequent cleaning (AMIAD Water Systems, 2005).
The following sub-sections will focus on the types of microstrainers available and their design criteria, the backwash applied, and the required specifications of microstrainers intended for MF/UF membrane applications.
2.3.1 Type of microstrainers and design criteria
The type of microstrainers include the single basket strainer, duplex or multi-basket strainer, and self-cleaning strainer. Single basket-type strainers have large filtration areas and provide a greater dirt-holding capacity; however, its cleaning requires shutting down the process flow. The duplex or multi-basket strainers can be used for a continuous operation, allowing one of the elements to be on stand-by for cleaning while the other is on duty, although, they must still be watched to check for the need to swap baskets. On the other hand, self-cleaning strainers are an alternative to duplex or multi-basket strainers where continuous operation is critical in the system or where the processes are automated (Sutherland, 2008). Moreover, there are some self-cleaning strainers that include a candle element, which consists of several candle filters connected in parallel, instead of a basket element (BOLLFILTER Protection Systems, 2015).
Microstrainers can be designed with different types of wire mesh such as the wedge-wire and the weave-wire. The latter can have the plain square weave, plain twilled weave, Dutch weave, twilled Dutch weave, or duplex Dutch weave, among others configurations (AMIAD Water Systems, 2005; BOLLFILTER Protection Systems, 2015; Loff, 2001). The most frequently used material is stainless steel (type 304 or 316).
According to AMIAD Water Systems (1998), the design criteria required for the selection of a suitable microstrainer include data such as type of water source, particle size distribution, total suspended solids, minimum and maximum flow rates, system pressure, and nature of solids (i.e. if they are easily breakable or highly charged to promote re-agglomeration downstream of the strainer).
Furthermore, AMIAD Water Systems (2005) indicates that one of the most important parameter to be considered in a microstrainer design is its effective filtration area. The effective filtration area is the total area exposed to fluid flow and it is useful for the filtration process, it does not include the area of the strainer wires. There is another parameter associated with this definition, which is
the open area. The open area refers to the pore area through which the fluid can pass and it is often expressed as a percentage of the effective filtration area.
2.3.2 Backwashing
The single and multi-basket type strainers need to be off-line of the system to be rinsed. The filter element is removed from the strainer chamber, and then is rinsed with water or cleaning solution in a reverse direction from normal flow (AMIAD Water Systems, 2005).
The cleaning procedure of automatic self-cleaning strainers varies according to the different types and models. For example, cleaning by a high velocity suction stream through nozzles connected to a central tube that rotates while removing the filter cake from the strainer is called “suction scanning” (AMIAD Water Systems, 2005). In the case of self-cleaning strainers with candles elements, the cleaning process consists of axial and cross-flow backwash given that the filter candles are open at both ends (BOLLFILTER Protection Systems, 2015).
The backwashing system of automatic self-cleaning strainers can be triggered by either differential pressure or time control (BOLLFILTER Protection Systems, 2015). The maximum differential pressure required to activate the backwashing is generally 7 psig (AMIAD Water Systems, 2005). The backwashing types mentioned above are hydraulic procedures. Despite those cleaning procedures, the strainers may not reach its initial cleaning condition. Therefore, it can be necessary to use chemical reagents such as alkaline cleaners containing sodium hydroxide (NaOH) or potassium hydroxide (KOH), which are effective against organics and proteins by solubilizing them; or acidic cleaners (pH 1.5 – 2.8) such as phosphoric acid or citric acid which are specially used against inorganic salt/metal fouling. However, hydrochloric acid (HCl) should be avoided because it is very corrosive, especially with stainless steel components. Chlorine is also recommended but its pH should be alkaline (pH 10-11) to minimize corrosion, and it works by a combination of hydrolysis (due to the high pH) and oxidation of organic compounds (Cheryan, 1998).
2.3.3 Required specifications of MF/UF membranes manufacturers for the
selection of microstrainers
According to MDDELCC (2015b), the different MF/UF membranes technologies require an upstream microstrainer with opening sizes ranging between 25 and 1 000 μm as it is summarized in Table 2.2. The opening size of the microstrainer varies depending on the type of membrane filtration system and the feed water quality. Furthermore, hollow fiber MF/UF membranes that operate in an inside-out mode are more susceptible to fiber plugging and thus may require a finer prefiltration ranging between 100 to 300 μm (EPA, 2005). This also corresponds to what has been found in some studies, where 200 μm is the most common microstrainer opening size used upstream UF membranes (Brehant et al., 2002; O'Brien, 2006).
Table 2.2: Required microstrainers opening sizes of MF/UF membranes technologies MF/UF technology products Microstrainer
opening size [μm]
Pall Microza hollow fiber MF (Pall Canada) up to 400
UF-H2O Toray (H2O Innovation) 25 to 150
Pentair X-Flow SXL-225 (Veolia Water Technologies Canada) 200 to 500 ZeeWeed® 1500 (GE Water & Process Technologies) up to 500 ZeeWeed® 1000 (GE Water & Process Technologies) 500 to 1 000
2.4 Filtration fouling behavior: Unified Hermia model
The “blocking filtration laws” help to visualize and understand the fouling mechanism or behavior of a particle arriving at the surface of a filter medium (Wakeman & Tarleton, 2005). The original Hermia model, which describes the “blocking filtration laws” for Newtonian and non-Newtonian fluids (Cheng, Lee, & Lai, 2011), is expressed by the following general equation at constant pressure filtration (Huang, Young, & Jacangelo, 2008):
𝑑2𝑡 𝑑𝑉2
= 𝑘 (
𝑑𝑡 𝑑𝑉)
𝑛 (4)Where,
V = cumulative volume filtered [m3] t = filtration time [s]
n = dimensionless parameter that is related to fouling mechanisms k = constant parameter
As was mentioned above, the Hermia model is only limited for constant pressure filtration. Thus, a new model was developed to be applied for a constant flux filtration, which is called Unified Hermia model (Huang et al., 2008). This unified model is expressed below.
𝑑𝑃′
𝑑𝑉𝑠
= 𝑘
𝑣𝑃
𝑛 (5)
Where,
P’ = normalized differential pressure (P’= P/P0)
P = differential pressure through the filter medium
P0 = initial differential pressure through the filter medium
Vs = cumulative volume filtered per unit surface area of the filter medium [m3/m2]
kv = fouling coefficient [m2/m3]
According to Huang et al. (2008), the equation (5) can be converted into a function of normalized specific flux (J’s), where J’s = 1/P’= P0/P, obtaining the equation below. This equation is valid for
both constant pressure and constant flux filtration.
−
𝑑𝐽′𝑠𝑑𝑉𝑠
= 𝑘
𝑣𝐽′
𝑠2−𝑛 (6)
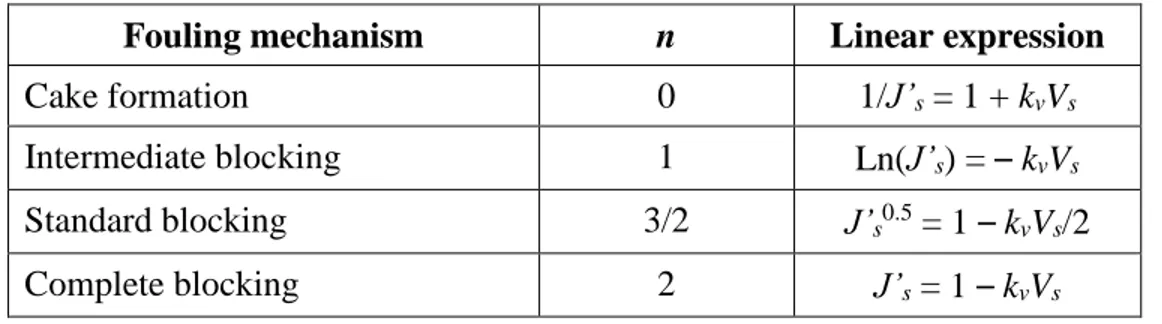
By changing the n value according to different modes of fouling and integrating the equation (6), a set of linear equations of the Unified Hermia model is obtained (Table 2.3). Thus, this model describes four different fouling mechanisms at constant flow rate: complete pore blocking, intermediate pore blocking, standard pore blocking, and cake layer formation. These mechanisms are explained in the following sub-sections. The Unified Hermia model has often been used to
estimate theoretically the filtration fouling on low-pressure membranes (MF/UF) (Chellam & Cogan, 2011; Huang et al., 2008).
Table 2.3: Linear equations based on Unified Hermia model (adapted from Huang et al. (2008)) Fouling mechanism n Linear expression
Cake formation 0 1/J’s = 1 + kvVs
Intermediate blocking 1 Ln(J’s) = – kvVs
Standard blocking 3/2 J’s0.5 = 1 – kvVs/2
Complete blocking 2 J’s = 1 – kvVs
2.4.1 Complete pore blocking
The complete pore blocking type of fouling refers to every particle in the suspension that is retained on the filter medium only blocks one pore (Ripperger, Gösele, Alt, & Loewe, 2000). This ideal condition assumes that none of the particles are placed on top of other particles or on the solid surface of the filter medium (Huang et al., 2008), as it is represented in Figure 2.4.
Figure 2.4: Complete pore blocking type of fouling (adapted from Huang et al. (2008))
2.4.2 Intermediate pore blocking
On the contrary of the complete pore blocking, the intermediate pore blocking considers that there is a probability that every particle reaching the surface of the filter medium may not only block the pores, but also may attach on already deposited particles, which means that not every particle will block a pore (Huang et al., 2008; Wakeman & Tarleton, 2005). A diagram of this type of fouling is presented in Figure 2.5.
Figure 2.5: Intermediate pore blocking type of fouling (adapted from Huang et al. (2008))
2.4.3 Standard pore blocking
This fouling mechanism of a filter medium, also called “pore constriction”, assumes that the pore volume decreases proportionally with the filtrate volume produced due to small particles attached on the walls of the pores. In this case, all pores are assumed to have the same size (Huang et al., 2008; Wakeman & Tarleton, 2005). This entrapment of particles may occur due to diffusional, inertial or electrostatic effects (Wakeman & Tarleton, 2005). This type of fouling is represented in Figure 2.6.
Figure 2.6: Standard pore blocking type of fouling (adapted from Huang et al. (2008))
2.4.4 Cake layer formation
Unlike the three pore blocking types presented above, the cake layer formation (Figure 2.7) does not implicate any changes to the pore structure of the filter medium (Huang et al., 2008). This type of fouling is produced by particles that may be slightly smaller or larger than the pores of the filter medium, and its fouling effect is enhanced by higher concentrations of solids in the feed. If several particles simultaneously reach a pore, there is a probability that they will form a bridge over the pore area. These bridges will support the formation of a cake (Wakeman & Tarleton, 2005).
Figure 2.7: Cake layer formation (adapted from Huang et al. (2008))
2.5 Conclusions of the literature review
According to this literature review, in an integrated Actiflo®/membranes system there has been concern about the impact of overdosing polymer and the export of microsand from Actiflo® on downstream UF/MF membranes, where the use of a microstrainer between the two processes has helped to cope with this issue. However, the frequent backwashing on the microstrainers due to its fast clogging it has converted in a new operational concern.
Regarding the study of the pore clogging or fouling behavior at microstrainers by using a filtration model, for example, the Unified Hermia model, to the best of our knowledge, no information has been found. The Unified Hermia model has been generally applied to low-pressure membranes. This lack of information led us to our main research hypothesis: the pore clogging behavior on microstrainers fed with clarified water from Actiflo® can be represented by the Unified Hermia model.
On the other hand, the adsorption affinity of polymers on different type of surfaces led us to other research hypothesis: the residual polymer in settled waters is the main cause of the pore clogging at microstrainers rather than microsand export.
Finally, the faster degradation of polymers (i.e. PAM or APAM) by strong basic conditions, led us to the last research hypothesis: the backwash performance of microstrainers is enhanced by alkaline rather than oxidizing conditions.
CHAPTER 3
MATERIALS AND METHODS
This chapter describe the methodology applied to carry out the objectives of this research project. The methodology involves the characterization of various effluent waters from Actiflo® processes applied in the province of Québec, the development of a filterability test on microstrainers, the estimation of a filterability index based on a 0.45 m membrane filter, the experimental design of backwashing tests on clogged microstrainers, data analysis, and characterization of clogging on microstrainers.
3.1 Sampling sites and type of water
The sampling sites selected were all drinking water treatment facilities of Québec, which have been using the Actiflo® process: Viau (Laval), Saint-Damase, Lévis, and L’Assomption. Pont-Viau plant is one of three plants that supplies drinking water in Laval city (Ville de Laval, 2003). The source of raw water for this plant comes from the Rivière des Prairies. In the case of Saint-Damase plant, the source of raw water comes from the Yamaska River. Water samples were also obtained from an Actiflo® pilot located in the Lévis plant. Its raw water intake comes from the Saint Lawrence River. L’Assomption plant obtains raw water from the L’Assomption River. Two types of water from Actiflo® process were characterized: clarified water (CW) and flocculated2 water (FW). Flocculated water was used in order to produce a lower water quality of the original clarified water for further filterability tests (see section 3.3).
Thus, a filterability test in laboratory was performed to evaluate the fouling potential of the following water qualities:
Clarified water Flocculated water 90% CW + 10% FW 70% CW + 30% FW
In addition, the operational conditions of Actiflo® of the four drinking water facilities during the sampling (period between June to November 2015) are described in Table 3.1. The microsand concentration refers to the concentration in the maturation tank. However, in the case of Pont-Viau only the microsand dose is available (1.5 g/m3). The microsand dose represents the average loss of microsand from the process.
Table 3.1: Actiflo® operational conditions of four drinking water facilities Plant Upflow velocity [m/h] Coagulant dose (Alum) [mg Al/L] Polymer Microsand concentration [g/L] Type Dose [mg/L] Pont-Viau 49 48 Hydrex 3511 (anionic) 0.22 N.A. Saint-Damase 35 - 40 40.5 Magnafloc (anionic) 0.37 5 - 8 Lévis 80 17 LT22S (cationic) 0.20 5 - 6 L’Assomption 10 4.8 C-492 (cationic) 0.21 1.96
3.2 Characterization methods of water samples
The characterization of the water samples comprises the following analytical methods. Turbidity was measured using a calibrated turbidimeter Hach 2100N. pH was determined using pH-meter Accumet Basic AB15. Other analytical methods based on Standard Methods (APHA, AWWA, & WEF, 2012) were used such as total suspended solids (TSS) and volatile suspended solids (VSS), methods 2540D and 2540E, respectively; total and dissolved organic carbon (TOC and DOC), method 5310B; UV absorbance (UV254nm) of organic compounds, method 5910B; and alkalinity measured by potentiometric titration method (2320B). On the other hand, particle concentration and size distribution were determined using Brigthwell DPA4100 SP1 at low magnification (particle sizing range between 2 to 300 μm). Streaming current value (SCV) of the particles was measured using Chemtrac ECA 2100 (sensitivity: low, gain: 1X, and zero offset: 0). Determination of total and soluble aluminum by Inductively Coupled Plasma Atomic Emission Spectroscopy
(ICP-AES, Thermo Scientific iCAP 6300) in conjunction with ultrasonic nebulizer CETAC U5000T+ , using a wavelength of 308.2 nm, with a detection limit of 10 ppb.
Regarding the characterization of residual polymer in clarified water, as was mentioned in the literature review, due to the difficulty to determine acrylamide at very low concentrations and complexity of the existing methods this parameter was not measured. However, the polymer adsorbed on microstrainers was analyzed, the method is explained in section 3.6.
3.3 Filterability tests
Two types of filterability tests were carried out, the first one consist of filterability on microstrainers ranging between 75 to 200 μm, and the second one was applied on a 0.45 μm membrane filter. Both are explained in the following sub-sections.
3.3.1 Filterability on microstrainers
The filterability test on microstrainers was performed on various opening sizes using two materials: nylon (100 and 200 μm) and stainless steel T304 (75, 103, 152 μm). The open area of the SS strainers of 75, 103, and 152 μm are 46%, 37%, and 38%, respectively. Different water qualities (see section 3.1) of four Actiflo® processes (Pont-Viau, Saint-Damase, Lévis, and L’Assomption) were evaluated using different nylon strainers in the laboratory. On the other hand, clarified water from Pont-Viau Actiflo® was selected to test the different opening sizes of the SS strainers, which required a greater volume of water. Thus, tests were performed on site.
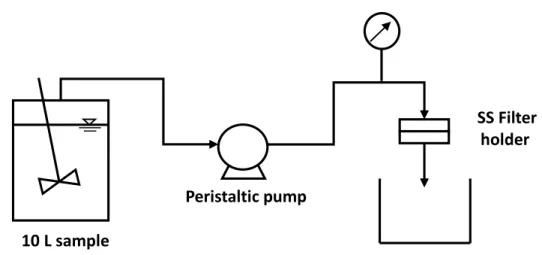
The filterability tests (Figure 3.1) at laboratory consist of a dead-end filtration mode. 10 L water sample, homogenously mixed (gradient velocity, G 100 s-1), is pumped at 0.36 0.01 L/min using a peristaltic pump (Masterflex I/P drive with Easy-Load head), to a stainless steel filter holder (diameter = 13 mm) which contains the nylon strainer and below of it a 300 μm SS support. The filtration area is about 0.79 cm2. During the test, the pressure of the system was registered every 30 seconds. The test was stopped after the filtration of 10 L of sample or when reached a high differential pressure (> 7 psig). Images of the experimental setup can be found in Appendix A. The filterability tests on site (Pont-Viau) consist in the filtration of clarified waters pumped at 0.37 L/min directly from the Actiflo® (see operational data in Appendix B) using the same experimental setup as above. In this case, SS strainers were used, without a support below them. The filterability
test is stopped when the differential pressure reaches 7 psig, this in order to reproduce real full-scale operational conditions. Then, the clogged strainers were subjected to further backwashing tests.
Figure 3.1: Schematic diagram of the filterability test on microstrainers
3.3.2 Filterability on a 0.45 μm membrane filter
The purpose of this filterability test is to obtain a filterability index (FI), which might be able to correlate with the fouling parameter obtained from the filterability on microstrainers (section 3.3.1). The 0.45 μm filterability test is commonly used by VEOLIA as a method to evaluate the fouling propensity of Actiflo® clarified waters for granular media filters. The materials needed for this test are a 0.45 μm polyethersulfone (PES) membrane filter, 47 mm (Supor®-450, Pall), a filter holder with funnel, 1 L side-arm flask, vacuum pressure gauge, and a chronometer. The test consists of registering the filtration time of 200 mL of water sample that passes through a membrane filter (previously wetted with demineralized water (DW)) at a constant vacuum pressure of 495 mmHg (19.5“Hg or 9.6 psig).This is based on the method developed by C. Desjardins et al. (2002). This filterability test was applied to the water sample and a blank using DW, and it was carried out in triplicates. Then, the FI was estimated as follows (Tramfloc, 2014).
𝐹𝐼 =
𝑆𝑎𝑚𝑝𝑙𝑒 𝑡𝑖𝑚𝑒 𝐵𝑙𝑎𝑛𝑘 𝑡𝑖𝑚𝑒 (7) Peristaltic pump SS Filter holder 10 L sample3.4 Backwashing tests
Backwashing tests were performed after the filterability tests on SS microstrainers on site (Pont-Viau). The fouling on microstrainers was exposed to oxidizing and alkaline cleaning conditions. For the former, chlorine (as sodium hypochlorite, NaOCl) was selected, and for the latter, sodium hydroxide (NaOH). The respective cleaning solutions were prepared on site by adding the reagents mentioned before into filtered water obtained from the filtration process of Pont-Viau plant. The volume of the cleaning solution was determined by the backwashing flow rate and time used. Backwashing was in reverse direction of normal flow and lasted 5 min (3 min of cleaning solution followed by 2 min of rinse with filtered water).
The backwashing test with chlorine for both 75 and 103 μm SS strainers was performed under the following conditions:
Backwashing velocities: 0.16 and 0.24 m/s (0.6 and 0.9 L/min, respectively) Chlorine concentrations: 0, 10, and 100 ppm Cl2
On the other hand, the backwashing test with the alkaline solution for 75, 103, and 152 μm SS strainers was performed under the following conditions:
Backwashing velocities: 0.16, 0.24, and 0.35 m/s (0.6, 0.9, and 1.35 L/min respectively) pH: 5.9 (ambient filtered water pH), 11.0, and 12.6
The backwashing efficiency of these tests was estimated by solids removal on SS strainers using the procedure below:
1) Determination of retained solids at 105 °C for 1 h (after filterability test (FT), duplicate) 2) Determination of retained solids at 105 °C for 1 h (after backwashing (BW))
3) Calculation of solids removal:
𝑆𝑜𝑙𝑖𝑑𝑠 𝑟𝑒𝑚𝑜𝑣𝑎𝑙 (%) = (𝑅𝑒𝑡𝑎𝑖𝑛𝑒𝑑 𝑠𝑜𝑙𝑖𝑑 𝑎𝑓𝑡𝑒𝑟 𝐹𝑇−𝑅𝑒𝑡𝑎𝑖𝑛𝑒𝑑 𝑠𝑜𝑙𝑖𝑑𝑠 𝑎𝑓𝑡𝑒𝑟 𝐵𝑊)
3.5 Data analysis
The normalized differential pressure and the cumulative specific volume of filtrate, obtained during the filterability test, will be used to evaluate the fouling behavior on microstrainers using the linear equations of Unified Hermia model, and thus finding a fouling coefficient (kv). STATISTICA 12
software was used for modeling the data.
The different factors (such as strainer opening size, BW velocity, Cl2 concentration, and pH) affecting the backwashing efficiency (or solids removal) of both oxidizing and alkaline conditions were analyzed by a factorial ANOVA (2x2x3 for the first condition and 3x3x3 for the second one) with a statistical significance level = 0.05 (using STATISTICA 12 software). In addition, a main effects ANOVA was carried out to analyze all data, which include both backwashing conditions. This means to analyze the significance difference between pH levels reached by an alkaline solution and by chlorine solution (pH 8.0 and 9.4 for 10 and 100 ppm Cl2, respectively), as well as verify if there is a significance difference between different strainer opening sizes and BW velocities.
3.6 Characterization of clogging on strainers
Using microscopy images at 10X magnification (OLYMPUS BX51 microscope and camera DP70) of the different strainers after filterability tests, help to visualize and understand the fouling behavior model. In addition, microscopy images were taken after backwashing tests.
The presence of polymer (APAM) adsorbed on stainless steel strainers after filterability and backwashing tests was determined by Fourier Transform Infrared spectroscopy (FTIR) using a Spectrum 65 from Perkin-Elmer. The infrared (IR) spectrums of SS strainers were compared with the IR spectrum of a pure dry commercial APAM (Hydrex 3511). This polymer is used in Pont-Viau.
CHAPTER 4
RESULTS AND DISCUSSION
This chapter comprises the results and discussion according to the objectives proposed for this research project. First, the settled waters under investigation were characterized. In a second section, results of filterability assays will be presented. The third section will report the analysis of the fouling mechanisms.
4.1 Settled water characteristics
The characterization of clarified water (or settled water) from the Actiflo® of Pont-Viau, Saint-Damase, Lévis, and L’Assomption drinking water facilities is summarized in
Table 4.1, for a sampling period spanning from June to November 2015. Regarding pH values, they ranged between 6.8 and 7.6, with the highest value observed in Lévis (fed by the St Lawrence River). The higher turbidity values were observed in Lévis and L’Assomption, meanwhile lower values were observed in Pont-Viau and Saint-Damase, all these turbidity values complies with the target suggested by Kawamura (2000) for a clarifier effluent (< 2 NTU). The streaming current value (SCV) is an indicator of the electric charge of the suspended particles in solution. All of the four clarified waters had a negative charge, especially in Pont-Viau, which implied that full charge neutralization was not achieved in these waters. Total organic carbon (TOC) of all clarified waters indicates a potential for disinfection by-products (DBP) formation, since their values exceed 2 mg C/L (USEPA, 1999). In addition, the organic matter content in clarified water of Saint-Damase suggests that with the coagulation was not optimized as the SUVA3 value recommended for a filtered water was higher than 2.0 L/mg C·m-1 (Kawamura, 2000). It is important to consider the organic matter content since it has been reported that it has an inversely effect on APAM adsorption on negatively charged particle surfaces (Lu, Wu, & Letey, 2002). The VSS to TSS ratio ranged between 16 to 55%, with the highest value observed for Pont-Viau and the lowest in Lévis. This suggests that clarified water from Pont-Viau has the highest organic content, and in the case of Lévis, there is more presence of inorganic compounds, which can be explained due to a higher microsand export caused by a high upflow velocity in the Actiflo® process (80 m/h) at the time of
3 SUVA is the normalized value of UV

![Table 3.1: Actiflo® operational conditions of four drinking water facilities Plant Upflow velocity [m/h] Coagulant dose (Alum) [mg Al/L] Polymer Microsand concentration [g/L] Type Dose [mg/L] Pont-Viau 49 48 Hydrex 3511 (anionic) 0.22 N.A](https://thumb-eu.123doks.com/thumbv2/123doknet/2323197.29564/37.918.102.820.348.593/actiflo-operational-conditions-drinking-facilities-coagulant-microsand-concentration.webp)
![Figure 4.1: Pressure variation during filterability of various clarified waters using a 100 m nylon strainer 0510152025300204060 80 100 120 140Total head loss, ΔP [psi]Vs[m3/m2]Pont-ViauSt-DamaseLévisL'AssomptionStrainer pore size = 100 μm, Nylon](https://thumb-eu.123doks.com/thumbv2/123doknet/2323197.29564/45.918.175.753.134.534/figure-pressure-variation-filterability-clarified-strainer-damaselevisl-assomptionstrainer.webp)