HAL Id: hal-01579827
https://hal-univ-rennes1.archives-ouvertes.fr/hal-01579827
Submitted on 31 Aug 2017
HAL is a multi-disciplinary open access
archive for the deposit and dissemination of sci-entific research documents, whether they are pub-lished or not. The documents may come from teaching and research institutions in France or abroad, or from public or private research centers.
L’archive ouverte pluridisciplinaire HAL, est destinée au dépôt et à la diffusion de documents scientifiques de niveau recherche, publiés ou non, émanant des établissements d’enseignement et de recherche français ou étrangers, des laboratoires publics ou privés.
Regulatory myeloid cells: an underexplored continent in
B-cell lymphomas
Mikael Roussel, Jonathan M. Irish, Cédric Menard, Faustine Lhomme, Karin
Tarte, Thierry Fest
To cite this version:
Mikael Roussel, Jonathan M. Irish, Cédric Menard, Faustine Lhomme, Karin Tarte, et al.. Regulatory myeloid cells: an underexplored continent in B-cell lymphomas. Cancer Immunology, Immunotherapy, Springer Verlag, 2017, 66 (8), pp.1103-1111. �10.1007/s00262-017-2036-5�. �hal-01579827�
Regulatory myeloid cells: an underexplored continent in B-cell lymphomas
Mikael Roussel,1,2 Jonathan M Irish,3,4 Cedric Menard,1,2 Faustine Lhomme,1 Karin Tarte,1,2 and Thierry Fest1,2
1 CHU de Rennes, Pole de Biologie, Rennes, France
2 INSERM, UMR U1236, Université Rennes 1, EFS Bretagne, Equipe Labellisée
Ligue Contre le Cancer, Rennes, France
3 Department of Cancer Biology, Vanderbilt University School of Medicine, Nashville,
TN, USA
4 Department of Pathology, Microbiology and Immunology and Vanderbilt-Ingram
Cancer Center, Vanderbilt University Medical Center, Nashville, TN, USA
Short title: Regulatory myeloid cells and germinal center lymphomas
Corresponding author: Mikael Roussel, Laboratoire d'Hématologie, CHU
Pontchaillou, 2 rue Henri Le Guilloux, F-35033 Rennes Cedex, France, E-mail: mikael.roussel@chu-rennes.fr, Phone: +33 (0) 299 289 142
Acknowledgments
This work was supported by a research grant from the National Institute of Cancer (INCa Recherche Translationnelle 2010), Groupe Ouest-Est des Leucémies et des Autres Maladies du Sang (GOELAMS), LYSA group (Lymphoma Study Association), Comité pour la Recherche Clinique et Translationnelle (CORECT, CHU Rennes), Ligue Nationale Contre le Cancer, R00 CA143231-03, the Vanderbilt-Ingram Cancer Center (VICC, P30 CA68485), VICC Ambassadors, and a VICC Hematology Helping Hands award. Mikael Roussel is a recipient of a fellowship from the Nuovo-Soldati Foundation. We are thankful to Caroline E. Roe and P. Brent Ferrell for technical assistance and fruitful discussions
Compliance with ethical standards Conflict of Interest Disclosure
J.M.I. is co-founder and board member at Cytobank Inc. and received research
Abstract
In lymphomas arising from the germinal center, prognostic factors are linked to the myeloid compartment. In particular, high circulating monocyte or myeloid-derived suppressor cell counts are associated with poor prognosis for patients with high-grade B-cell lymphomas. Macrophages with an M2 phenotype are enriched within lymphoma tumors. However, the M1/M2 nomenclature is now deprecated and the clinical impact of this phenotype remains controversial. Across cancer types, myeloid cells are primarily thought to function as immune suppressors during tumor initiation and maintenance, but the biological mechanisms behind the myeloid signatures are still poorly understood in germinal center B-cell lymphomas. Herein, we describe the role and clinical relevance of myeloid cells in B-cell lymphoma and propose innovative approaches to decipher this complex cellular compartment. Indeed, characterization of this heterogeneous cell ecosystem has been largely accomplished with “low resolution” approaches like morphological evaluation and immunohistochemistry, where cells are characterized using a few proteins and qualitative metrics. High-resolution, quantitative approaches, such as mass cytometry, are valuable in order to better understand myeloid cell diversity, functions, and to identify potential targets for novel therapies.
Keywords
B-cell lymphoma; tumor microenvironment; Regulatory Myeloid Suppressor Cells; Myeloid-Derived Suppressor Cell; Tumor Associated Macrophage; Mass Cytometry
germinal center B-cell lymphomas
Abbreviations
CyTOF: cytometry by time-of-flight DLBCL: diffuse large B cell lymphoma FL: follicular lymphoma
HL: Hodgkin lymphoma
M-MDSC: monocytic myeloid derived suppressor cell
PMN-MDSC: polymorphonuclear myeloid derived suppressor cell TAM: tumor associated macrophage
TME: tumor microenvironment Treg: regulatory T cell
In B-cell lymphomas, the myeloid compartment contributes to prognosis
Lymphomas constitute a large group of cancer arising from lymphoid or extra-nodal tissues [1]. The nomenclature of these neoplasms regularly evolves, and currently comprises more than 30 distinct clinical, pathological, genetic, and molecular entities [2]. Altogether, around 10,000 new cases of lymphoma are diagnosed each year, worldwide, and 90% of these are B-cell lymphomas [3]. Diffuse large B-cell lymphoma (DLBCL), follicular lymphoma (FL), and classical Hodgkin lymphoma (HL) represent 60% to 70% of B-cell lymphoma cases. Over the past decade of B-cell lymphoma research, the tumor microenvironment (TME) has emerged as a therapeutic target [3-8]. The composition of the TME is highly variable, and B-cell neoplasms can be categorized in terms of their dependence on cells in the TME [3]. For example, more than 90% of the cells in HL tumors are considered non-malignant TME and thought to support tumor cell growth [3]. Conversely, in Burkitt's lymphoma, tumor cells appear to be virtually independent from non-tumor cells signals [3]. The abundance of different TME cell subsets varies greatly between tumors and can include stromal cells, T cell subsets (including T helper cells [TH1,
TH2], T follicular helper cells [TFH], regulatory T cells [Treg], and CD8pos T cells), B
cells, and myeloid cells (including mast cells, macrophages, and myeloid-derived suppressor cells [MDSC]) [3, 9].
Despite the introduction of immunotherapy, treatment failure is still observed and emphasizes the need for prognostic biomarkers to better identify at-risk patients [10] and research into mechanisms of resistance. In B-cell lymphomas, some prognostic factors are linked to myeloid cell biology. In particular, gene expression profiling experiments in DLBCL, FL, and HL have revealed the presence of myeloid
cell-related prognostic signatures [4-6]. Currently, we still lack a full understanding of the biology that underlies these signatures. Prognostic factors that are evaluated at the time of diagnosis in peripheral blood or at the tumor site include: i) soluble factors such as soluble PD-L1 [11, 12], soluble CD163 [13], CCL17 [13], CXCL10 [14], and IL-10 [14], ii) number of myeloid cells or macrophages in the TME expressing CD68pos [6, 10, 15, 16] or CD163pos [16-18], and iii) number of circulating myeloid
cells [17, 19-25]. In Rituximab era studies of DLBCL, FL, and HL, increases in circulating neutrophils [17, 19] and/or monocytes [17, 20-24] have been proposed as independent prognostic markers. In particular, we demonstrated that a regulatory subtype of monocytes, so-called M-MDSC (Monocytic-MDSC), is increased in the blood of DLBCL patients, as compared to healthy donors, and that this increase is correlated with poor prognosis [25].
In germinal center B-cell lymphomas, myeloid regulatory cells are involved in the neoplastic process
The myeloid tumor microenvironment includes dendritic cells (DCs), MDSCs, and tumor-associated macrophages (TAMs). Few studies have evaluated associations between DCs and B-cell lymphoma prognosis. High numbers of plasmacytoid DCs in FL tumors were correlated with a good prognosis [26]. Consistent results were found in HL for CD83pos myeloid DCs [27] and in DLBCL for
CD1apos DCs [28]. Altogether, these results suggested DCs mediate anti-tumor
immunity [26].
MDSCs are a heterogeneous population arising from polymorphonuclear cells (PMN-MDSC, LinnegHLA-DRnegCD33posCD11bpos) and from monocytes (M-MDSC,
functions [29, 30]. Additional markers, such as CD116, CD124, VEGF-R (vascular endothelial growth factor receptor), CD11c, CD11b, and PD-L1, are commonly expressed on MDSCs and play functional roles in MDSC-mediated immune regulation [30]. Interestingly, these markers are regulated by environmental signals, and MDSC phenotypes vary widely across tumors [31]. MDSC induction and expansion is mediated by soluble factors including VEGF (vascular endothelial growth factor), GM-CSF, M-CSF, S100A8/A9, IL-4, IL-6, and IL-10, which can be produced by tumor and/or surrounding cells, such as stromal cells, T cells, and macrophages [30]. Many of these environmental cues depend on STAT3, STAT6, and STAT1, and these transcription factors activate expression of genes involved in the blockade of the myeloid differentiation or in immune regulation. These multiple suppressive mechanisms converge to impair effector T cell and NK cell functions and also contribute to macrophage polarization towards what has classically been described as an M2 anti-inflammatory phenotype. In humans, myeloid regulatory mechanisms include: i) Treg expansion, ii) depletion of amino acids essentials for
T-cell metabolism by expression of arginase 1 or IDO, iii) production of reactive oxygen species (ROS) through expression of NADPH (Nicotinamide Adenine Dinucleotide Phosphatase) oxydase (NOX2), and iv) IL-10, TGFβ (transforming growth factor) release and PD-L1 expression [31, 32].
In most solid cancers studied (melanoma, renal, lung, liver, or prostate cancer), circulating MDSCs are increased and their abundance is correlated with tumor stage, tumor volume, and disease prognosis [33-35]. In hematological malignancies, the role of circulating MDSCs is less clear. An enrichment in circulating MDSCs has been described in myeloma [36] and T-cell lymphoma [37]. We recently showed, as others, that the number of circulating MDSCs constitutes a prognostic
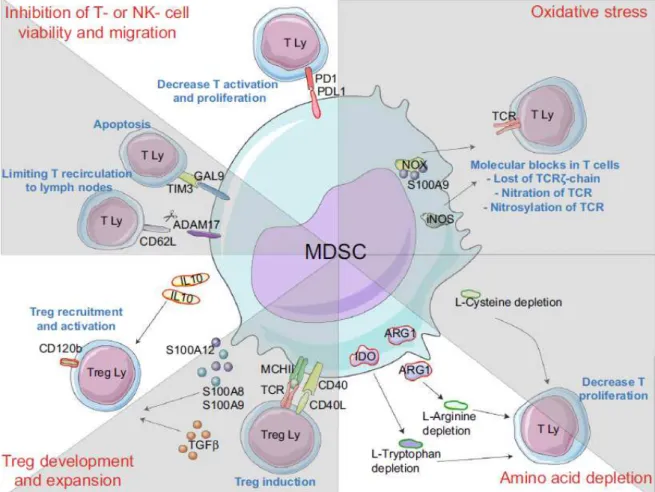
factor in DLBCLs [25, 38]. Poor prognostic significance of MDSCs has also been observed in indolent lymphoma [39], chronic lymphocytic leukemia [40, 41], and HL [38, 42]. While numerous suppressive mechanisms have been described in MDSC biology [31, 32], only few of these mechanisms have been explored in B-cell lymphomas (Figure 1). In DLBCLs, an increase of PMN-MDSC in peripheral blood has been reported [25, 38, 43]. We observed PMN-MDSC express arginase I, but we did not observe an association between MDSC abundance and clinical outcome, in contrast with a recent study [38]. This difference could be explained by subtle differences in expert gating strategies used for PMN-MDSC enumeration (CD66bposCD33dimHLA-DRneg [38] vs. LinnegCD123lowHLA-DRnegCD33posCD11bpos
[25]). Computational analysis of myeloid cells may provide an unbiased way to resolve this difference [44, 45]. Preparation of samples was also different in these studies. Our experiments were performed on whole peripheral blood and the other study was performed on the mononuclear cell fraction of peripheral blood [38]. The latter one is now recommended to better evaluate low density PMN-MDSCs [29]. M-MDSCs (CD14posHLA-DRlow) were detected in peripheral blood from DLBCL patients
in 4 studies [25, 39, 46, 47]. Arginase I involvement in immune suppression was reported only in one study [39]. We demonstrated that the overall increase of monocytes in peripheral blood of DLBCL patients might be related to an increase of M-MDSCs. Indeed, gene expression profiling revealed a myeloid suppressive cell signature in peripheral blood characterized by expansion in circulating M-MDSC counts (CD14posHLA-DRlow). Interestingly, intact M-MDSCs function was
demonstrated by suppression of T-cell response in vitro. M-MDSCs (CD14pos
HLA-DRlow) were compared to monocytes (CD14posHLA-DRhigh) by transcriptomic analysis.
as IL4-R, IL6-R, RELB, STAT3, NFKB, CEBP
β
, AIM2, TNFR2, and NOX2. In DLBCL,the M-MDSC transcriptomic signature and the abundance of M-MDSC in peripheral blood were correlated with the international prognostic index and event-free survival. Finally, although arginase I and IDO activities were detected in plasma from DLBCLs, the suppressive activity of M-MDSC was not impaired in vitro in the presence of arginase- or IDO- inhibitors. Thus, we concluded that M-MDSC suppressive activity in DLBCL is independent of arginase I and IDO activity. This finding was supported by the observation that myeloid-dependent T-cell suppression could be ascribed to a release of IL-10 and S100A12 and an increase in PD-L1 expression [25] (Figure 1). MDSC counts were evaluated in two recent studies with a total of 53 indolent lymphomas (cases were primarily FL; also included were cases of mantle cell lymphoma, chronic lymphocytic leukemia, mucosa-associated lymphoid tissue lymphoma, and lymphoplasmacytoid lymphoma) [38, 39]. When compared to healthy donors, an increase in circulating PMN-MDSCs (CD66bposCD33dimHLA-DRneg) with
arginase I activity was observed in a cohort of 31 indolent lymphomas [38]. M-MDSCs (CD14posHLA-DRlow) were detected in a cohort of 22 indolent lymphomas
[39]. In HL, abundance of both PMN- and M-MDSCs was increased in peripheral blood [38, 42] and arginase I activity was increased.
It has been demonstrated in murine models of solid tumors that MDSCs also have the ability to differentiate into TAMs at the tumor site [48-50]. TAMs exhibit a so-called M2 phenotype, and are characterized by the expression of immunomodulatory molecules (such as PD-L1, B7-H4, and VISTA [V-domain Ig suppressor of T cell activation]), the production of immunosuppressive cytokines (like IL-10 and TGFβ), and the capacity to inhibit effector T cell functions via arginase 1 or IDO activities [50]. Within tissues, CD68 and CD163 are frequently proposed to define macrophage
subsets [50]. Macrophages, which are involved in tissue homeostasis and host defense, were historically split into classically activated or “M1” and alternatively activated or “M2”. M1 polarization occurs in response to IFN-γ or LPS stimulation and is associated with an increase of inflammatory cytokines and tumoricidal capabilities. In contrast, IL-4, IL-10, or IL-13 stimulation polarizes macrophages to an M2 phenotype associated with tissue repair, angiogenesis, and a lack of effective tumor immunity. In fact, these two types capture functions that are the extremes of a wide spectrum of overlapping polarization states that depend largely on programming from external stimuli [51-53].
The contribution of TAM infiltration to B-lymphoma prognosis is hotly debated and TAM phenotypes are poorly characterized in human lymphoma [54]. Additionally, although TAMs have been associated with immunomodulation in other tumor types, their functional role has not yet been fully defined within the lymphoma microenvironment. In DLBCL, TAMs were defined in the TME as CD68pos or
CD68posCD163pos and their prognostic impact remains controversial [15, 55, 56]. In
particular, differing correlations with clinical outcome were observed and appeared to depend on the way TAMs were defined (i.e., as CD68pos, CD163pos, or
CD68posCD163pos) and whether treatments included the anti-CD20 antibody
Rituximab or not [57]. To date, these discrepancies have not been resolved in DLBCL and a definitive study employing standardized techniques is needed [57]. In FLs, TAMs were defined and enumerated as CD68pos or CD163pos cells and their
correlation with clinical outcome has also been controversial. Indeed, a high TAM count correlated with poor prognosis in patients treated by chemotherapy [58], in agreement with their capacity to activate FL B cells through the release of IL-15 or the triggering of BCR signaling [59, 60]. In contrast, in a study of FL patients treated
with Rituximab [61-63], TAMs were associated with good prognosis. This apparent discrepancy might be explained by rituximab-dependent tumor cell phagocytosis mediated by macrophages that would otherwise be suppressive [64]. Interestingly, M2 macrophages, which bear many similarities to TAMs and may be an equivalent population, display a phagocytic capacity superior to classical pro-inflammatory M1 macrophages. This increased functional capacity is thought to be based in expression of receptors to the Fc portion of IgG isotype immunoglobulin (FcγRs), including high expression of CD32a/FcγRIIa [65]. Thus, TAMs exhibit treatment-specific roles in B-cell lymphomas, and the same might be expected to be observed for MDSCs. Detrimental immunosuppressive and tumor-promoting properties of MDSCs have been widely described in solid cancers during disease onset and, to a lesser extent, during chemotherapy treatment. It is currently unclear whether the efficacy of immunotherapeutic agents, such as cytotoxic antibodies, is modulated by MDSCs (and vice versa). As for newer approaches like immune checkpoint inhibitors, it is highly likely that TAMs play a role, since TAMs can express PD family ligands PD-L1 and PD-L2. However, the involvement of MDSCs is more speculative as their characterization is more recent and relies on deep phenotyping and functional assays. In HL, TAMs defined as CD68pos or CD163pos cells are associated with a
shortened overall survival in the majority but not all of the studies [5, 66-68].
Mass cytometry clarifies the myeloid landscape
Although their phenotype is heterogeneous, myeloid regulatory cell characterization has classically relied on a small number of proteins, such as CD68 and/or CD163, to delineate TAM populations [69, 70]. MDSCs were originally defined by fluorescence cytometry using a small set of canonical markers that included
CD11b, CD15, CD33, HLA-DR, and CD14 [29]. High-resolution approaches such as mass cytometry can better characterize the diversity and function of MDSC and may help to reveal cell-specific features that may constitute potential targets for novel therapies [71-73]. Mass cytometry combined with high-dimensional analysis tools from machine learning, such as visualization of t-distributed stochastic neighbor embedding (viSNE) and spanning-tree progression analysis of density-normalized events (SPADE), is now considered a robust method to identify numerous and novel subsets within heterogeneous tissues, including blood and tumor [74-76]. Several studies using mass cytometry have explored immune compartments including B-, T-, NK-, or myeloid cells [74, 77-89]. In particular, Becher et al. developed a dedicated panel to characterize myeloid cells across eight mouse tissues, which revealed previously unidentified populations in mice using unsupervised analysis of mass cytometry [44, 79]. In humans, 2 different myeloid panels revealed underestimated TAM subtypes in renal cell carcinoma and lung adenocarcinoma [90, 91]. In particular, TAM subsets were identified expressing high level of HLA-DR, CD68, CD64, CD204, and CD38 or CD14, CD64, CD11c, and PPARγ (peroxisome proliferator-activated receptor gamma) in samples from renal or lung carcinoma, respectively.
With the aim to obtain a broad overview of the myeloid compartment in B-cell lymphoma, a panel dedicated to the myeloid compartment was defined and validated on in-vitro derived monocyte, MDSC, and macrophage subsets [45]. Sample preparation and analysis workflows were also optimized or developed [92-94]. Tumor tissues from DLBCL, FL, and reactive lymph nodes from healthy donors were analyzed (unpublished data). These studies revealed the diversity of the myeloid compartment in TME by enumerating MDSCs/TAMs and DCs and by characterizing
the specific pattern of myeloid cell enrichment in each disease (Figure 2). As with the studies of lung adenocarcinoma and renal cell carcinoma, mass cytometry revealed involvement of T cell subsets in B cell lymphoma [90, 91]. In particular, in DLBCL Tregs and CD8 effector memory were increased in the TME (unpublished data).
Altogether, these studies demonstrated the feasibility of deep phenotyping human tissues and the value of mass cytometry in deciphering the myeloid compartment and relationships between immune cell subsets.
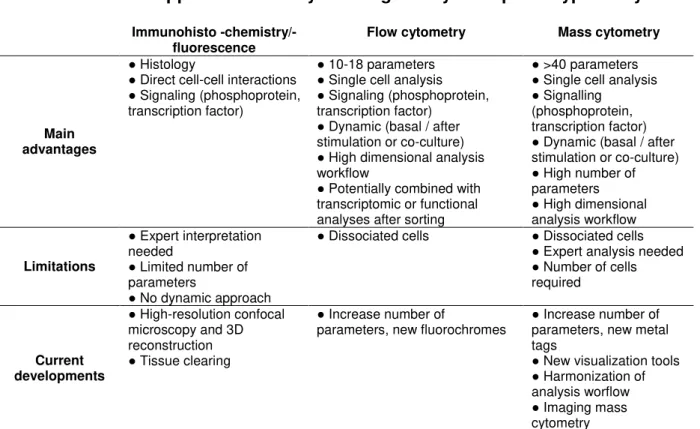
Challenges and future directions
In the near future, mass cytometry will be combined with state-of-the-art immunohistochemistry approaches [95, 96]. Such combinations allow detection of more than 30 parameters on histological samples and quantitative, high dimensional analysis that is coupled to knowledge of cell location and quantification of cell-to-cell positional relationships within tissue microenvironments (Table I). High-resolution imaging with 3D reconstruction after tissue clearing is a rapidly growing field [97]. These approaches are expected to be particularly valuable for studies of TAM biology in lymphomas. Notably, antibody based imaging and flow cytometry approaches allow the detection of transcription factors phosphorylation events (e.g., phospho-STATs and cEBPβ) and other key molecules contributing to immune regulation (e.g., Arginase I, NOX2, NOS2 [nitric oxide synthase], PD-L1, IL-10, TGF-β, and CD124) [29]. Although deep phenotyping does not replace functional assays (reviewed in [29]), the opportunity to simultaneously analyze numerous MDSC/TAM surface markers, transcription factors, signaling events, and immune regulation molecules will likely be a major step forward in clinical, personalized medicine studies of TAM/MDSC, where functional assays are impractical.
Controlling the expansion and accumulation of MDSCs and blocking MDSC suppressive functions, e.g. by targeting CSF1-R (colony stimulating factor 1 receptor) [98] or S100 family members [99], represent promising novel approaches in cancer therapy. As MDSC do not bear a single, cell-lineage specific, extracellular membrane marker, it is very difficult to deplete MDSC in vivo while sparing other myeloid cells. To date, the main target is CSF1-R, the receptor for M-CSF, as its expression is largely restricted to cells from the monocytic lineage. Numerous clinical trials investing the efficacy of blocking CSF-1R and its effector signaling cascade by means of kinase inhibitors or antagonistic monoclonal antibodies are ongoing [50, 100]. These studies should determine whether shutting down the CSF1/CSF1-R axis
in vivo effectively removes MDSC, induces MDSC reprogramming, and/or skews
MDSC differentiation. Some classical chemotherapeutic molecules, such as gemcitabine, 5-fluoro-uracile (5-FU) or lenalidomide, may also specifically trigger MDSC apoptosis in vitro and in vivo [101-103].
In B-cell lymphomas, there is a need to capture the biological features and immunological properties of regulatory myeloid cells and to understand the crosstalk between tumor cells, myeloid cells, and other immune cells. This knowledge will greatly accelerate the development of targeted treatments for patients with B-cell lymphoma. In the near future, the field is expected to benefit greatly from high-dimensional approaches, such as flow mass cytometry, imaging mass cytometry, and high-resolution microscopy with 3D reconstruction.
Literature cited
1. World Health Organization (2008) WHO Classification of Tumours of
Haematopoietic and Lymphoid Tissues. International Agency for Research on Cancer, Lyon, France
2. Swerdlow SH, Campo E, Pileri SA, et al (2016) The 2016 revision of the World Health Organization classification of lymphoid neoplasms. Blood 127:2375–2390. doi: 10.1182/blood-2016-01-643569
3. Scott DW, Gascoyne RD (2014) The tumour microenvironment in B cell lymphomas. Nat Rev Cancer 14:517–534. doi: 10.1038/nrc3774
4. Dave SS, Wright G, Tan B, et al (2004) Prediction of survival in follicular lymphoma based on molecular features of tumor-infiltrating immune cells. N Engl J Med 351:2159–2169. doi: 10.1056/NEJMoa041869
5. Steidl C, Lee T, Shah SP, et al (2010) Tumor-associated macrophages and survival in classic Hodgkin's lymphoma. N Engl J Med 362:875–885. doi: 10.1056/NEJMoa0905680
6. Lenz G, Wright G, Dave SS, et al (2008) Stromal gene signatures in large-B-cell lymphomas. N Engl J Med 359:2313–2323. doi:
10.1056/NEJMoa0802885
7. Ame-Thomas P, Le priol J, Yssel H, et al (2012) Characterization of
intratumoral follicular helper T cells in follicular lymphoma: role in the survival of malignant B cells. Leukemia 26:1053–1063. doi: 10.1038/leu.2011.301 8. Amé-Thomas P, Tarte K (2014) The yin and the yang of follicular lymphoma
cell niches: role of microenvironment heterogeneity and plasticity. Semin Cancer Biol 24:23–32. doi: 10.1016/j.semcancer.2013.08.001
9. Nicholas NS, Apollonio B, Ramsay AG (2016) Tumor microenvironment (TME)-driven immune suppression in B cell malignancy. Biochim Biophys Acta 1863:471–482. doi: 10.1016/j.bbamcr.2015.11.003
10. Vaidya R, Witzig TE (2014) Prognostic factors for diffuse large B-cell lymphoma in the R(X)CHOP era. Annals of Oncology 25:2124–2133. doi: 10.1093/annonc/mdu109
11. Rossille D, Gressier M, Damotte D, et al (2014) High level of soluble programmed cell death ligand 1 in blood impacts overall survival in
aggressive diffuse large B-Cell lymphoma: results from a French multicenter clinical trial. Leukemia 28:2367–2375. doi: 10.1038/leu.2014.137
12. Rossille D, Azzaoui I, Feldman AL, et al (2017) Soluble programmed death-ligand 1 as a prognostic biomarker for overall survival in patients with diffuse large B-cell lymphoma: a replication study and combined analysis of 508
13. Jones K, Vari F, Keane C, et al (2013) Serum CD163 and TARC as Disease Response Biomarkers in Classical Hodgkin Lymphoma. Clin Cancer Res 19:731–742. doi: 10.1158/1078-0432.CCR-12-2693
14. Charbonneau B, Maurer MJ, Ansell SM, et al (2012) Pretreatment circulating serum cytokines associated with follicular and diffuse large B-cell lymphoma: A clinic-based case-control study. Cytokine 60:882–889. doi:
10.1016/j.cyto.2012.08.028
15. Riihijarvi S, Fiskvik I, Taskinen M, et al (2015) Prognostic influence of macrophages in patients with diffuse large B-cell lymphoma: a correlative study from a Nordic phase II trial. Haematologica 100:238–245. doi: 10.3324/haematol.2014.113472
16. Connors JM (2015) Risk assessment in the management of newly diagnosed classical Hodgkin lymphoma. Blood 125:1693–1702. doi: 10.1182/blood-2014-07-537480
17. Wang J, Gao K, Lei W, et al (2017) Lymphocyte-to-monocyte ratio is
associated with prognosis of diffuse large B-cell lymphoma: correlation with CD163 positive M2 type tumor-associated macrophages, not PD-1 positive tumor-infiltrating lymphocytes. Oncotarget 8:5414–5425. doi:
10.18632/oncotarget.14289
18. Keane C, Vari F, Hertzberg M, et al (2015) Ratios of T-cell immune effectors and checkpoint molecules as prognostic biomarkers in diffuse large B-cell lymphoma: a population-based study. The Lancet Haematology 2:e445– e455. doi: 10.1016/S2352-3026(15)00150-7
19. Troppan K, Deutsch A, Gerger A, et al (2014) The derived neutrophil to lymphocyte ratio is an independent prognostic factor in patients with diffuse large B-cell lymphoma. British Journal of Cancer 110:369–374. doi:
10.1038/bjc.2013.763
20. Wilcox RA, Ristow K, Habermann TM, et al (2011) The absolute monocyte and lymphocyte prognostic score predicts survival and identifies high-risk patients in diffuse large-B-cell lymphoma. Leukemia 25:1502–1509. doi: 10.1038/leu.2011.112
21. Tadmor T, Bari A, Sacchi S, et al (2014) Monocyte count at diagnosis is a prognostic parameter in diffuse large B-cell lymphoma: results from a large multicenter study involving 1191 patients in the pre- and post-rituximab era. Haematologica 99:125–130. doi: 10.3324/haematol.2013.088161
22. Wilcox RA, Ristow K, Habermann TM, et al (2012) The absolute monocyte count is associated with overall survival in patients newly diagnosed with follicular lymphoma. Leuk Lymphoma 53:575–580. doi:
10.3109/10428194.2011.637211
23. Tadmor T, Bari A, Marcheselli L, et al (2015) Absolute Monocyte Count and Lymphocyte-Monocyte Ratio Predict Outcome in Nodular Sclerosis Hodgkin
90:756–764. doi: 10.1016/j.mayocp.2015.03.025
24. Porrata LF, Ristow K, Colgan JP, et al (2012) Peripheral blood
lymphocyte/monocyte ratio at diagnosis and survival in classical Hodgkin's lymphoma. Haematologica 97:262–269. doi: 10.3324/haematol.2011.050138 25. Azzaoui I, Uhel F, Rossille D, et al (2016) T-cell defect in diffuse large B-cell
lymphomas involves expansion of myeloid-derived suppressor cells. Blood 128:1081–1092. doi: 10.1182/blood-2015-08-662783
26. Galati D, Corazzelli G, De Filippi R, Pinto A (2016) Dendritic cells in hematological malignancies. Crit Rev Oncol Hematol 108:86–96. doi: 10.1016/j.critrevonc.2016.10.006
27. Tudor CS, Bruns H, Daniel C, et al (2014) Macrophages and Dendritic Cells as Actors in the Immune Reaction of Classical Hodgkin Lymphoma. PLoS ONE 9:e114345–24. doi: 10.1371/journal.pone.0114345
28. Chang K-C, Huang G-C, Jones D, Lin Y-H (2007) Distribution patterns of dendritic cells and T cells in diffuse large B-cell lymphomas correlate with prognoses. Clin Cancer Res 13:6666–6672. doi: 10.1158/1078-0432.CCR-07-0504
29. Bronte V, Brandau S, Chen S-H, et al (2016) Recommendations for myeloid-derived suppressor cell nomenclature and characterization standards. Nature Communications 7:12150. doi: 10.1038/ncomms12150
30. Gabrilovich DI, Nagaraj S (2009) Myeloid-derived suppressor cells as regulators of the immune system. Nat Rev Immunol 9:162–174. doi: 10.1038/nri2506
31. Parker KH, Beury DW, Ostrand-Rosenberg S (2015) Myeloid-Derived Suppressor Cells: Critical Cells Driving Immune Suppression in the Tumor Microenvironment. Adv Cancer Res 128:95–139. doi:
10.1016/bs.acr.2015.04.002
32. Gabrilovich DI, Ostrand-Rosenberg S, Bronte V (2012) Coordinated
regulation of myeloid cells by tumours. Nat Rev Immunol 12:253–268. doi: 10.1038/nri3175
33. Greten TF, Manns MP, Korangy F (2011) Myeloid derived suppressor cells in human diseases. Int Immunopharmacol 11:802–807. doi:
10.1016/j.intimp.2011.01.003
34. Youn J-I, Kumar V, Collazo M, et al (2013) Epigenetic silencing of
retinoblastoma gene regulates pathologic differentiation of myeloid cells in cancer. Nature Immunology 14:211–220. doi: 10.1038/ni.2526
35. Montero AJ, Diaz-Montero CM, Kyriakopoulos CE, et al (2012) Myeloid-derived Suppressor Cells in Cancer Patients: A Clinical Perspective. J Immunother 35:107–115. doi: 10.1097/CJI.0b013e318242169f
36. Görgün GT, Whitehill G, Anderson JL, et al (2013) Tumor-promoting immune-suppressive myeloid-derived suppressor cells in the multiple myeloma
microenvironment in humans. Blood 121:2975–2987. doi: 10.1182/blood-2012-08-448548
37. Wilcox RA, Feldman AL, Wada DA, et al (2009) B7-H1 (PD-L1, CD274) suppresses host immunity in T-cell lymphoproliferative disorders. Blood 114:2149–2158. doi: 10.1182/blood-2009-04-216671
38. Marini O, Spina C, Mimiola E, et al (2016) Identification of granulocytic myeloid-derived suppressor cells (G-MDSCs) in the peripheral blood of Hodgkin and non-Hodgkin lymphoma patients. Oncotarget 7:27676–27688. doi: 10.18632/oncotarget.8507
39. Lin Y, Gustafson MP, Bulur PA, et al (2011) Immunosuppressive CD14+HLA-DRlow/- monocytes in B-cell non-Hodgkin lymphoma. Blood 117:872–881. doi: 10.1182/blood-2010-05-283820
40. Gustafson MP, Abraham RS, Lin Y, et al (2012) Association of an increased frequency of CD14+ HLA-DR lo/neg monocytes with decreased time to progression in chronic lymphocytic leukaemia (CLL). British Journal of Haematology 156:674–676. doi: 10.1111/j.1365-2141.2011.08902.x 41. Jitschin R, Braun M, Büttner M, et al (2014) CLL-cells induce IDOhi
CD14+HLA-DRlo myeloid-derived suppressor cells that inhibit T-cell responses and promote TRegs. Blood 124:750–760. doi: 10.1182/blood-2013-12-546416
42. Romano A, Parrinello NL, Vetro C, et al (2015) Circulating myeloid-derived suppressor cells correlate with clinical outcome in Hodgkin Lymphoma patients treated up-front with a risk-adapted strategy. British Journal of Haematology 168:689–700. doi: 10.1111/bjh.13198
43. Gustafson MP, Lin Y, Maas ML, et al (2015) A method for identification and analysis of non-overlapping myeloid immunophenotypes in humans. PLoS ONE 10:e0121546. doi: 10.1371/journal.pone.0121546
44. Irish JM (2014) Beyond the age of cellular discovery. Nature Immunology 15:1095–1097. doi: 10.1038/ni.3034
45. Roussel M, Ferrell PB, Greenplate AR, et al (2017) Mass cytometry deep phenotyping of human mononuclear phagocytes and myeloid-derived suppressor cells from human blood and bone marrow. Journal of Leukocyte Biology jlb.5MA1116–457R. doi: 10.1189/jlb.5MA1116-457R
46. Tadmor T, Fell R, Polliack A, Attias D (2013) Absolute monocytosis at diagnosis correlates with survival in diffuse large B-cell lymphoma-possible link with monocytic myeloid-derived suppressor cells. Hematol Oncol 31:65– 71. doi: 10.1002/hon.2019
Lymphoma Treated with R-CHOP. Cell Physiol Biochem 39:521–530. doi: 10.1159/000445644
48. Kumar V, Patel S, Tcyganov E, Gabrilovich DI (2016) The Nature of Myeloid-Derived Suppressor Cells in the Tumor Microenvironment. Trends Immunol 37:208–220. doi: 10.1016/j.it.2016.01.004
49. Ugel S, De Sanctis F, Mandruzzato S, Bronte V (2015) Tumor-induced myeloid deviation: when myeloid-derived suppressor cells meet tumor-associated macrophages. J Clin Invest 125:3365–3376. doi:
10.1172/JCI80006
50. Mantovani A, Marchesi F, Malesci A, et al (2017) Tumour-associated macrophages as treatment targets in oncology. Nat Rev Clin Oncol. doi: 10.1038/nrclinonc.2016.217
51. Roussel M, Greenplate AR, Irish JM (2015) Dissecting Complex Cellular Systems with High Dimensional Single Cell Mass Cytometry. In: Montgomery RR, Bucala R (eds) Experimental Approaches for the Investigation of Innate Immunity. WORLD SCIENTIFIC, Singapore, pp 15–26
52. Murray PJ, Allen JE, Biswas SK, et al (2014) Macrophage activation and polarization: nomenclature and experimental guidelines. Immunity 41:14–20. doi: 10.1016/j.immuni.2014.06.008
53. Xue J, Schmidt SV, Sander J, et al (2014) Transcriptome-based network analysis reveals a spectrum model of human macrophage activation. Immunity 40:274–288. doi: 10.1016/j.immuni.2014.01.006
54. Fowler NH, Cheah CY, Gascoyne RD, et al (2016) Role of the tumor microenvironment in mature B-cell lymphoid malignancies. Haematologica 101:531–540. doi: 10.3324/haematol.2015.139493
55. Hasselblom S, Hansson U, Sigurdardottir M, et al (2008) Expression of CD68 tumor-associated macrophages in patients with diffuse large B-cell lymphoma and its relation to prognosis. Pathology International 58:529–532. doi:
10.1111/j.1440-1827.2008.02268.x
56. Shen L, Li H, Shi Y, et al (2016) M2 tumour-associated macrophages contribute to tumour progression via legumain remodelling the extracellular matrix in diffuse large B cell lymphoma. Sci Rep 6:30347. doi:
10.1038/srep30347
57. Kridel R, Steidl C, Gascoyne RD (2015) Tumor-associated macrophages in diffuse large B-cell lymphoma. Haematologica 100:143–145. doi:
10.3324/haematol.2015.124008
58. Farinha P, Masoudi H, Skinnider BF, et al (2005) Analysis of multiple
biomarkers shows that lymphoma-associated macrophage (LAM) content is an independent predictor of survival in follicular lymphoma (FL). Blood 106:2169–2174. doi: 10.1182/blood-2005-04-1565
59. Epron G, Ame-Thomas P, Le priol J, et al (2012) Monocytes and T cells cooperate to favor normal and follicular lymphoma B-cell growth: role of IL-15 and CD40L signaling. Leukemia 26:139–148. doi: 10.1038/leu.2011.179 60. Amin R, Mourcin F, Uhel F, et al (2015) DC-SIGN-expressing macrophages
trigger activation of mannosylated IgM B-cell receptor in follicular lymphoma. Blood 126:1911–1920. doi: 10.1182/blood-2015-04-640912
61. Canioni D, Salles G, Mounier N, et al (2008) High numbers of tumor-associated macrophages have an adverse prognostic value that can be circumvented by rituximab in patients with follicular lymphoma enrolled onto the GELA-GOELAMS FL-2000 trial. J Clin Oncol 26:440–446. doi:
10.1200/JCO.2007.12.8298
62. Taskinen M, Karjalainen-Lindsberg M-L, Nyman H, et al (2007) A high tumor-associated macrophage content predicts favorable outcome in follicular lymphoma patients treated with rituximab and
cyclophosphamide-doxorubicin-vincristine-prednisone. Clin Cancer Res 13:5784–5789. doi: 10.1158/1078-0432.CCR-07-0778
63. Kridel R, Xerri L, Gelas-Dore B, et al (2015) The Prognostic Impact of CD163-Positive Macrophages in Follicular Lymphoma: A Study from the BC Cancer Agency and the Lymphoma Study Association. Clin Cancer Res 21:3428– 3435. doi: 10.1158/1078-0432.CCR-14-3253
64. Rafiq S, Butchar JP, Cheney C, et al (2013) Comparative assessment of clinically utilized CD20-directed antibodies in chronic lymphocytic leukemia cells reveals divergent NK cell, monocyte, and macrophage properties. The Journal of Immunology 190:2702–2711. doi: 10.4049/jimmunol.1202588 65. Leidi M, Gotti E, Bologna L, et al (2009) M2 macrophages phagocytose
rituximab-opsonized leukemic targets more efficiently than m1 cells in vitro. The Journal of Immunology 182:4415–4422. doi: 10.4049/jimmunol.0713732 66. Aldinucci D, Celegato M, Casagrande N (2016) Microenvironmental
interactions in classical Hodgkin lymphoma and their role in promoting tumor growth, immune escape and drug resistance. Cancer Lett 380:243–252. doi: 10.1016/j.canlet.2015.10.007
67. Greaves P, Clear A, Owen A, et al (2013) Defining characteristics of classical Hodgkin lymphoma microenvironment T-helper cells. Blood 122:2856–2863. doi: 10.1182/blood-2013-06-508044
68. Azambuja D, Natkunam Y, Biasoli I, et al (2012) Lack of association of tumor-associated macrophages with clinical outcome in patients with classical Hodgkin's lymphoma. Annals of Oncology 23:736–742. doi:
10.1093/annonc/mdr157
69. Biswas SK, Allavena P, Mantovani A (2013) Tumor-associated macrophages: functional diversity, clinical significance, and open questions. Semin
70. Sander B, de Jong D, Rosenwald A, et al (2014) The reliability of
immunohistochemical analysis of the tumor microenvironment in follicular lymphoma: a validation study from the Lunenburg Lymphoma Biomarker Consortium. Haematologica 99:715–725. doi:
10.3324/haematol.2013.095257
71. Engblom C, Pfirschke C, Pittet MJ (2016) The role of myeloid cells in cancer therapies. Nat Rev Cancer 16:447–462. doi: 10.1038/nrc.2016.54
72. Ginhoux F, Schultze JL, Murray PJ, et al (2016) New insights into the
multidimensional concept of macrophage ontogeny, activation and function. Nature Immunology 17:34–40. doi: 10.1038/ni.3324
73. Greenplate AR, Johnson DB, Roussel M, et al (2016) Myelodysplastic Syndrome Revealed by Systems Immunology in a Melanoma Patient Undergoing Anti-PD-1 Therapy. Cancer Immunology Research 4:474–480. doi: 10.1158/2326-6066.CIR-15-0213
74. Bendall SC, Simonds EF, Qiu P, et al (2011) Single-Cell Mass Cytometry of Differential Immune and Drug Responses Across a Human Hematopoietic Continuum. Science 332:687–696. doi: 10.1126/science.1198704
75. Spitzer MH, Nolan GP (2016) Mass Cytometry: Single Cells, Many Features. Cell 165:780–791. doi: 10.1016/j.cell.2016.04.019
76. Saeys Y, Gassen SV, Lambrecht BN (2016) Computational flow cytometry: helping to make sense of high-dimensional immunology data. Nat Rev Immunol 16:449–462. doi: 10.1038/nri.2016.56
77. Wong MT, Chen J, Narayanan S, et al (2015) Mapping the Diversity of
Follicular Helper T Cells in Human Blood and Tonsils Using High-Dimensional Mass Cytometry Analysis. Cell Rep 11:1822–1833. doi:
10.1016/j.celrep.2015.05.022
78. van Unen V, Li N, Molendijk I, et al (2016) Mass Cytometry of the Human Mucosal Immune System Identifies Tissue- and Disease-Associated Immune Subsets. Immunity 44:1227–1239. doi: 10.1016/j.immuni.2016.04.014
79. Becher B, Schlitzer A, Chen J, et al (2014) High-dimensional analysis of the murine myeloid cell system. Nature Immunology 15:1181–1189. doi:
10.1038/ni.3006
80. Sen N, Mukherjee G, Sen A, et al (2014) Single-Cell Mass Cytometry Analysis of Human Tonsil T Cell Remodeling by Varicella Zoster Virus. Cell Rep 8:633–645. doi: 10.1016/j.celrep.2014.06.024
81. Horowitz A, Strauss-Albee DM, Leipold M, et al (2013) Genetic and environmental determinants of human NK cell diversity revealed by mass cytometry. Sci Trans Med 5:208ra145. doi: 10.1126/scitranslmed.3006702 82. Gaudilliere B, Fragiadakis GK, Bruggner RV, et al (2014) Clinical recovery
6:255ra131–255ra131. doi: 10.1126/scitranslmed.3009701
83. Mason GM, Lowe K, Melchiotti R, et al (2015) Phenotypic Complexity of the Human Regulatory T Cell Compartment Revealed by Mass Cytometry. The Journal of Immunology 195:2030–2037. doi: 10.4049/jimmunol.1500703 84. Hansmann L, Blum L, Ju C-H, et al (2015) Mass cytometry analysis shows
that a novel memory phenotype B cell is expanded in multiple myeloma. Cancer Immunology Research 3:650–660. doi: 10.1158/2326-6066.CIR-14-0236-T
85. Strauss-Albee DM, Horowitz A, Parham P, Blish CA (2014) Coordinated regulation of NK receptor expression in the maturing human immune system. The Journal of Immunology 193:4871–4879. doi: 10.4049/jimmunol.1401821 86. Bendall SC, Davis KL, Amir E-AD, et al (2014) Single-cell trajectory detection
uncovers progression and regulatory coordination in human B cell development. Cell 157:714–725. doi: 10.1016/j.cell.2014.04.005 87. Nicholas KJ, Greenplate AR, Flaherty DK, et al (2016) Multiparameter
analysis of stimulated human peripheral blood mononuclear cells: A
comparison of mass and fluorescence cytometry. Cytometry A 89:271–280. doi: 10.1002/cyto.a.22799
88. Guilliams M, Dutertre C-A, Scott CL, et al (2016) Unsupervised High-Dimensional Analysis Aligns Dendritic Cells across Tissues and Species. Immunity 45:669–684. doi: 10.1016/j.immuni.2016.08.015
89. See P, Dutertre C-A, Chen J, et al (2017) Mapping the human DC lineage through the integration of high-dimensional techniques. Science
356:eaag3009. doi: 10.1126/science.aag3009
90. Chevrier S, Levine JH, Zanotelli VRT, et al (2017) An Immune Atlas of Clear Cell Renal Cell Carcinoma. Cell 169:736–738.e18. doi:
10.1016/j.cell.2017.04.016
91. Lavin Y, Kobayashi S, Leader A, et al (2017) Innate Immune Landscape in Early Lung Adenocarcinoma by Paired Single-Cell Analyses. Cell 169:750– 757.e15. doi: 10.1016/j.cell.2017.04.014
92. Leelatian N, Doxie DB, Greenplate AR, et al (2017) Single cell analysis of human tissues and solid tumors with mass cytometry. Cytometry B Clin Cytom 92:68–78. doi: 10.1002/cyto.b.21481
93. Diggins KE, Greenplate AR, Leelatian N, et al (2017) Characterizing cell subsets using marker enrichment modeling. Nat Methods 14:275–278. doi: 10.1038/nmeth.4149
94. Diggins KE, Ferrell PB, Irish JM (2015) Methods for discovery and
characterization of cell subsets in high dimensional mass cytometry data. METHODS 82:55–63. doi: 10.1016/j.ymeth.2015.05.008
95. Giesen C, Wang HAO, Schapiro D, et al (2014) Highly multiplexed imaging of tumor tissues with subcellular resolution by mass cytometry. Nat Methods 11:417–422. doi: 10.1038/nmeth.2869
96. Chang Q, Ornatsky OI, Siddiqui I, et al (2017) Imaging Mass Cytometry. Cytometry A 91:160–169. doi: 10.1002/cyto.a.23053
97. Richardson DS, Lichtman JW (2015) Clarifying Tissue Clearing. Cell 162:246–257. doi: 10.1016/j.cell.2015.06.067
98. Xu J, Escamilla J, Mok S, et al (2013) CSF1R Signaling Blockade Stanches Tumor-Infiltrating Myeloid Cells and Improves the Efficacy of Radiotherapy in Prostate Cancer. Cancer Research 73:2782–2794. doi:
10.1158/0008-5472.CAN-12-3981
99. Qin H, Lerman B, Sakamaki I, et al (2014) Generation of a new therapeutic peptide that depletes myeloid-derived suppressor cells in tumor-bearing mice. Nat Med 20:676–681. doi: 10.1038/nm.3560
100. Gabrilovich DI (2017) Myeloid-Derived Suppressor Cells. Cancer Immunology Research 5:3–8. doi: 10.1158/2326-6066.CIR-16-0297
101. Suzuki E, Kapoor V, Jassar AS, et al (2005) Gemcitabine selectively
eliminates splenic Gr-1+/CD11b+ myeloid suppressor cells in tumor-bearing animals and enhances antitumor immune activity. Clin Cancer Res 11:6713– 6721. doi: 10.1158/1078-0432.CCR-05-0883
102. Vincent J, Mignot G, Chalmin F, et al (2010) 5-Fluorouracil selectively kills tumor-associated myeloid-derived suppressor cells resulting in enhanced T cell-dependent antitumor immunity. Cancer Research 70:3052–3061. doi: 10.1158/0008-5472.CAN-09-3690
103. Sakamaki I, Kwak LW, Cha S-C, et al (2014) Lenalidomide enhances the protective effect of a therapeutic vaccine and reverses immune suppression in mice bearing established lymphomas. Leukemia 28:329–337. doi:
Table I: Potential approaches for myeloid regulatory cells phenotype analysis
Immunohisto -chemistry/-fluorescence
Flow cytometry Mass cytometry
Main advantages
● Histology
● Direct cell-cell interactions ● Signaling (phosphoprotein, transcription factor)
● 10-18 parameters ● Single cell analysis ● Signaling (phosphoprotein, transcription factor)
● Dynamic (basal / after stimulation or co-culture) ● High dimensional analysis workflow
● Potentially combined with transcriptomic or functional analyses after sorting
● >40 parameters ● Single cell analysis ● Signalling
(phosphoprotein, transcription factor) ● Dynamic (basal / after stimulation or co-culture) ● High number of parameters ● High dimensional analysis workflow Limitations ● Expert interpretation needed ● Limited number of parameters ● No dynamic approach
● Dissociated cells ● Dissociated cells ● Expert analysis needed ● Number of cells required Current developments ● High-resolution confocal microscopy and 3D reconstruction ● Tissue clearing ● Increase number of
parameters, new fluorochromes
● Increase number of parameters, new metal tags
● New visualization tools ● Harmonization of analysis worflow ● Imaging mass cytometry
Figures
Figure 1: In B-cell lymphoma, myeloid regulatory cells engage various suppressive mechanisms
This figure is adapted from Gabrilovich et al. [32] and depicts mechanisms involved in MDSC immunosuppression. Mechanisms already described in B-cell lymphoma are unshaded whereas mechanisms not explored are shaded in grey. MDSCs can inhibit T cell responses through various mechanisms, 1) interference with T/NK cell migration and viability, 2) generation of oxidative stress by ROS and NO production, 3) deprivation in essential amino acids for growth and differentiation, and 4) Treg development and expansion. Ly: lymphocyte; NOX: NADPH oxidase complex; iNOS: inductible nitric oxide synthase; ARG1: arginase 1. Figure prepared using tools from Servier Medical Art (http://www.servier.com/Powerpoint-image-bank).
Figure 2: Mass cytometry reveals contrasting myeloid cell phenotypes between and within three lymphoma tumors
Cryopreserved cells from B-cell lymphomas (DLBCL, HL, and FL) were stained with a panel dedicated to the myeloid compartment [45]. A- After acquisition on CyTOF, cells were parsed by ViSNE to define B-, T-, NK-, and myeloid- cells following a workflow analysis already described [45, 94]. B- Due to the frequency of macrophages cells in TME from B-cell lymphoma, 5x10⁵ to 1x10⁶ viable cells were acquired on CyTOF. C- Macrophages from patients were then analyzed jointly by viSNE. A representative example of viSNE analysis is shown for myeloid cells from 3 patients: 1 DLBCL (green), 1 HL (blue), and 1 FL (brown) demonstrating differences in myeloid cell phenotype across these B-cell lymphomas.