HAL Id: tel-02982218
https://tel.archives-ouvertes.fr/tel-02982218
Submitted on 28 Oct 2020
HAL is a multi-disciplinary open access
archive for the deposit and dissemination of sci-entific research documents, whether they are pub-lished or not. The documents may come from teaching and research institutions in France or abroad, or from public or private research centers.
L’archive ouverte pluridisciplinaire HAL, est destinée au dépôt et à la diffusion de documents scientifiques de niveau recherche, publiés ou non, émanant des établissements d’enseignement et de recherche français ou étrangers, des laboratoires publics ou privés.
Molecular mechanisms of aneuploidy-mediated
stress-resistance
Andrei Kucharavy
To cite this version:
Andrei Kucharavy. Molecular mechanisms of aneuploidy-mediated stress-resistance. Molecular biol-ogy. Université Pierre et Marie Curie - Paris VI, 2017. English. �NNT : 2017PA066734�. �tel-02982218�
Thèse de Doctorat de L’Université Pierre et Marie Curie
Spécialité : Sciences de la VieEcole Doctorale Complexités du Vivant (ED 515)
Présenteé par
Andrei Kucharavy
Pour obtenir le grade de
Docteur de l’Université Pierre et Marie Curie
Molecular mechanisms of aneuploidy-mediated
stress-resistance
Sous la direction de:
Dr. Gilles Fischer
Biology of Genomes group
Laboratory of Computational and Quantitative Biology UMR7238, Université Pierre et Marie Curie,
Paris, France
Dr. Rong Li Rong Li Lab
Center for Cell Dynamics, Department of Cell Biology, Johns Hopkins University School of Medicine Baltimore, MD, USA
Soutenance prévue à l’UPMC le 8 décembre 2017 devant le jury composé de :
Renata BASTO, Directrice de recherche, Institut Curie Examinatrice Guillaume BELSON, Professeur à l’INSA Lyon Examinateur
Alessandra CARBONE, Professeur à l’UPMC Examinatrice
Gilles FISCHER, Chercheur CNRS à l’UMPC Directeur de thèse Nicholas SCHABANEL, Directeur de recherche, Paris Diderot Examinateur Olivier TENAILLON, Professeur l’Ecole Polytechnique Rapporteur
2
Summary:
Aneuploidy has historically been associated to detrimental phenotypes and human diseases, notably cancer, stillbirths and Edwards/Patau/Asperger syndromes. However, recent experimental discoveries suggest that this aneuploidy can as well provide adaptation to a large spectrum of stressors, be it from endogenous genome alterations or exogenous adverse
environment. In particular, aneuploidy has been shown to mediate drug resistance, making it a process of a particular importance for biomedical research. However, the molecular mechanisms by which the aneuploidy enables such adaptation remained elusive.
My PhD work focused on exploring several approaches to understanding the molecular
mechanisms that mediate the facilitation of adaptation by the aneuploidy. Frist, we have ab initio developed a general mathematical model of organism adaptation to adverse environments. This model suggests that the adaptation to environments takes place as a trade-off in a space of traits that could mediate fitness in an environment, with positions in this space representing trade-offs in adaption to different environments. Due to the pleotropic nature of its dosage effects,
impacting many genes and traits at once, the aneuploidy enables the organism to coarsely sample this space. During the sampling process, all aneuploids switch to trait combination further away from the optimum of the initial condition, hence loosing fitness in the old environment, but with some landing closer to an optimal trait combination in the new environment, hence gaining fitness in the new environment. That model was validated on experimental data and offered some insight into population genetics theory in general as well as development of models for multidrug resistant diseases. Second, we used the framework of executable biology and interpreted of biomolecular networks as directed weighted graphs, objects that can be studied from the
distributed computation point of view. We used this view to provide a possible explanation to the mechanisms allowing conditional essentiality in evolvable essential genes – genes considered as essential in normal environments, but that can be safely deleted upon aneuploidy induction. Third, we pushed this view of biomolecular networks carrying out the computation further, developing a model of information flow in biomolecular networks model to predict systemic effect of aneuploidy and determine the specific molecular effects underlying them. Fourth, we attempted to explore several possible modes besides dosage effects by which aneuploidy could
3 impact the gene expression regulation and affect organisms’ traits and developed image analysis toolkit that would make this task easier. Finally, we have attempted to use the theoretical results obtained throughout our PhD to predict the drug combination that would be able to target heterogeneous populations of breast cancer tumors in an optimal manner, resulting in several potentially interesting drug combinations.
4
Acknowledgments
First, I would like to acknowledge Drs. Rong Li and Gilles Fischer, my thesis
supervisors. I am extremely thankful to Dr. Rong Li for welcoming me in her lab, defining the scope of my PhD and providing just the right blend of freedom and supervision to allow me to efficiently progress in my projects. That guidance, both on a strategic and day-to-day basis provided to be invaluable to the advancement and success of my thesis as well as to my
development as a scientist. Rong’s talents for leadership and communication have set a high bar for me and an admirable example to follow. I would like to thank warmly Gilles Fischer for co-supervision, his support and constructive input on the projects, despite the distance between Baltimore and Paris, as well as the help with organizing the thesis committee meetings and the defense.
I would like to express a gratitude to Olivier Tenaillon and Feilim MacGabhan for agreeing to report on this thesis. I would like to thank as well as members of my PhD defense jury for making themselves available to assist to the defense – Renata Basto for such a rapid return from ASCB, Guillaume Belson for moving up from Lyon and Nicolas Shabanel for a responding on such a short notice. I am thankful to Alessandra Carbone for agreeing to preside my thesis jury. I would like to thank my thesis committee members as well – Judith Berman and Laura Ferri-Fioni for contributing their expertise over the course of my PhD to ensure it
remained on track throughout its course.
I would like to take time to thank two close collaborators specifically, Boris Rubinstein and Mehdi El Mhamdi, who not only contributed their extensive support, knowledge,
collaboration and advice to the advancement of this work, but as well for their deep and accurate insight into the nature of academia and interdisciplinary collaborations. I would like to thank Chuankai Zhou, Jin Zhu and Ines-Mendes-Pinto for early discussion and collaborations; Sree Ramachandran and Hung-Ji Tsai for teaching me the basics of yeast bench work; Linhao Ruan and Akshay Narkar for introducing me to their projects and providing the data to validate some tools and approaches developed throughout my PhD; Rubab Malik for her help with the
5 colleagues and provided a supporting environment throughout my PhD, but also managed to create a one-of-a-kind supportive and collaborative atmosphere, driving the unhindered sharing of knowledge and insights. I would like to thank BIG team as well, notably Nicholas Agier for teaching experimental techniques and Ingrid Lafontaine for testing out one of the early BioFlow prototypes.
I would like to take the time to thank the people whose administrative work in the background allowed this international PhD to take place and unfold in a reasonably smooth manner, notably Melissa Jeter, Dina Youngblood, Jinna Kim at Stowers Institute and Hopkins and Umbhauer Muriel, Elisabeth Clement, Sahida Minot, Samira Erraji, Emmanuèle Mouchel-Vielh of ED 515 Complexités du Vivant.
I would like to thank as well Beth Bauerly, Kristi Jensen, Dar Dahlen, Vasha Dutell, Kirsten Gotting, Aurimas and Marina Venero Galanternik and Joaquin Navajas Acedo a as well as other members of Stowers Graduate students for insightful discussion, feedback on my project and moral support, along with Katarina Sirka, Neil Neumann, Andrew Fraser and Shiva Razavi as well as the rest of the Center for Cell Dynamics Graduate students. I would like to particularly thank Vincent Mons for support and advice regarding the final stages of thesis. Along with them I would like to thank image analysis experts at Stowers, Jay Unruh, Brain Slaugter and Sarah Smith as well as Stowers bioinformatics core, notably Chris Seidal, Ariel Paulson and Madelaine Gogol and Dr. Muchael Schatz for teaching me in depth their respective fields.
Finally, I would like to thank my family, for a continuous support on the long journey towards the PhD. My grand-father for inspiring in my passion for the life sciences. My father, for teaching me the solid basics of quantitative sciences as well as demonstrating the factors crucial for advancement and finalization of a PhD project. Finally, my mother, for moral support and keeping an eye out for important things throughout my PhD.
6
Published content
Chapters 2 and 10 are the following publications:
Chen, G., Mulla, W.A., Kucharavy, A., Tsai, H.J., Rubinstein, B., Conkright, J., McCroskey, S., Bradford, W.D., Weems, L., Haug, J.S. and Seidel, C.W., 2015. Targeting the adaptability of heterogeneous aneuploids. Cell, 160(4), pp.771-784. Ruan, L., Zhou, C., Jin, E., Kucharavy, A., Zhang, Y., Wen, Z., Florens, L. and Li, R., 2017. Cytosolic proteostasis through importing of misfolded proteins into mitochondria. Nature, 543(7645), pp.443-446.
Chapters 3 is the following publication, submitted to Molecular Biology of the Cell: Kucharavy, A., Rubinstein, B., Zhu, J., Li, R.; Robustness and Evolvability of a Heterogeneous Cell Populations
Chapters 5, 6, 9 are the following manuscripts in preparation:
Kucharavy, A., Li, R.; Information flow framework for biological network analysis El Mhamdi, E.M., A Kucharavy, A., Guerraoui, R., Li, R.; Essential genes as evolutionary dead-ends in biomolecular networks
Kucharavy, A., Malik, R., Li R.; ImagePipe: a Python Framework for Biological Microscopy Analysis Pipelines
7
Table of Contents
Summary: ... 2
Acknowledgments... 4
Published content ... 6
Chapter 1: General Introduction: ... 8
Chapter 2: Targeting the adaptability of heterogeneous aneuploids – Geometrical model of adaptation ... 14
Chapter 3: Robustness and Evolvability of a Heterogeneous Cell Populations ... 16
Chapter 4: Prediction of drug pair forming an “evolutionary trap” for breast cancer ... 18
Chapter 5: Information flow framework for biological network analysis ... 29
Chapter 6: Essential genes as evolutionary dead-ends in biomolecular networks ... 33
Chapter 7: Experimental investigation of aneuploidy evolvability enhancing potential ... 35
Chapter 8: Experimental investigation of aneuploidy impact on intra-nuclear chromosome localization and motility ... 45
Chapter 9: ImagePipe: a Python Framework for Biological Microscopy Analysis Pipelines ... 50
Chapter 10: Example of application of ImagePipe: import of HS-aggregate related proteins into mitochondria ... 53
Chapter 11: General conclusion ... 55
8
Chapter 1: General Introduction:
Aneuploidy is a state of organism’s cells where the number of chromosomes is out of balance. Aneuploidies where chromosome copies are lost on a diploid background are called monosomies, whereas those where chromosome copies are gained are called trisomies (Fig. 1). In the context of cancer, with the large number of chromosomal rearrangements and formation of new chromosomes from the fragments of original cell’s chromosomes the aneuploidy of re-arranged chromosomes leads to a pattern of segmental amplification or losses in original chromosomes. Such aneuploidy is commonly referred to as segmental aneuploidy.
Figure 1: Aneuploidy vs Euploidy
Historically, whole-organism aneuploidy in humans is lethal before birth for all but 3 autosomal chromosomes and sex chromosomes. Whereas XXX and XYY aneuploidies lead to phenotypically normal females and males, every other configuration leads to a severe phenotype. For autosomal chromosomes aneuploidies, Chr 13 and Chr 18 trisomies correspond to Patau and Edwards’ syndromes, lethal respectively in the first week and first year of life (Baty et al. 1994). Finally, Chr 21 trisomy is associated to the ubiquitous Down syndrome (Lejeune et al. 1959, Jacobs et al. 1959). In addition to that, aneuploidy is a well-known hallmark of cancer, among the first distinctive features of cancer to be observed and described (Hansemann 1890). It is hence unsurprising that aneuploidy has long been considered as a purely disadvantageous trait, weighting down the cells and generating proteolytic stress due to gene copy number imbalance (Torres et al. 2008, Oromendia et al. 2012) and even considered as a potential Achilles Heel of cancer, allowing it to be targeted (Williams 2009).
9 This view of aneuploidy came under questioning starting from 2006, when (Selmecki et al. 2006) showed that C. Albicans, a microscopic unicellular fungus and opportunistic pathogen, whose resistance to drugs underlies a large fraction of organ transplant-related deaths, acquired resistance to Fluconazole with the gain of an additional copy of 5p chromosome arm. Selmecki et al. showed that loss of that additional copy of 5p led to re-acquisition of sensitivity to
Fluconazole and suggested that this effect was due to dosage effects of chromosome gains and presence of drug pumps as well as members of ergosterol pathway, that Fluconazole targets. A couple of years later, (Rancati et al. 2008) have shown that the potential of adaptability of
aneuploids was not limited to C. Albicans and Fluconazole alone. In their experiments, they have shown that aneuploidy allowed S. Cerevisiae to tolerate deletion of an essential gene, Myo1. Myo1 is considered essential due to the role it plays in the actomyosin ring contraction at the bud neck during cytokinesis. Rancati et al. have reported that after Myo1 deletion, aneuploid yeasts have developed several morphologically distinct modes of budneck contraction and once evolved, those modes were not due to Myo1 paralogs, given that re-introducing GFP-tagged Myo1 back did not lead to the GFP accumulation at the budneck in adapted aneuploids. In 2010, (Pavelka et al. 2010) have shown that these two instances of aneuploidy providing adaptive edge to yeast were not isolated, but rather a part of a larger pattern. By performing a growth assay of 38 stable isogenic aneuploids in 20 different environments, ranging from normal growth conditions to intense stress environments, Pavelka et al. have shown that the aneuploidy conferred adaptive advantage in every stress condition, provided that the condition imposed a sufficient stress. This suggested the existence of a mechanisms that would allow aneuploidy to enable adaptation to strong stressors. Combined with the results in Myo1, it also suggests that aneuploidy not only provides a rapid adaptation to stress, but that it can also accelerate the evolution of major adaptations. The mechanisms by which it is possible remained unclear and elucidating them was the central goal of my thesis.
During my PhD thesis, I have investigated several approaches to solving this problem. The first approach, described in the chapters 2-3, consisted in developing a general mathematical model of environment-specific adaptation. This model was developed based on two assumptions.
10 First, based on a general insight about the statistical properties about random large-scale perturbation to gene expression levels on pathways, such as present in aneuploidy, suggesting that aneuploids with random chromosome number alterations could follow a normal distribution in a trait space, in the virtue of the law of large numbers. Second, a biological insight suggesting that during the first stages of the adaptation to adverse environments, the adaptation doesn’t occur via acquisition of traits that are beneficial in all environments, but rather through the re-balancing of traits’ pro-eminence, leading to increased adaptation to some environments and lower adaptation to others. At first, our model allowed us to quantitatively explain the
experimentally observed correlation between the environment stress intensity, mean and standard deviation of relative fitness of aneuploids compared to euploids in aneuploid yeast as well as to describe a framework that would allow us to design a two-step “evolutionary trap” for rapidly adapting pathogens and cancer. This model was incorporated into the (Chen et al. 2015) paper and is corresponding to the publication in the chapter 2.
Despite the initial success with the application of our model, some of our model’s
parameters were under-explored and that the core of our model was so simple it would have been unlikely were the first to come up with it. The next step was a more in-depth investigation of the model from a mathematical point of view, exploring its limitations as well as the parameters representing the robustness we introduced into our model. A literature review has shown that our model shared the formalism with the Fishers Geometrical model of evolution, a model developed by sir Ronald Fisher in the 1930th to reconcile the Mendelian and biostatistics approaches to genetics and still an object of active research to this day for population genetics field. While some of the insights we gleaned from our model had corresponding results in the Fisher’s geometrical model community, our model resolved several questions that has remained long unanswered in the population genetics community, such as feasible experimental measurement of organism’s trait space complexity and robustness. To be able to measure these two parameters in a population where the reference population was unclear, our model required the development of an algorithm enabling us to find the reference population based on the fitness in different environments. The application of our model to the data coming from the drug screens in human breast cancer cell lines led us to the identification of a multidrug resistant cancer cell line that we suggest could be used to model the breast cancer overall. These results are the object of the publication currently in submission, presented in the chapter 3.
11 Given our access to the data concerning the sensitivity of breast cancer cell lines to drugs, a natural second step in our investigation was to check if we could find a pair of drugs that could be good candidates for a two-step therapy, creating an evolutionary trap, such as described in our (Chen et al. 2015), that would be able to effectively target the adaptive strategies in which breast cancer cell lines could engage thanks to the aneuploidy. Our analysis assumed that the breast cancer cell line collection represented well the diversity of breast cancer cell clones in real breast cancers and that a successive application of two drugs on the cells would lead them to follow a pattern of growth that would be well approximated by the product of their growth ratios in two drugs separately. Once we accounted for the specificity of drug action on cancer cells by normalizing to non-tumorigenic cell lines derived from the normal epithelial cells present in human milk, our analysis suggested several approved drug combinations that appeared to be promising candidates for creating an evolutionary trap for breast cancers. Validation of the drug combinations requiring an expensive experimental chain, this aspect of the project has not been completed. The analysis outline and results, as well as the link to the related code can be found in the Chapter 4.
My second approach to understand the effect of aneuploidy was more focused on
identifying and interpreting concrete systemic impact of aneuploidy on the organism. To do this, I have used a model of biological systems as an executable distributed computing system and performed back-tracking of nodes most likely involved in the computation perturbation related to a phenotype alteration. It was based on the insight into the equivalence the first-order
approximation of the causal Bayesian networks and current flow in weighted graph. The resulting formalization led to a development of a tool integrating several biomolecules
interaction repositories that could serve as a support for biological computation and calculate the flow in the resulting possible computation support graph between groups of nodes. Application of this tool has resulted in explaining why the Chr15 gain resulted in the resistance to Radicicol without a single gene being responsible for the resistance on its own. The framework, tool and the results are an object of a publication currently in preparation and are presented in the chapter 5.
12 Building up on the view of biological systems as executable distributed systems, we have used recent advances in theory of distributed computation within directed weighted graphs robustness. By applying estimates of the bounds on the number of critical nodes in neural networks to biological networks corresponding to critical function-specific pathways, we could retrieve estimates of the essential genes, lethal interactions and evolvable essential genes close to the experimentally observed values. Given the predictive power of our model, we suggest that viewing biological organisms as distributed computing directed graphs learning an optimal environment to response function through evolution is highly promising and could be used to explain phenotypes with complex omnigenic basis (Boyle et al. 2017), as well as recent results in search for human essential genes based on the CRISPR-Cas9 systems in cell lines (Fraser 2015). These results are presented in a publication currently in preparation, presented in chapter 6.
This approach suggested that not only aneuploidy was able to provide immediate adaptation to stress, in the virtue of dosage effects, as results in Chapters 2 and 3 suggested, but consistently with results in chapter 3 and 6, was also able to accelerate the evolution. To explore the acceleration of evolution specifically, I have re-analyzed the yeast growth curves from (Pavelka et al. 2010) in search of aneuploids that would lag for a long time and grow rapidly to examine if we were observing instances of stochastic adaptation events allowed by aneuploidy, but not due to its dosage effects directly. Preliminary results seemed to confirm this hypothesis, but due to the lab move experiments had to be interrupted. The preliminary results are presented in the chapter 7.
My third approach to investigate the relationship between aneuploidy and stress adaptation was to look beyond direct dosage effects. In yeast, the transcription is regulated at least in part by 3D genome conformation and localization, which can possibly be thrown off by some aneuploidies. To investigate this possibility more closely, I’ve attempted to track the movement of a chromosome segment tagged with a LacO/LacI-GFP array system. Unsuccessful, at first due to the issues in stability of one of the fluorescent protein and later due to the move into the lab, the outline of the experiments is presented in the chapter 8.
This investigation led to the development of a toolbox to analyze 3D and 2D microscopy images, which is presented in a publication in preparation, available in the chapter 9. In turn, this
13 toolbox was used to characterize the HS aggregate proteins import into mitochondria in response to stress in (Ruan, Zhou et al 2017). This paper corresponds to the chapters 10.
14
Chapter 2: Targeting the adaptability of heterogeneous
aneuploids – Geometrical model of adaptation
The mathematical modelling of the relationship between the robustness and evolvability of heterogeneous cell populations started as an observation that in the aneuploid growth assay data from (Pavelka et al. 2010), that the relative fitness of aneuploids compared to euploids followed a peculiar relationship. Aneuploids always performed worse off that euploid cells when grown in rich medium. As the intensity of stress coming from the environment increased, the mean fitness of aneuploids relative to euploids dropped. However, at the mean relative fitness of aneuploids dropped, the standard deviation of the relative fitness also increased in a way that guaranteed that there always were aneuploid outliers with a fitness superior to the euploids. The degree to which those outlier aneuploids fared better than euploids also increased with the intensity of the stress. Due to the design of the assay that was measuring the fitness and post-screening validation steps, we were sure that this heterogeneity was not due to the measurement noise at low fitness. Instead, this pattern was indicating that aneuploidy was inducing fitness heterogeneity for a variety of stresses, guaranteeing that at least one of the aneuploids would be more adapted to the stress environment than the euploids.
Despite the importance of this pattern to the adaptability, we had no idea to what it was due. Hence, we set off to derive a minimal biologically sound model that could explain the data at hand. Our initial inspiration came from the Weibull distribution (Weibull 1939), which is one of the most common distributions used to describe the non-random failures, commonly used in civil engineering and component quality control. In the search of the fundamental mathematical reasons that would explain why such different processes would follow a common distribution, we came to realize that Weibull was an instance of a general class of extreme values
distributions, that were generated by a large class of underlying distribution and mechanisms driving them and did not depend on the underlying distribution, provided some conditions were satisfied. Our second intuition was to look for the classes of distributions that aneuploidy could generate on molecular level, that could impact adaptation to almost all the stresses, regardless of the nature of molecular adaptations required to adapt to them. We noticed that aneuploidy leads to an approximately random perturbation of the proteome and that functional effects of those
15 proteins are due to their participation in complexes and pathways. Given that the Gaussian
distributions are additive attractors with respect to summation of values sampled from other distributions, this lead us to suggest aneuploidy was leading to a random, approximately gaussian variation of functional pathway activity levels. The attractor nature of the Gaussian distributions is due to their max-entropy nature for a fixed mean and standard deviation and is commonly introduced in statistics textbooks as a consequence of the Central Limit theorem (CLT).
However, there are more relaxed formulations of Central Limit theorem, notably the Lyapunov CTL criterion that could be satisfied by the random pathways perturbations due to aneuploidy in a pathway space. In turn, if we assumed a convex function that mapped pathway deviation from a target combination from an optimum for a given environment to a fitness, as well as assumed that the pathway space could be represented as a scalar space with fitness decaying uniformly according to an L2 (Euclidian) distance, we arrived at a model that could recapitulate the pattern of interest.
The development of this model, as well as mapping of biological assumptions to mathematical formalism as well as the implementation of the simulation and data regression code in collaboration with Dr. Boris Rubinstein were my core contributions to the article that constitutes the core of this chapter.
16
Chapter 3: Robustness and Evolvability of a Heterogeneous
Cell Populations
While the model introduced in the Chapter 2 allowed us to explain the experimentally observed relative fitness distributions across stress environments for aneuploid yeast, its relationship to existing models, as well as meaning and influence on the model’s behavior of some of the parameters remained insufficiently explored. In addition, while we suggested that our model could be applied to other biological systems beyond yeast, notably cancer, the reference euploid population was not necessarily clearly defined.
Chapter 3 presents a more in-depth work on exploring the model from a theoretical perspective. Here, we derive a closed formula solutions as well as approximate closed form solutions for the standard deviation and mean of the relative fitness. We as well define the
properties of a phenotypical reference population and offer an algorithm describing how to detect a reference population. Here, we explore more in depth how our model behavior depends on the convexity of the function mapping the traits deviation from the environment optimum to the fitness (robustness factor) and establishes the link between our model and the well-known Fisher’s geometric model in population genetics, introduced by sir Ronald Fisher to reconcile Mendelian genetics and Biostatistics in the early 1930th.
The impact of this modelling work however goes beyond the confines of aneuploidy and adaptation to stress. Due to its formal similarity with Fisher’s Geometrical model, our model provides an insight as well for the field of population genetics, especially with regards to measuring the complexity of the phenotypic space experimentally, as well as estimate the robustness of the organism. Due to the heterogeneity of cancer and the importance that this heterogeneity plays in allowing it to acquire drug resistance, our search for a reference population in a cancer cell line population yielded a likely candidate to model a multidrug resistant cancer cell line.
For this article, I have contributed to the article writing, figure generation,
conceptualization of the model, review of articles in population genetics, mathematical model formalization, raw data extraction through code as well as invention and implementation of the algorithm for phenotypic reference population detection based on the fitness in a set of
17 environments data. Boris Rubinstein provided help with closed form solution derivation and parts of Mathematica code used for regression. Jin Zhu provided previously unpublished data for non-normalized yeast aneuploid fitness in a large set of environments.
18
Chapter 4: Prediction of drug pair forming an “evolutionary
trap” for breast cancer
In this chapter, we attempted to apply our mathematical model of adaptation to a concrete rapidly evolving biological system – breast cancer. Our goal is to design an “evolutionary trap”, as described in the chapter 2 - a pair of drugs that would efficiently cover the entire trait space available for the breast cancer cell lines and hence ensure that even multidrug resistant breast cancer cell populations can be targeted and eliminated.
To do this, we rely on the data from the cancer pharmacogenomics screen assay performed and published previously (Daemen et al., 2013; Heiser and Sadanandam, 2012). In their screen, authors use a collection of 70 breast cancer cell lines, which they tested for growth inhibition by a palette of concentration of 90 different therapeutic compounds, ranging from 10e-8 10e-3 molar for 72 hours. Their screen included several lines of non-tumor-inducing
immortalized breast epithelia as a reference population, as well as pulled together a highly diverse therapeutic compound set, with vastly different modes of action, for a number of them not even targeting cancer specifically.
We were interested in finding the combination of drugs that, at given concentrations, would have had a complementary killing effect on the breast cancer cells, while leaving non-tumorigenic cells grow. To find such a pair of drugs, we made three assumptions. First, we assumed that the breast cancer cell lines, as well as immortalized non-tumorigenic epithelial cell lines responded to the drugs similarly to the breast cancer cells inside patients. Second, we assumed that the breast cancer cell lines were sampling the available trait space in a saturating manner – in other terms they were representing all the space breast cancer cell lines could explore to escape from evolutionary pressure imposed by drugs. Our final assumption was that the action of drugs on the breast cancer for the successive application of two drugs to a cancer cell lines for 72 hours each could be represented as a product of the factor (f) by which the cells grew (f>1) or were killed (f<1) during that period.
First, we needed to process the raw data supplied by (Damien et al. 2013). The data contained a different number of replicates for each compound – cell line pair, as shown in the Figure 2 below. Given that the proxy for cell proliferation and fitness chosen by authors was
19 change in optical density, we needed to account for the acquisition error margin of the
instruments. To do this, for each 96 well plate in which the assays were performed, we calculated the Optical Density (OD) of four empty wells. Ideally, their OD would all be set to 0, but in reality, we observed a curve centered about 100 OD units (figure 3, black), that was
approximately gaussian (figure 3, green, distortion due to binning). We also noticed that several plates had control wells contaminated, with ODs in the range of several thousands. We discarded those plates from further analysis. In addition to that, we transformed our OD measurements from arbitrary OD units into the units corresponding to the SD of the instrument precision.
Given the number of replicas present for some compound/cell line combinations, our first step was to group them to increase the precision of measurement of the underlying response function. Each plate contained 3 replicas of cell lines for each drug concentration. After calculating the mean and standard deviation of replicas on each plate, we grouped them into single data points, such as visible in figure 4 and then proceeded to grouping replicates from different plates. This presented some challenges. First, some of the replicates presented growth curves showing no difference in the OD between different drug concentrations (semi-transparent data points on the figure 4). We assumed that this was due to those plates receiving a
non-working drug sample or incubated in wrong conditions. Due to this, we have eliminated all the drug concentrations that where a difference of less than 10 instrument SD units was observed between minimal and maximal drug concentration. Due to the different starting ODs and batch effect variation between different plates, some of the replicates being as dissimilar in their growth curves as different cell lines, as shown in Figure 5.
20 Figure 2 Number of growth inhibition assay replicas for the cell lines (X) and therapeutic
compounds (Y)
Figure 3 Distribution of ODs of background wells. Black is data, green is gaussian fitting. X are arbitrary author's OD units, Y is distribution density.
21 Figure 4 Dilution curves for three cell lines with replicates. X is concentration in molar (log), Y
is OD. By convention, left-most points correspond to the OD without a drug, regardless of the position on the X axis, due to the log-nature of X axis.
22 Figure 5 Dilution curves for the cell lines three different cell lines in the same drug. Grey correspond to replicas of the same cell line, for the same concentrations. Green and red are biological replicates of the same cell line. X axis is the concentration of the drug (log), Y axis is OD after a growth period in instrument standard deviation units. By convention, left-most points
correspond to the OD without a drug, regardless of the position on the X axis, due to the log-nature of X axis.
One of the possible ways of going around this problem is by normalizing the ODs to a reference value. The reference value can either be the OD without any compound added for the same cell line on the same plate, or it can be the OD of the well before the assay started. Given that both values are provided by the authors of the original assay, this is mostly a question of which normalization is more representative of the question we are asking. In the case of relative fitness in the environment, described in chapter 3, we were interested in the fitness relative to the possible fitness maximum. In that case it made more sent to normalize the fitness relative to the largest fitness possible – hence the OD without drugs. In this case, we are interested in the
23 growth of cancer cell lines relative to the normal breast epithelia cell lines. In this case, it makes more sense to normalize the growth the initial OD, as shown in the figure 6 below.
Figure 6 OD after growth period in the presence of drug relative to the initial OD. X axis is concentration (log), Y axis is the relative growth. By convention, left-most points correspond to
the OD without a drug, regardless of the position on the X axis, due to the log-nature of X axis. Following this normalization, the points were polled together and the final growth ratio was calculated for each drug concentration. Our next step was to find all the maximal
concentrations of drugs that allowed at least one of the cell lines that were derived from normal epithelial cell lines to grow. This was done to model the maximum tolerated dose in cancer. Following that, we calculated the relative killing coefficient for each drug at the maximum tolerated dose according to the following formula:
2 2 2 1 1 2 1 f f f f f f Ckilling
24 Where f and 1 f are vectors corresponding to the action factors of a therapeutic 2
compounds 1 and 2 respectively, denotes an element-wise multiplication and denotes an L2 norm (Euclidean distance). Normalization of the combined action of two drugs by the square root of the mean action of each drug twice allows us to account for the drugs with a strong and widely distributed action potential and concentrate on the pairs of drugs that are synergistic in their action pattern. We then eliminated all the drug combinations with a common support of less than 5, in other terms all pairs of drugs with less than 5 breast cancer cell lines tested in both drugs. This provided us with the distribution of relative killing coefficients shown in the figure 7 below. It is important to remind that since the action factor f represents the ratio by which the cells grew (f>1) or were killed (f<1) from the initial OD, the lower the relative killing
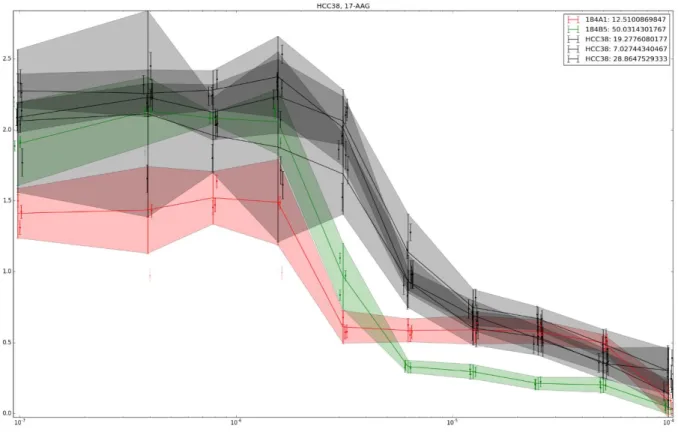
coefficient, the better is the synergy between the drugs. Figure 8 below represents 5 lowest relative killing coefficient action profiles across different breast cancer cell lines.
25 Figure 7 Relative killing coefficients. The lower the coefficient, the more synergistic the drug
pairs are. Lines and columns are identical, labels are: drug name - maximum tolerated concentration - average growth factor f across the cancer cell lines. Only relative killing
26 Figure 8 Action profiles of 5 most synergistic drug pairs. First two columns represent the action
factors for every breast cancer cell line, the last column - their element-wise product, representing the successive application of two drugs. Action factor color bar was clipped at 2.0
for the ease of interpretation.
The analysis of 10 most synergistic pairs for the most potent overall killing highlighted four pairs of drugs:
- Vorinostat (HDAC inhibitor) – Mebendazole (targets uTubuline in pinworm, most likely in cancer as well)
- CGC-11144 (polyamine analog, targets Estrogen Receptor alpha) – Oxamflatin (HDAC inhibitor)
- Trichostatin A (HDAC inhibitor) – Mebendazole (targets uTubuline in pinworm, most likely in cancer as well)
- PF-4691502 (PI3K/mTOR) - CGC-11144 (polyamine analog, targets Estrogen Receptor alpha)
27 Mebendazole came up twice in that 10-set, combined with Trichostatin A and Vorinostat, both HDAC inhibitors targeted at tumors, although not breast cancer specifically. This
combination is particularly interesting, because Vorinostat is an HDAC inhibitor has been FDA-approved for cutaneous T-cell lymphoma treatment (Duvic et al. 2007) and Mebendazole has been approved by FDA for pinworm treatment in the 1970 and over the last decade has attracted a lot attention due to its ability to inhibit cancer growth and lead to tumor shrinking
(Mukhopadhyay et al. 2002, Nygren et al. 2013), as well as published clinical cases where its administration led to patient remission (Dobrosotskaya et al. 2011, Nygren et al. 2014). It is as well interesting to notice that out of 3 cell lines outside the reference immortalized breast epithelia cell lines the Trichostatin A/Mebendazole combination struggled, two (MCF10A, MCF10F) cell lines are non-tumorigenic epithelial cell lines derived from fibrocystic disease samples, suggesting a high specificity of this drug combination to tumorigenic cell lines and a high coverage of those cell lines.
We were not able to confirm our evolutionary traps experimentally, due to a lack of experience with and funding to support Patient-derived Xenograft mouse model experiments, the current golden standard in pre-clinical trials. The search for funding and collaborations allowing to validate the combination is currently under way. It seems that other teams have arrived independently, by using different approaches, to the suggestion of Mebendazole and HDAC inhibitors as synergistic pairs of drugs (Kipper et al. 2017).
The code used to perform this analysis can be found in
https://github.com/chiffa/Pharmacosensitivity_growth_assays.
29
Chapter 5: Information flow framework for biological
network analysis
Our quantitative models explaining the beneficial effect of aneuploidy on the robustness were a promising start. However, we knew that in yeast, adaptation to specific stresses is mediated by aneuploidies with specific patterns. For instance, Radicicol resistance in S.
Cerevisiae is conferred specifically by the chromosome 15 gain (Chen et al. 2012). In cancers,
specific segmental aneuploidies are associated to specific cancers, such as Chromosome 10 loss to glioblastoma multiforma (von Deimling et al. 1992).
Thanks to the genomic characterization of the breast cancer cell lines throughout the last 15 years, both from the sequencing and DNA CHIPs, we can quantify large-scale segmental aneuploidy in cancer with HMM, as represented in the figure 9 below (code used to generate it available at https://github.com/chiffa/Karyotype_retriever). Once we separate the large-scale segmental aneuploidy in a collection of 53 breast cancer or breast epithelia immortalized cell lines (Neve et al. 2006) from the local amplification, and look at the former (figure 10 below), we can see a specific pattern of common losses and gains of chromosomes.
30 Figure 9 HMM regression of large segmental aneuploidy in breast cancer cell lines. First lane - remainder of the regression; second lane - regression of the original DNA abundance per locus data from DNA-CHIP; third lane – the amplitude of gains or losses inferred by the HMM at a given pass (red-gain; blue-loss; color saturation indicates intensity); fourth lane – HMM-detected
gain (red) or loss (blue); last lane – remainder remaining after each of the passes. Rainbow-colored line on the top of the last 3 lanes marks the chromosomes.
31 Figure 10 Pattern of segmental large-scale aneuploidy across 51 breast cancer cell lines and two
non-tumorigenic epithelial cell lines derived from breast fibrocystic disease. Bottom path represents the statistical significance threshold for how frequently or rarely the section is gained
or lost according to a Chi2-test.
We can observe on the figure 10 commonalities in the gain and loss pattern of large segments of chromosomes across many different strains, notably the 1q, 8p/q, 18q and 20q. Amplifications or losses that seems to be so wide-spread that we can assume that they are not due to random perturbations, but play a functional role in adaptation. Predicting an impact of a large-scale protein perturbation, affecting hundreds or thousands of genes at a time could play a crucial role in improving our understanding of cancer progression as well as its response to drugs, evolution and acquisition of metastatic phenotype as well as multidrug resistance. If this method could integrate multiple data types used to characterize the cancer all together, such as large-scale alteration due to aneuploidy, mutations affecting sets of genes and provide a systemic insight into it, its value would be even higher.
This was specifically the goal with which the Information flow framework was formalized and BioFlow tool was programmed. Despite some successes with validating it, notably with Chr15 distributed synergistic action on HSP82, target of Rapamycin, consistent
32 with the Rapamycin resistance provided by Chr15 gain aneuploidy in yeast (Chen et al. 2012), the BioFlow tool had trouble with inferring aneuploidy systemic effect based on the DNA
abundance alone. We strongly suspect that this was due to the lack of integration of transcription and translation regulation relationships into our model. Transcription and translation regulation are complex processes in eukaryotes, involving multiple layers of epigenetic regulation and adaptor proteins, mediating transcription complex assembly and transcription initiation. Because of that, in aneuploidy, while on average, gene transcription level on supernumerary or lacking chromosomes correlates with gain or loss of chromosomes, individual genes regulation is altered more randomly (Pavelka et al. 2010). Unfortunately, due to an absence of a machine-readable, unbiased, high coverage repository of transcription and translation regulation relationships between molecular entities, BioFlow cannot account for that transcription and translation regulation and needs at least mRNA level quantification of gene activity disruption.
33
Chapter 6: Essential genes as evolutionary dead-ends in
biomolecular networks
Following the formalization of information flow based on the view of biomolecular networks as support for distributed biological computation, introduced in the previous chapter, it is only logical to ask oneself if it is possible to further exploit the distributed computation
abstraction. To investigate this question more in depth, I have set up a collaboration with El Mahdi El Mhamdi, a PhD student in distributed computation at Rachid Guerraoui’s lab at EPFL. His domain of expertise is mathematical analysis of distributed computation system from the point of view of graph theory. In his recent work on the robustness of neural networks, he has introduced a theoretical mean of calculating the bounds on the number of critical nodes in the directed weighted graphs (El Mhamdi, 2017). Critical nodes are nodes whose disruption leads to the failure of the entire distributed computation process and are hence good theoretical models for the essential genes in biological organisms.
In this project, our premise was that if we abstracted ourselves from the molecular mechanisms of biomolecular interactions in biological organisms, we could see the entire biomolecular network as a directed graph, acting as computational support for the “environment response function”, that maps the environment state to a response allowing optimal growth and proliferation. It has been theoretically proven, that the weighted directed graphs with non-linear nodes can approximate to a high degree of precision any function (Hornik et al. 1989), provided a sufficiently large node and edge support and a “feedback” function pushing them to
approximate that function better and better. For instance, it has also been shown that artificial neural networks, implementing such approach, are capable of mapping contents of an image to words in human speech in both direction (LeCun 2015), a relationship that despite the best attempts could not have been formalized by experts in machine learning over the 50 years before the advent of deep convolutional networks. From that perspective, our view of biomolecular networks as a distributed computation graphs could provide an insight into the recent results in complex traits involving a large number of genes (Boyle et al. 2017), as well essential genes characterization in human cell lines (Fraser 2015).
34 To validate our approach, we first attempted to check if our model could predict the statistics of essential genes, lethal interactions and evolvable essential genes (Liu et al. 2016) – genes whose deletion was no more lethal upon induction of aneuploidy. This application showed that our model could predict those distributions with high accuracy, despite its simplicity and that its predictions were specific to the statistical properties of yeast biomolecular network. El Mahdi El Mhamdi contributed his mathematical expertise and insight into distributed computing, whereas I provided the connection of distributed computing abstractions to biological problems and performed simulations that to validate our model and biological data extraction from source publications. The redaction of manuscript was split equitably between the two of us.
35
Chapter 7: Experimental investigation of aneuploidy
evolvability enhancing potential
Following the results of chapter 3 and chapter 6, we knew that aneuploidy could provide an immediate adaptation to stress environments due to its dosage effect, thanks to the shift in the trait space and re-distribution of stress load away from the nodes in biomolecular network that are critical in normal conditions. However, the results of these two chapters also seemed to indicate that aneuploidy could also increase the evolutionary potential of biological systems, similarly to polyploidy (Selmecki et al. 2015). Our models suggested several mechanisms by which it could be happening. Our model in chapters 3 suggest that aneuploidy could provide a starting point in the trait space from which a viable trait combination could be reached in a single mutation or epigenetic perturbation. Our model in chapter 6 suggested that aneuploidy enabled organisms to undergo mutations that would have been lethal without the aneuploidy. At that point, an experimental observation of a non-deterministic adaptation event due to aneuploidy was critical for us to validate our model predictions.
We set out to find traces of such adaptability enhancement events in the yeast growth inhibition assays from (Pavelka 2010). A large number of growth curves for stable yeast aneuploids on plates containing a therapeutic substrate or in a stressful conditions have been generated by the original authors of the assay. An example of an image representing a single time point in the growth assay is visible below, in the figure 11. A combination of time points collected for the same stable aneuploid – drug combination yielded a growth curve, visible in the figure 12. To retrieve the parameters of growth assay, we have regressed the observed growth curve (red points) by a logarithmic, saturated growth (black line), according to the formula
) ( 0 1 e k x x L OD
Where, OD is optical density, L is maximum carrying capacity of the media, k is the growth speed and x is the growth starting point. The regression was performed by using custom 0
code based on scipy.optimize.least_squares and available at
36 Aneuploids / environments combinations where aneuploidy allows evolution of
adaptation rather than providing a strong initial adaptation would display a delayed growth start compared to the euploids in the same environment, as well as a strong dispersion with respect to growth speed, with the growth speed in some aneuploids sometimes significantly exceeding one in euploids. To detect such events, we generated cross-plots, such as presented in the figure 13. Each image corresponded to an experimental condition and each cross to a set of replicas of stable aneuploid or euploid cell lines, otherwise isogenic. X and Y corresponded to growth start delay and growth speed relative to the haploid strains, respectively, whereas the cross arms lengths corresponded to the standard deviation of each parameter. In such plot, a potential adaptation corresponded to a growth speed that was faster than the reference haploid and a delayed growth start, with a large standard deviation for the growth speed. To confirm that it was indeed due to a single strong adaptation event, the promising growth curves were then explored manually.
37 Figure 11: Example of growth assay plate at the end of growth period with dynamically selected
38 Figure 12 Growth curve from experimental data (red) regressed with log-saturated growth
39 Figure 13 Cross-plot highlighting in red stable aneuploids that have potentially underwent stochastic adaptive evolution. Black - reference haploid; X axis is the growth start (hours), Y is
average relative fitness compared to reference haploid. Cross arms are standard deviations. One of the promising combinations of environment and stable aneuploid was A2 strain in Rapamycin. A2 strain is an aneuploid with haploid background and disomic for chromosomes 2 and 12. An experimental protocol to check if aneuploidy allowed stochastic adaptation was designed. According to that protocol, the reference haploid strain (2626-1 in the table below) and several isogenic A2 aneuploid strains corresponding to different spots upon unfreezing from glycerol stock (A2-1, A2-2, A2-3) were plated on a plate, alternatively in YPD+Glucose rich medium or YPD+Glucose with an addition of Rapamycin to a final concentration of 6.84 nM. To avoid the edge effects, edge wells were left empty. To determine the timing of a possible
contamination, contamination controls were implemented in the outer ring of blank wells, into which the tip used for pipetting the culture was dipped. The contamination controls provided the latest time at which the growth could be due to cross-contamination. All the replica wells were inoculated from the same liquid stock in the exponential phase. The plate design is visible in the table below.
40
1 2 3 4 5 6 7 8 9 10 11 12 Rapa
a
BLANK BLANK BLANK C_ctrl BLANK BLANK BLANK BLANK C_ctrl BLANK BLANK BLANK
b
BLANK 2626-1 2626-1 A2-1 A2-1 A2-2 A2-2 A2-2 A2-3 A2-3 A2-3 BLANK 0
c
BLANK 2626-1 2626-1 A2-1 A2-1 A2-2 A2-2 A2-2 A2-3 A2-3 A2-3 BLANK 0
d
BLANK 2626-1 2626-1 A2-1 A2-1 A2-2 A2-2 A2-2 A2-3 A2-3 A2-3 BLANK
6.84 nM
e
BLANK 2626-1 2626-1 A2-1 A2-1 A2-2 A2-2 A2-2 A2-3 A2-3 A2-3 BLANK
6.84 nM
f
BLANK 2626-1 2626-1 A2-1 A2-1 A2-2 A2-2 A2-2 A2-3 A2-3 A2-3 BLANK
6.84 nM
g
BLANK 2626-1 2626-1 A2-1 A2-1 A2-2 A2-2 A2-2 A2-3 A2-3 A2-3 BLANK
6.84 nM
h
BLANK BLANK C_ctrl BLANK BLANK BLANK BLANK BLANK BLANK C_ctrl BLANK BLANK
The growth was tracked with a TCAN OD reader and incubator, over up to 100 hours. An example of raw growth curves is visible in the figure 14 below. The well E5 below seemed to grow significantly faster in Rapamycin than both other euploid and aneuploid strains, likely corresponding to a stochastic adaptation event enabled by aneuploidy. Following the retrieval of growth curves, custom code was used to calculate the peak growth rate as well as growth delay, as presented in the figure 15 below.
41 Figure 14 Raw growth curves for the plate design above. X axis is time (approximately 100
hours), Y axis is OD
Additional investigation has shown that the growth speeds close to low ODs, such as in A2-2 and A2-3 in rapamycin were biased by the instrument, due to a non-linearity of TCAN OD curve. An instrument calibration was performed, by performing simultaneous measurements of ODs both in TCAN and in a tabletop spectrophotometer. A normalization curve can be seen in the figure 17 below. Due to the sagging of the effective OD curve (green) for ODs below 0.8, growth speed for ODs below 0.6 is overestimated, whereas above – underestimated, leading to additional issue with calculating the growth speeds in figure xx.
The code used for TCAN calibration as well as for data retrieval and analysis is available at https://github.com/ank-PhD/TcanAnalyzer.
The next step of the project would have been to RNA-seq the adapted A2 aneuploid strain vs non-adapted aneuploid strain and compare the difference in the gene expression levels acquired during the adaptation to the prediction of our model. However, due to the issues
42 described above, as well as the lab moving to Johns Hopkins and associated interruption in reagents and instruments availability, this project has been paused and never resumed.
Figure 15 Growth speeds and delays for each well in the assay above. X axis is time, Y axis is growth speed. First number above well is the interval between two divisions at the fastest growth
43 Figure 16 Comparative growth curves of A2 and 2626 without rapamycin (red and blue, respectively), as well as in 6.84 nM rapamycin for adapted A2 (light blue), along with
44 Figure 17 X - OD measured by TCAN; Y - OD measured by tabletop spectrophotometer. Blue
points are measurements obtained for identical ODs in TCAN and spectrophotometer. Red is linear regression of the curve, green is 3rd order polynomial regression.
45
Chapter 8: Experimental investigation of aneuploidy impact
on intra-nuclear chromosome localization and motility
The regulation of gene translation within the nucleus of eukaryotes is not controlled only by the DNA sequence of the promoter regions on the chromosomes. In addition to them, the 3D localization of the genome plays an important role both in allowing epigenetic marks to be applied to the genome and its translation to be regulated and post-translational modifications to be applied. Whereas this is most widely known for intranuclear organizer region nucleolus (Biosvert et al. 2007), eukaryotes genomes overall have a well-defined organization of DNA within the nucleus (Cremer et al. 2001). In yeast specifically, the localization of a locus within the nucleus plays an important role in its epigenetic regulation and transcription regulation (Bystricky et al. 2009, Mekhail and Moazed 2010). Prior work in our lab has shown that at least in yeast, aneuploidy could disrupt both localization and epigenetic modifications in yeast (Mulla et al. 2017), pointing to an additional way, beyond direct dosage effects, by which the
aneuploidy could impact the adaptability of biological systems in adverse environments. Whereas the exact mechanisms by which such adaptation could be possible remained elusive, we know that at least some translational regulation yeast is due to the interaction loci with organizing centers within the nucleus and nucleopore complexes (Strambio-De-Castillia et al. 2010, Capelson et al. 2010). Our hypothesis was that the affinity of the binding between the organizing centers or organizing complexes and the chromosomes was somehow affected by aneuploidy. Whereas there was no straightforward reason why aneuploidy would modify binding the binding affinity coefficient between the reagents involved in the organization, the
thermodynamic favorability of a binding reaction is driven by the free enthalpy of reaction rG:
S H G r r
r
Where rH is the reaction enthalpy and is the reaction entropy. In most cases, rS H
r
is associated with the intrinsic properties of reagents, favoring the binding or unbinding state on a molecular level, whereas is associated with the entropy of components rS
abundance. This entropy is the reason behind the mass action law governing chemical reactions. In case of DNA however, can vary as well due to the reduction in degrees of freedom in the rS
46 DNA polymer, limiting the conformational entropy of the DNA molecule (Doig et al. 1995). Due to this, we expect that the presence of additional chromosomes competing for the binding with the organizing centers and biomolecules would have effects going beyond directly stochiometric and impact the localization of the DNA as well as their epigenetic state.
To validate this approach, we have set out to label specific loci on the chromosomes with LacO-LacI-GFP array, a well-characterized system used to study intra-nuclear loci positioning and movement (Jegou et al. 2009). To be able to monitor their movement, we have as well tagged the nuclear envelope with Nup49-mCherry (Schlaich et al. 1997). To start with, we targeted pericentromeric region of chromosome 4 by using TRP1 and LEU3 markers to knock-in LacO arrays and URA3 marker to insert a plasmid carrying the LacI-GFP assembly and in-place replacement of Nup49 with Nup49-mCherry by using the HIS marker. The in-place replacement of Nup49 was done to avoid disrupting stoichiometry of nucleopore complex and hence avoid introducing a disruption into the nuclear organization that could have interfered with the disruption from aneuploidy we would have been interested in. An initial validation by microscopy confirmed that both systems were properly expressing and localizing (figure 18, acquired on confocal microscope). The results of 3D rendering of the 3-d stack with
superimposed channels are visible in figure 19.
Figure 18 validation of proper marking with GFP and mCherry of Chr 4 centromeric region and nuclear envelope. Colors are inverted: left, green, is Nup49-mCherry; right, red, is
47 Figure 19 Isometric rendering of 3D fluorescent stack of the GFP and mCherry data in yeast.
Red is Nup49-mCherry, green is LacO/LacI-GFP array
Following this initial run, several problems with our approach were detected. First, over the imaging periods, the base showed microscopic movements that were interfering with the detection of movement. Those movements could not be removed programmatically with only two fluorescent channels, since the movement of GPF loci was what interested us and the nuclear envelope shape was unstable, preventing us from using existing tracking and stabilization
libraries on them. The second problem was the movement of the nucleus itself. Due to the possible rotation of the nucleus, there was a possibility that chromosome loci movement would not be due to the intra-nuclear movement, but rather the rotation of the entire nuclear envelope. Once again, due to the constant movement of nuclear membrane, it was not possible to
distinguish them or safely assign residency areas to the loci.
To overcome these two problems, we have decided to use an additional fluorescent tagging protein. Since we were already using the mCherry and eGFP proteins, respectively at 600-680 nm and 500-540 nm, to minimize the cross-contamination between the channels, we decided to use the mTagBFP2 protein with an emission lengths of 445-460 nm and an expected
48 relative brightness of 32.4 compared to the eGFP’s 33.6 and mCherry’s 15.8 (Subach et al. 2011). We chose to tag Spc42, due to its abundance and high concentration in spindle pole bodies (SPBs). Due to the amount of Spc42 present in SPBs, Spc42 tags tend to be very bright and are commonly used to track the advancement of the cell cycle. They could provide a good point of reference for our chromosome loci tracking. We’ve inserted Spc42-BFP construct under hygromycin marker and confirmed a proper insertion with a PCR. Unfortunately, despite the PCR confirmation and multiple attempts on knock in, no trace of tagging was found under the microscope (figure 20).
Figure 20 Microscopy verification of a PCR -positive yeast colon for BFP fluorescence Further verification of the PCR-positive colonies with lambda-microscopy (Dickinson et al. 2001), where we scanned the entire specimen along the z axis as well as from 400 to 700 nm by a step of 15 nm while exciting at 330 nm – specific frequency of BFP excitation did not show any trace of non-background signal even in the most luminescent spots (Figure 21). Upon
verification of other strains with BFP tagging in the lab, we noticed the same pattern for all the strains where BFP was tagging a protein, but not where it was tagged with an importing
sequence targeting an organelle.
At this point, our conclusion was that BFP likely was unstable when tagging proteins and could only be used as a stand-alone coloring agent with eventually an import targeting sequence
49 attached to it. Due to the overlap with other commonly used fluorescent dies, this project would have required a re-tagging for LacO/LacI array, using YFP (emission peak at 527 nm), so that we could tag the Spc42 with mTurquoise2 (emission peak around 460nm), both of which are fast-folding and were well-characterized for their activities in vivo. Due to the moving to the Hopkins and the associated interruption in the experiments, this experiment has not been resumed before the end of the thesis.
The code developed to perform this analysis is available in the
https://github.com/chiffa/Chromo_vision repository.
Figure 21 Sampling locations (left) for lambda spectrums plot and lambda spectrum plot itself (right). Blue line corresponds to a highly florescent location (red dot in the image); black corresponds to the background (blue dot in the image) and red - to the difference between the
50
Chapter 9: ImagePipe: a Python Framework for Biological
Microscopy Analysis Pipelines
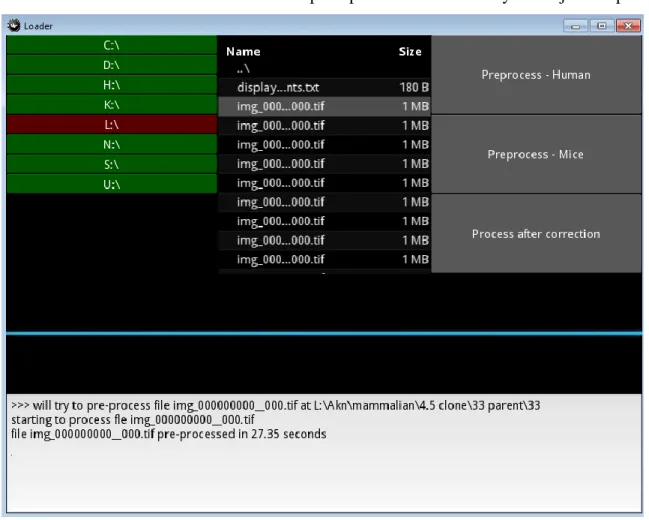
While the attempt to quantify the impact of aneuploidy on the localization and motility of the chromosome loci inside the nucleus did not arrive to conclusive results, it did lead to a creation of image analysis library. This library, rather than focusing on specific applications tried to introduce high-level functions that were understandable and interpretable even to the non-experts, to accelerate the communication and the between the biologists and the image analysis pipeline developer. Coinciding with the development of the optimization of chromosome spread techniques in the lab (Potapova et al. 2015), those image analysis techniques were used in order to develop a semi-automated chromosome counter with a GUI (source code at
https://github.com/chiffa/Chromosome_counter, figures 22, 23). In the end a more mature design, better integrating with the existing tools and higher precision tool was developed and incorporated into the final paper by an image analysis expert at Stowers. However, this exercise gave rise to a set of core libraries that were used within the lab.
The paper at the core of this chapter is a manuscript in preparation for submission to PeerJ describing the current state of the library, as well as design decisions that went into it. Being strong proponents of view of programming as theory building (Naur 1985), which puts a stronger accent on the gradual accumulation of domain knowledge and insight by the
development team, rather than the code, we have written this paper to explain the acquired domain knowledge and insights into the biological image analysis and how they were encoded into the ImagePipe framework for biological image analysis pipeline development.
Being the creator and the architect of several iterations of the pipeline, from
https://github.com/chiffa/Chromo_vision to https://github.com/chiffa/Image_pipe, the paper, entire architecture, image analysis functions and functions for piping together the core logic were implemented by me, as well as the applications to the data underlying (Ruan, Zhou et al. 2017) paper in Chapter 10. Rubab Malik, second author of the paper, was a biophysics undergrad under my supervision throughout the 2016-2017 academic year and contributed to the development of several pipelines for specific needs within the lab. Her work in understanding the early iterations
51 of this framework as well as applying it to concrete problems led to significant improvements, both in design and coverage of edge use cases within the library.
The article is in submission and its prior publication is contrary to the journal policies.
52 Figure 23 Example of segmentation algorithm applied to the chromosomes spread