CERN-EP-2017-277 16 October 2017
c
2017 CERN for the benefit of the ALICE Collaboration.
Reproduction of this article or parts of it is allowed as specified in the CC-BY-4.0 license.
Longitudinal asymmetry and its effect on pseudorapidity distributions
in Pb–Pb collisions at
√
s
NN= 2.76 TeV
ALICE Collaboration∗
Abstract
First results on the longitudinal asymmetry and its effect on the pseudorapidity distributions in Pb–Pb collisions at√sNN= 2.76 TeV at the Large Hadron Collider are obtained with the ALICE detector.
The longitudinal asymmetry arises because of an unequal number of participating nucleons from the two colliding nuclei, and is estimated for each event by measuring the energy in the forward neutron-Zero-Degree-Calorimeters (ZNs). The effect of the longitudinal asymmetry is measured on the pseudorapidity distributions of charged particles in the regions |η| < 0.9, 2.8 < η < 5.1 and −3.7 < η < −1.7 by taking the ratio of the pseudorapidity distributions from events corresponding to different regions of asymmetry. The coefficients of a polynomial fit to the ratio characterise the effect of the asymmetry. A Monte Carlo simulation using a Glauber model for the colliding nuclei is tuned to reproduce the spectrum in the ZNs and provides a relation between the measurable longitudinal asymmetry and the shift in the rapidity (y0) of the participant zone formed by the unequal number
of participating nucleons. The dependence of the coefficient of the linear term in the polynomial expansion, c1, on the mean value of y0is investigated.
∗See Appendix 8 for the list of collaboration members
1 Introduction
In a heavy-ion collision, the number of nucleons participating from each of the two colliding nuclei is finite, and will fluctuate event-by-event. The kinematic centre of mass of the participant zone, defined as the overlap region of the colliding nuclei, in general has a finite momentum in the nucleon-nucleon centre of mass frame because of the unequal number of nucleons participating from the two nuclei. This momentum causes a longitudinal asymmetry in the collision and corresponds to a shift of rapidity of the participant zone with respect to the nucleon-nucleon centre of mass (CM) rapidity, termed the rapidity-shift y0. The value of y0 is indicative of the magnitude of the longitudinal asymmetry of the
collision [1, 2]. Assuming the number of nucleons participating from each of the two nuclei is A and B, the longitudinal asymmetry in participants is defined as αpart= A−BA+B and the rapidity-shift can be
approximated as y0∼= 12lnAB at LHC energies [2].
The shift in the CM frame of the participant zone, which evolves into a state of dense nuclear matter, needs to be explored in heavy-ion collision models. Comparison of model predictions with the observed Λ-polarisation, possibly due to vorticity from the initial state angular momentum surviving the evolu-tion, requires a precise determination of initial conditions and hence the shift in the CM frame [3–5]. Such a shift may also affect observations on correlations amongst particles, which eventually provide information about the state of the matter through model comparisons. Further, the resultant decrease in the CM energy may affect various observables including the particle multiplicity. The transverse spectra are known to be affected by the initial geometry of the events, as estimated through techniques of event shape engineering, indicating an interplay between radial and transverse flow [6]. The measurement of longitudinal asymmetry will provide a new parameter towards event shape engineering, affecting many other observables.
The simplest of all possible investigations into the effect of longitudinal asymmetry is a search for mod-ification of the kinematic distribution of the particles. The pseudorapidity distribution (dN/dη) of soft particles, averaged over a large number of events, is symmetric in collisions of identical nuclei. These dis-tributions were observed to be asymmetric in collisions of unequal nuclei such as d–Au [7] and p–Pb [8– 10] and have been explained in terms of the rapidity-shift of the participant zone [11]. In a heavy-ion collision, the effect of the rapidity-shift of the participant zone should be discernible in the distribution of produced particles. This small effect can be estimated by taking the ratio of pseudorapidity distributions in events corresponding to different longitudinal asymmetries [2].
It was suggested that the rapidity distribution of an event, scaled by the average rapidity distribution, can be expanded in terms of Chebyshev polynomials, where the coefficients of expansion are measures of the strength of longitudinal fluctuations and can be determined by measuring the two particle correlation function [12]. Using the same methodology, the event-by-event pseudorapidity distributions are also ex-panded in terms of Legendre polynomials [13]. The ATLAS collaboration exex-panded the pseudorapidity distributions in terms of Legendre polynomials and obtained the coefficients by studying pseudorapidity correlations [14].
In the present work, the events are classified according to the asymmetry determined from the mea-surement of energies of neutron spectators on both sides of the collision [2]. The effect of asymmetry is investigated by taking the ratio of the measured raw dN/dη distributions for events from different regions of the distribution of measured asymmetry. A major advantage of studying this ratio is the cancellation of (i) systematic uncertainties and (ii) the effects of short range correlations. The first measurements of the effect of asymmetry on the raw dN/dη distributions are reported here.
The paper is organised as follows: Sect. 2 provides an introduction to the experimental setup and the details of the data sample. Section 3 discusses the characterisation of the change in raw dN/dη distribu-tions for events classified in different asymmetry regions. Section 4 describes the simuladistribu-tions employed to provide a relation between the measured asymmetry and the rapidity-shift y0of the participant zone.
The relation between the parameter characterising the change in raw dN/dη distributions is shown for different centralities in Sect. 5, along with its relation to the estimated values of y0.
2 Experimental details and data sample
The analysis uses data from Pb–Pb collision events at√sNN= 2.76 TeV, recorded in the ALICE
experi-ment in 2010, with a minimum bias trigger [15, 16]. The data used in the present analysis is recorded in the neutron Zero Degree Calorimeters (ZNs), the V0 detectors, the Time Projection Chamber (TPC) and the Inner Tracking System (ITS). Both ZNs and V0 detectors are on either side of the interaction vertex, those in the direction of positive pseudorapidity axis are referred as V0A and ZNA and those in the opposite direction are referred as V0C and ZNC. A detailed description of the ALICE detectors and their performance can be found elsewhere [17, 18].
The event asymmetry is estimated using the energy measured in the two ZNs situated 114 metres away from the nominal interaction point (IP) on either side. The ZNs detect only spectator neutrons that are not bound in nuclear fragments, since the latter are bent away by the magnetic field of the LHC separation dipole. The ZN detection probability for neutrons is 97.0% ± 0.2%(stat) ±3%(syst) [19]. The relative energy resolution of the 1n peak at 1.38 TeV is 21% for the ZNA and 20% for the ZNC [19]. The production of nuclear fragments increases with collision impact parameter degrading the resolution on the number of participating nucleons. The energy in the ZNs is a good measure of the number of spectator neutrons only for the more central collisions [18]. The analysis is limited to the top 35% most central sample and employs data from ∼ 2.7 million events.
The raw dN/dη distributions in the region |η| < 0.9 are obtained by reconstructing the charged particle tracks using the TPC and ITS. The requirements on the reconstructed tracks obtained using the measure-ments in these detectors are the same as in other earlier analyses [15]. The measured amplitudes in the V0A ( +2.8 < η < +5.1) and V0C (−3.7 < η < −1.7 ) are used to estimate the raw dN/dη distributions of charged particles in the forward regions. Both V0A and V0C are scintillator counters, each with four segments in pseudorapidity and eight segments in azimuth. The raw distributions measured are termed as dN/dη distributions throughout the manuscript. In order to ensure a uniform detector performance, the present analysis uses events with z position (along the beam direction) of the interaction vertex, Vz,
within ± 5 cm of the IP in ALICE. The centrality of Pb-Pb collisions was estimated by two independent methods. One estimate was based on the charged particle multiplicity reconstructed in the TPC and the other was based on the amplitudes in the V0 detectors [20].
3 Analysis and systematic uncertainties
In the present analysis, changes in the raw pseudorapidity distribution of charged particles are inves-tigated for different values of measured asymmetry of the event. The method of measurement of the asymmetry and the parameters characterising the change in dN/dη distributions are discussed in this section.
3.1 Analysis
Any event asymmetry due to unequal number of nucleons from the two participating nuclei may manifest itself in the longitudinal distributions, i.e. dN/dy (or dN/dη) of the produced particles because of a shift in the effective CM. Assuming that the rapidity distributions can be described by a symmetric function about a mean y0(y0 = 0.0 for symmetric events), the ratio of the distributions for asymmetric
and symmetric events may be written as (dN/dy)asym (dN/dy)sym = f(y − y0) f(y) ∝ ∞
∑
n=0 cn(y0)yn (1)For any functional form of the rapidity distribution, this ratio may be expanded in a Taylor series. The coefficients cn of the different terms in the expansion depend on the shape and the parameters of the
rapidity distribution [2]. In the ALICE experiment, the pseudorapidities of the emitted particles were measured. The effect of a rapidity-shift y0on the pseudorapidity distribution is discussed in Sect. 4.2.
The unequal number of participating nucleons will yield a non-zero y0 of the participant zone and will
cause an asymmetry in the number of spectators. This asymmetry can provide information about the mean values of y0 using the response matrix discussed in Sect. 4. The asymmetry of each event is
estimated by measuring the energy in the ZNs on both sides of the interaction vertex: EZNA on the
side referred to as the A-side (η > 0) and EZNC on the side referred to as the C-side (η < 0). A small
difference in the mean and the relative energy resolution of the 1n peak at 1.38 TeV was observed in the performance of the two ZNs [19]. For each centrality interval, the energy distribution in each ZN is divided by its mean, and the width of the EZNC/hEZNCi distribution is scaled to the width of the
corresponding distribution using EZNA. The asymmetry in ZN is defined as
αZN=
εZNA− εZNC
εZNA+ εZNC
(2) where εZNC(A) is a dimensionless quantity for each event, obtained after scaling the distributions of
EZNC(A)as described above.
For the 15–20% centrality interval, Fig. 1 shows the distribution of the asymmetry αZN. To
investi-ZN
α
0.5 − 0 0.5Number of events
0 10000 20000 30000 ALICE = 2.76 TeV NN s Pb − 20% Pb − 15 < 0.1 ZN α ≤ 0.1 − 0.1 ≥ ZN α 0.1 − < ZN αRegion1
Region3
Region2
Fig. 1: The distribution of the asymmetry parameter αZNfor the 15–20% centrality interval. The
distri-bution is demarcated into three regions using |αZNcut|. A Gaussian fit to the distribution yields a width of 0.13.
gate the significance of this distribution, the contribution of the resolution of ZNs to the resolution of the asymmetry parameter αZN is evaluated. For each centrality interval, values of EZNC and EZNA are
simulated for each event by assuming a normal distribution peaked at the mean value corresponding to the average number of neutrons and the corresponding energy resolution. The average number of neu-trons is estimated by dividing the experimental distribution of energy in ZN by 1.38 TeV. These values are used to obtain αZN for each event and its distribution. The width of the distribution corresponds to
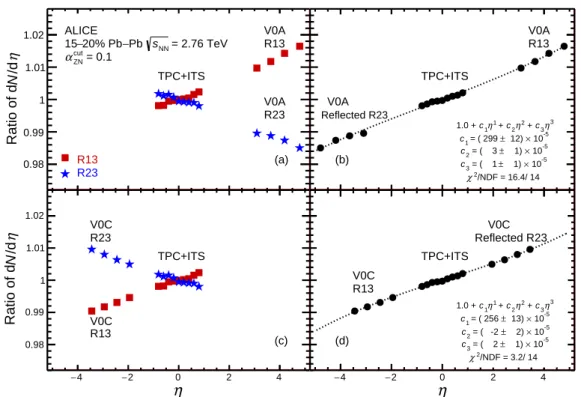
η 4 − −2 0 2 4 η /d N Ratio of d 0.98 0.99 1 1.01 1.02 ALICE = 2.76 TeV NN s Pb − 20% Pb − 15 = 0.1 cut ZN α V0A R13 V0A R23 TPC+ITS R23 R13 (a) η 4 − −2 0 2 4 η /d N Ratio of d 0.98 0.99 1 1.01 1.02 (c) V0C R23 V0C R13 TPC+ITS η 4 − −2 0 2 4 η /d N Ratio of d 0.98 0.99 1 1.01 1.02 V0A Reflected R23 TPC+ITS V0A R13 3 η 3 c + 2 η 2 c + 1 η 1 c 1.0 + -5 10 × 12) ± = ( 299 1 c -5 10 × 1) ± = ( 3 2 c -5 10 × 1) ± = ( 1 3 c /NDF = 16.4/ 14 2 χ (b) η 4 − −2 0 2 4 η /d N Ratio of d 0.98 0.99 1 1.01 1.02 (d) V0C R13 TPC+ITS V0C Reflected R23 3 η 3 c + 2 η 2 c + 1 η 1 c 1.0 + -5 10 × 13) ± = ( 256 1 c -5 10 × 2) ± = ( -2 2 c -5 10 × 1) ± = ( 2 3 c /NDF = 3.2/ 14 2 χ
Fig. 2: The ratio of dN/dη distribution for events from the different regions of αZN distribution of
Fig. 1. The dN/dη distributions are obtained as described in Sect. 2. (a) The square (star) symbols corresponding to R13 (R23) are obtained by taking the ratio of dN/dη of events from Region 1 (Region 2) to Region 3. (b) The data points are obtained after reflection across η = 0 as described in the text. The data for |η| > 1.0 in panels (a) and (b) are from measurements in V0A and in panels (c) and (d) are from measurements in V0C.
peripheral (30–35%) selection to the most central (0–5%) selection. The observed width of 0.13 of the distribution of αZNreported in Fig. 1 is considerably larger than the resolution of αZN(0.027 for the
cen-trality interval corresponding to the data in the figure) and the increase in width may be attributed to the event-by-event fluctuations in the number of neutrons detected in each ZN. To investigate the effect of αZNon the dN/dη distributions, the events are demarcated into three regions of asymmetry by choosing
a cut value αZNcut. These regions correspond to (i) αZN< −αZNcut(Region 1), (ii) αZN≥ αZNcut(Region 2)
and (iii) −αZNcut≤ αZN< αZNcut(Region 3). Regions 1 and 2 are referred to as the asymmetric regions and
Region 3 is referred to as the symmetric region.
The effect of the measured asymmetry αZNon the pseudorapidity distributions is investigated by studying
the ratio of dN/dη distribution in events from the asymmetric region to those from the symmetric region. There are small differences in the distributions of centrality and vertex position in events of different regions of asymmetry. It is necessary to ensure that any correlation between the ratio of dN/dη and the asymmetry is not due to a systematic effect of a shift in the interaction vertex. To eliminate any possible systematic bias on the measured distributions, the dN/dη distributions are corrected by weight factors obtained by normalising the number of events in asymmetric and symmetric regions in each 1% centrality interval and each 1 cm range of vertex positions.
For the 15-20% centrality interval, the distributions of these factors in the two cases corresponding to the asymmetry regions 1 and 2 have a mean of 1.0 and an rms of 0.05 and 0.06 respectively. The weight factors do not show any systematic dependence on the position of the vertex. This is expected considering the large distance between the ZNs as compared to variations in the vertex position. The factors show a systematic dependence on 1% centrality bins within each centrality interval. The 1% centrality bin with
the greater number of participants tends to have more asymmetric events, presumably to compensate for the decrease in the effective CM energy due to the motion of the participant zone; the weight factor is 1.08 for the most central 15–16% centrality bin and is 0.94 for the 19–20% centrality bin.
The ratio of dN/dη for events corresponding to different regions of asymmetry, as shown in Fig. 1, is determined. For |η| < 1.0, the ratio is obtained using dN/dη for tracks. For |η| > 1.0, the ratio shown in Fig. 2(a) and (b) is obtained from amplitudes measured in V0A and the one shown in Fig. 2(c) and (d) is from amplitudes measured in V0C. The squares in Fig. 2 (a) and (c) represent the ratio of dN/dη in the asymmetry Region 1 to that in Region 3 (R13), and the stars represent the corresponding ratio in Region 2 to Region 3 (R23). The filled circles in Fig. 2 (b) and (d) are obtained by (i) reflecting the data points labelled R23 across η = 0 and (ii) taking the averages of R13 and reflected-R23 for |η| < 1.0. A third order polynomial is fitted to the points and the values of the coefficients cn along with the χ2
are shown. The polynomial fit to the ratio of dN/dη distribution has a dominantly linear term. A small residual detector effect is observed when determining c1 using data measured in V0A and when using
data measured in V0C. In all subsequent discussion, the values of c1 quoted are the mean of values
obtained from the measurements in V0A and V0C.
cut ZN
α
0 0.1 0.2 1c
0 0.002 0.004 ALICE = 2.76 TeV NN s Pb − Pb 5% − 0 10% − 5 15% − 10 20% − 15 25% − 20 30% − 25 35% − 30Fig. 3: The coefficient c1 characterising the change in dN/dη distribution for asymmetric regions is
shown for different values of αZNcut (αZNcut demarcates the asymmetric and symmetric events) for each centrality interval.
Considering that the event samples corresponding to different regions of asymmetry are identical in all aspects other than their values of measured αZN, the observation of non-zero values of c1 can be
attributed to the asymmetry. For a fixed centrality interval, c1 depends on the choice of αZNcut. The
analysis is repeated for different values of αZNcutand the dependence of c1on αZNcutis shown in Fig. 3, for
different centralities. For each centrality interval the coefficient c1has a linear dependence on αZNcutand
the slope increases with decreasing centrality; c1 increases for events corresponding to larger values of
average event asymmetry. The range of values of αZNcutwas guided by the resolution and the width of the distribution of αZN, as mentioned in reference to Fig. 1. Increasing the value of αZNcutincreases the mean
hαZNi for events from the asymmetric class (Region 1 or Region 2), and increases the RMS of αZNfor
3.2 Systematic uncertainties
The current method of analysis uses the ratio of two dN/dη distributions from events divided on the basis of measurements in ZNs, within a centrality interval. All effects due to limited efficiency, acceptance or contamination would cancel while obtaining the value of the ratio. The contributions to the systematic uncertainties on c1are estimated due to the following sources:
1. Centrality selection: the ratio of dN/dη is obtained from the measurements of tracks in the ITS+TPC at midrapidity and charge particle signal amplitudes in the V0 at forward rapidities. For the former, the event centrality is determined using the measurements in the V0 and for the lat-ter using the track multiplicity in the TPC. The analysis is repeated by inlat-terchanging the centrality criteria and the resultant change in the values of c1for different centrality intervals is in the range
0.1% to 3.6%.
2. V0A and V0C: the systematic uncertainty on the mean value of c1 is estimated by assuming a
uniform probability distribution for the correct value of c1to lie between the two values obtained
using the charged-particle signal amplitudes measured in the V0A and the V0C. The uncertainty is in the range 2.1% to 4.6% and does not depend on the centrality value.
3. Vertex position: the analysis is repeated for the z position of the interaction vertex |Vz| ≤ 3.0 cm.
For the most central interval, the results change by less than 0.1%. For the 15–20% centrality interval, the results change by 3.3% and for all other centrality intervals, the changes are less than 1.3%.
4. Weight factors for normalisation: the analysis is also repeated without the weight factors men-tioned in Sect. 3.1 for the centrality and the vertex normalisation in the number of events. The change in the results is 4.9% in the most central class and less than 1% for all other centrality intervals.
The total systematic uncertainty is obtained by adding the four uncertainties in quadrature. The resultant uncertainty is in the range 2.3% to 5.8% and is shown by the band in Fig. 8.
4 Simulations
The simulation used for obtaining a relation between rapidity-shift y0 and the measurable asymmetry
αZN is described in this section. This simulation has three components: (i) a Glauber Monte Carlo to
generate number of participants and spectator protons and neutrons, (ii) a function parametrised to fit the average loss of spectator neutrons due to spectator fragmentation (the loss of spectator neutrons in each event is smeared around this average) and (iii) the response of the ZN to single neutrons. The simulation encompassing the above is referred to in the present work as Tuned Glauber Monte Carlo (TGMC), and reproduces the energy distributions in the ZNs. The effect of y0on the pseudorapidity distributions has
been estimated using additional simulations for a Gaussian dN/dy and are also described in this section. 4.1 Asymmetry and rapidity-shift
The Glauber Monte Carlo model [21] used in the present work assumes a nucleon-nucleon interaction cross section of 64 mb at√sNN = 2.76 TeV. The model yields the number of participating nucleons in the
overlap zone from each of the colliding nuclei. The range of impact parameters for each 5% centrality interval is taken from our Pb-Pb centrality paper [20]. For each centrality interval, 0.4 million events are generated.
part α 0.3 − −0.2 −0.1 0 0.1 0.2 0.3 0 y Rapidity-shift 0.3 − 0.2 − 0.1 − 0 0.1 0.2 0.3 ALICE Simulation = 2.76 TeV NN s Pb − 20% Pb − 15 Tuned Glauber MC (a) spec α 0.4 − −0.2 0 0.2 0.4 ) 0
Rapidity of Participant zone (y −0.3
0.2 − 0.1 − 0 0.1 0.2 0.3 (b) spec-neut α 0.4 − −0.2 0 0.2 0.4 0 y 0.3 − 0.2 − 0.1 − 0 0.1 0.2 0.3 (c) ZN α 0.6 − −0.4 −0.2 0 0.2 0.4 0.6 0 y 0.3 − 0.2 − 0.1 − 0 0.1 0.2 0.3 (d) 0 500 1000 1500 2000 2500
Number of events (arbitrary units)
Fig. 4: Rapidity-shift y0as a function of asymmetry in (a) number of participants (b) number of spectators
(c) number of spectator neutrons and (d) energy in ZN obtained using TGMC as described in the text. The results in all four panels are shown for the 15–20% centrality interval.
For each generated event, the number of participating protons and neutrons is obtained, enabling a de-termination of the rapidity-shift y0and the various longitudinal asymmetries. If A and B are the
num-ber of spectators (spectator neutrons) in the two colliding nuclei, the asymmetry is referred to as αspec
(αspec−neut). Figure 4 (a) shows the correspondence between y0and αpart. Figures 4 (b) and (c) show the
relation between y0and αspecand αspec−neutrespectively[2]. These figures show that the rapidity-shift y0
can be estimated by measuring αspecor αspec−neutin any experiment that uses Zero Degree Calorimeters.
However, the lack of information on the number of participants worsens the precision in determining y0. Figure 4 (d) shows the relation between y0 and αZN obtained in TGMC, as described in the next
paragraph.
The Glauber Monte Carlo is tuned to describe the experimental distributions of ZN energy. For each 1% centrality interval, the mean number of spectator neutrons (Ns) is obtained in the Glauber Monte Carlo.
Folding the ZN response yields the simulated values of mean energy as a function of centrality. The experimentally measured mean energy in the ZN is also determined for each 1% centrality interval. The ratio of the measured value of mean energy to the simulated value of mean energy gives the fractional loss (f ) of neutrons due to spectator fragments that veer away due to the magnetic field. The value of f for the 0-5% centrality interval is 0.19. For all other centralities it varies from 0.40 for 5-10% to 0.55 for 30-35% centrality interval. A fluctuation proportional to the number of remaining neutrons (Ns× (1 − f ))
is incorporated to reproduce the experimental distribution of the energy deposited in the ZN shown in Fig. 5 (a). The peak and the RMS of the energy distributions match well. The fractional difference in the position of the peak varies between 3.7% for the 0-5% centrality interval and 0.1% for the 30-35% centrality interval. The fractional difference in RMS for the most central class is 8.6% and is in the range 1.0–2.0% for all other centrality intervals. The distributions of the asymmetry parameter for the TGMC events and the measured data for each centrality interval are shown in Fig. 5 (b). The TGMC contains information of y0and αZN for each event. A scatter plot between y0 and αZN is shown in Fig. 4(d) for
the 15–20% centrality interval. This constitutes the response matrix. For any measured value of αZN, the
distribution of y0can be obtained. Any difference in the experimental and TGMC distributions of αZN
can be accounted for by scaling the y0distribution by the ratio of number of events in data to the number
in TGMC as
f(y0, αZNData) = f (y0, αZNTGMC)
NeventsData
NeventsTGMC, (3)
with Data (TGMC) in the superscript of number of events, Nevents, denoting the experimental data (TGMC
events). For each of the three regions of asymmetry shown in Fig. 1, corresponding to a chosen value of αZNcut= 0.1, the distribution of rapidity-shift y0 obtained using the response matrix is shown in Fig. 6. It
(GeV) ZNC E Energy in ZNC 0 50000 GeV 1 ZNC E d ev N d ev N 1 0 0.01 0.02 0.03 ALICE = 2.76 TeV NN s Pb − Pb (a) Data Tuned Glauber MC ZN α 1 − −0.5 0 0.5 1 ZN α d ev N d ev N 1 0 0.02 0.04 0.06 0.08 (b) 5% − 0 10% − 5 15% − 10 20% − 15 25% − 20 30% − 25 35% − 30
Fig. 5: (a) Distribution of energy in ZNC in each 5% centrality interval for events simulated using TGMC and for the experimental data. (b) Distribution of the asymmetry parameter αZNin the simulated
events and in experimental data for different centralities. For clarity, only 5 distributions are shown. The distributions corresponding to 20-25% and 25-30% lie between those of 15-20% and 30-35%.
0 y 0.4 − −0.2 0 0.2 0.4 0 y d ev N d ev N 1 0 0.05 0.1 ALICE Simulation = 2.76 TeV NN s Pb − 20% Pb − 15 TGMC < 1.0 ZN α 1.0 < − < 0.1 ZN α ≤ 0.1 − 0.1 ≥ ZN α 0.1 − < ZN α
Fig. 6: The distribution of rapidity-shifts for the events from the three different regions of measured asymmetry shown in Fig. 1. Determination of y0 uses the difference in number of nucleons. For small
values of this difference, the changes in values near y0= 0 are discrete, and are smeared into a continuous
distribution as y0increases.
−αcut
ZN≤ αZN< αZNcut, is comparable to the widths of the corresponding distributions from Regions 1 and
2. The effect of difference in the value of the means of the y0distributions is investigated in the present
work.
4.2 Effect of rapidity-shift on pseudorapidity distributions
The effect of a shift in the rapidity distribution by y0 on the measurable pseudorapidity distribution
(dN/dη) is investigated using simulations. For each event, the rapidity of charged particles is gener-ated from a Gaussian distribution of a chosen width σy [22]. The pseudorapidity is obtained by using
cut ZN α 0 0.05 0.1 0.15 0.2 〉 0 y 〈 0 0.02 0.04 0.06 0.08 (a) = 2.76 TeV NN s Pb − Pb ALICE Simulation TGMC cut ZN α 0 0.05 0.1 0.15 0.2 1 c 0 0.002 0.004 (b) ALICE Simulation = 2.76 TeV NN s Pb − Pb y /d N TGMC + Gaussian d 5% − 0 10% − 5 15% − 10 20% − 15 25% − 20 30% − 25 35% − 30
Fig. 7: (a) The estimated mean value of rapidity-shift hy0i for the asymmetric region characterised by
different values of αZNcutfor each centrality interval. (b) The coefficient c1 characterising the change in
the pseudorapidity distributions for different values of αZNcut, for each centrality interval. These results are obtained using TGMC and simulated pseudorapidity distributions, as described in the text
.
measured relative yields of pions, kaons and protons [23]. To simulate the effect of different widths of the parent rapidity distribution for different centralities, different σywidths are chosen to reproduce the
measured FWHM (Full Width at Half Maximum) of the pseudorapidity distribution [24]. For the most central (0–5%) class, a value 3.86 is used for the width of the rapidity distribution, and a value 4.00 is used for the width of the least central class employed in this analysis (30–35%).
The distribution of rapidity-shift y0, similar to the one shown in Fig. 6, is obtained for each centrality
interval and each αZNcut using TGMC. Figure 7 (a) shows the hy0i as a function of αZNcut for different
centralities. One observes a linear relation between the two quantities, showing that an asymmetry in the ZN measurement, arising from the unequal number of participating nucleons, is related to the mean rapidity-shift hy0i. The rapidity distribution of the particles produced in each event is generated assuming
a Gaussian form centred about a y0, which is generated randomly from the y0distribution. Events with
a rapidity distribution shifted by y0 6= 0 yield an asymmetric pseudorapidity distribution. A third order
polynomial function in η is fitted to the ratio of the simulated dN/dη for the asymmetric region to the simulated dN/dη for the symmetric region. The values of the coefficients in the expansion depend upon the rapidity-shift y0and the parameters characterising the distribution [2].
The simulations described above were repeated for different values of αZNcutto obtain the pseudorapidity distributions for symmetric and asymmetric regions. Fitting third order polynomial functions to the ratios of the simulated pseudorapidity distributions determines the dependence of c1on αZNcut. Figure 7(b)
shows that c1 has a linear dependence on αZNcut for each centrality interval. The difference in the slopes
for different centralities is due to differences in the distributions of y0and to differences in the widths of
the rapidity distributions.
It is important to note that the parameter c1, characterising the asymmetry in the pseudorapidty
distribu-tion, shows a linear dependence on the parameter αZNcutin the event sample generated using TGMC and simulations for a Gaussian dN/dy, akin to the dependence of the estimated value of rapidity-shift y0for
5 Results
The longitudinal asymmetry in a heavy-ion collision has been estimated from the difference in the energy of the spectator neutrons on both sides of the collision vertex. The effect of the longitudinal asymmetry is observed in the ratio of dN/dη distributions corresponding to different asymmetries. The linear term in a polynomial fit to the distribution of the ratio is dominant, and is characterised by its coefficient c1. The centrality dependence of the coefficient c1 for αZNcut = 0.1 is shown in Fig. 8. It is worth
Centrality (%)
0 10 20 30 1c
0 0.002 0.004 Pb−Pb sNN = 2.76 TeV ALICE Data y /d N Tuned Glauber MC + Gaussian d= 0.1
cut ZN
α
Fig. 8: The mean values of the coefficient c1 are shown as filled (red) circles for different centralities.
These correspond to the ratio of dN/dη distributions of populations of events demarcated by αZNcut= 0.1. The squares show the corresponding values from simulations, and correspond to αZNcut= 0.1 in Fig. 7, for different centralities. The systematic uncertainties are shown as bands.
emphasising that the values of c1and hence its centrality dependence are affected by (i) the distribution
of rapidity-shift y0for each centrality interval, (ii) the chosen value of αZNcut, as seen in Fig. 7 and (iii) the
shape or the width of the parent rapidity distribution for each centrality. Figure 8 also shows the results obtained using simulations as described in Sec. 4.2 for αZNcut= 0.1. The systematic uncertainty on the simulated event sample is estimated by (i) varying the resolution of ZNs from 20% to 30%, (ii) assuming all charged particles are pions and (iii) varying the width of the parent rapidity distribution within the range corresponding to the uncertainties on FWHM quoted in Ref. [24]. The simulated events show a good agreement with the experimental data providing credence to the assumptions of the simulation, in particular that the asymmetry in the distributions arises from the shift of rapidity of the participant zone. There are two quantities from independent measurements for each selection of asymmetric events. These are (i) c1, the parameter characterising the effect of asymmetry in the dN/dη distributions and shown
in Fig. 3 and (ii) the mean rapidity-shift hy0i obtained from the measured asymmetry, filtered through
the corresponding response matrix (Fig. 4 (d)), and shown in Fig. 7 (a). The relation between c1 and
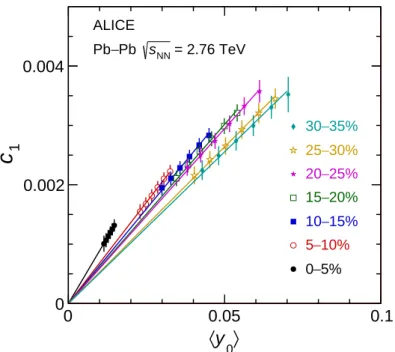
hy0i is shown in Fig. 9. The parameter c1 shows a linear dependence on hy0i for each centrality. The
difference in the slopes indicates the sensitivity of the longitudinal asymmetry to the details of the rapid-ity distribution. For a Gaussian rapidrapid-ity distribution the corresponding parameter c1would be related to
the rapidity-shift as c1= σy0
y2 [2], implying that the slope is inversely proportional to the square of the
width of the distribution. The observation of an increase in the slope with an increase in the centrality in the present data indicates a decrease in the width of the pseudorapidity distribution with increasing centrality. Such a decrease in the width of the pseudorapidity distribution with increasing centrality has
〉
0y
〈
0 0.05 0.1 1c
0 0.002 0.004 ALICE = 2.76 TeV NN s Pb − Pb 5% − 0 10% − 5 15% − 10 20% − 15 25% − 20 30% − 25 35% − 30Fig. 9: For each set of events characterised by αZNcut, the measured values of coefficient c1as a function
of estimated values of mean rapidity-shift obtained using TGMC as described in the text. The results are shown for different centralities. The uncertainties for hy0i shown are statistical and within its symbol
size. The lines are linear fits passing through the origin.
been observed independently by fitting the pseudorapidity distributions in a broad range of pseudorapid-ity [24].
6 Conclusions
The present analysis demonstrates the existence of a longitudinal asymmetry in the collision of identical nuclei due to fluctuations in the number of participants from each colliding nucleus. This asymmetry has been measured in the ZNs in the ALICE experiment (Fig. 1), and affects the pseudorapidity distri-butions, as demonstrated by taking the ratio of distribution of events from the asymmetric region to the corresponding one from the symmetric region (Fig. 2). The effect can be characterised by the coefficient of the linear term in the polynomial expansion of the ratio. The coefficients show a linear dependence on αZNcut, a parameter to classify the events into symmetric and asymmetric regions (Fig. 3). Different values of αZNcutcorrespond to different values of the mean rapidity shift hy0i (Fig. 7 (a)). The parameter
describ-ing the change in the pseudorapidity distributions (c1) has a simple explanation in the rapidity-shift hy0i
of the participant zone (Fig. 9). The analysis confirms that the longitudinal distributions are affected by the rapidity-shift of the participant zone with respect to the nucleon-nucleon CM frame. The results provide support to the relevance of number of nucleons affecting the production of charged particles, even at such high energies.
The longitudinal asymmetry is a good variable to classify the events and provides information on the initial state of each event. A systematic study of the effects of longitudinal asymmetry on different observables, e.g. the odd harmonics of anisotropic flow, the forward-backward correlations, the source sizes, in heavy-ion collisions may reveal other characteristics of the initial state and of particle production phenomena.
7 Acknowledgements
The ALICE Collaboration would like to thank all its engineers and technicians for their invaluable con-tributions to the construction of the experiment and the CERN accelerator teams for the outstanding performance of the LHC complex. The ALICE Collaboration gratefully acknowledges the resources and support provided by all Grid centres and the Worldwide LHC Computing Grid (WLCG) collaboration. The ALICE Collaboration acknowledges the following funding agencies for their support in building and running the ALICE detector: A. I. Alikhanyan National Science Laboratory (Yerevan Physics Institute) Foundation (ANSL), State Committee of Science and World Federation of Scientists (WFS), Arme-nia; Austrian Academy of Sciences and Nationalstiftung für Forschung, Technologie und Entwicklung, Austria; Ministry of Communications and High Technologies, National Nuclear Research Center, Azer-baijan; Conselho Nacional de Desenvolvimento Científico e Tecnológico (CNPq), Universidade Federal do Rio Grande do Sul (UFRGS), Financiadora de Estudos e Projetos (Finep) and Fundação de Am-paro à Pesquisa do Estado de São Paulo (FAPESP), Brazil; Ministry of Science & Technology of China (MSTC), National Natural Science Foundation of China (NSFC) and Ministry of Education of China (MOEC) , China; Ministry of Science, Education and Sport and Croatian Science Foundation, Croatia; Ministry of Education, Youth and Sports of the Czech Republic, Czech Republic; The Danish Council for Independent Research | Natural Sciences, the Carlsberg Foundation and Danish National Research Foundation (DNRF), Denmark; Helsinki Institute of Physics (HIP), Finland; Commissariat à l’Energie Atomique (CEA) and Institut National de Physique Nucléaire et de Physique des Particules (IN2P3) and Centre National de la Recherche Scientifique (CNRS), France; Bundesministerium für Bildung, Wis-senschaft, Forschung und Technologie (BMBF) and GSI Helmholtzzentrum für Schwerionenforschung GmbH, Germany; General Secretariat for Research and Technology, Ministry of Education, Research and Religions, Greece; National Research, Development and Innovation Office, Hungary; Department of Atomic Energy Government of India (DAE), Department of Science and Technology, Government of India (DST), University Grants Commission, Government of India (UGC) and Council of Scien-tific and Industrial Research (CSIR), India; Indonesian Institute of Science, Indonesia; Centro Fermi - Museo Storico della Fisica e Centro Studi e Ricerche Enrico Fermi and Istituto Nazionale di Fisica Nucleare (INFN), Italy; Institute for Innovative Science and Technology , Nagasaki Institute of Applied Science (IIST), Japan Society for the Promotion of Science (JSPS) KAKENHI and Japanese Ministry of Education, Culture, Sports, Science and Technology (MEXT), Japan; Consejo Nacional de Cien-cia (CONACYT) y Tecnología, through Fondo de Cooperación Internacional en CienCien-cia y Tecnología (FONCICYT) and Dirección General de Asuntos del Personal Academico (DGAPA), Mexico; Neder-landse Organisatie voor Wetenschappelijk Onderzoek (NWO), Netherlands; The Research Council of Norway, Norway; Commission on Science and Technology for Sustainable Development in the South (COMSATS), Pakistan; Pontificia Universidad Católica del Perú, Peru; Ministry of Science and Higher Education and National Science Centre, Poland; Korea Institute of Science and Technology Informa-tion and NaInforma-tional Research FoundaInforma-tion of Korea (NRF), Republic of Korea; Ministry of EducaInforma-tion and Scientific Research, Institute of Atomic Physics and Romanian National Agency for Science, Tech-nology and Innovation, Romania; Joint Institute for Nuclear Research (JINR), Ministry of Education and Science of the Russian Federation and National Research Centre Kurchatov Institute, Russia; Min-istry of Education, Science, Research and Sport of the Slovak Republic, Slovakia; National Research Foundation of South Africa, South Africa; Centro de Aplicaciones Tecnológicas y Desarrollo Nuclear (CEADEN), Cubaenergía, Cuba, Ministerio de Ciencia e Innovacion and Centro de Investigaciones En-ergéticas, Medioambientales y Tecnológicas (CIEMAT), Spain; Swedish Research Council (VR) and Knut & Alice Wallenberg Foundation (KAW), Sweden; European Organization for Nuclear Research, Switzerland; National Science and Technology Development Agency (NSDTA), Suranaree University of Technology (SUT) and Office of the Higher Education Commission under NRU project of Thailand, Thailand; Turkish Atomic Energy Agency (TAEK), Turkey; National Academy of Sciences of Ukraine, Ukraine; Science and Technology Facilities Council (STFC), United Kingdom; National Science
Foun-dation of the United States of America (NSF) and United States Department of Energy, Office of Nuclear Physics (DOE NP), United States of America.
References
[1] V. Vovchenko, D. Anchishkin, and L. P. Csernai, “Longitudinal fluctuations of the center of mass of the participants in heavy-ion collisions,” Phys. Rev. C88 no. 1, (2013) 014901,
arXiv:1306.5208 [nucl-th].
[2] R. Raniwala, S. Raniwala, and C. Loizides, “Effects of Longitudinal Fluctuations in Heavy-Ion Collisions ,” arXiv:1608.01428 [nucl-ex].
[3] STAR Collaboration, L. Adamczyk et al., “Global Λ hyperon polarization in nuclear collisions: evidence for the most vortical fluid,” Nature 548 (2017) 62–65, arXiv:1701.06657 [nucl-ex]. [4] F. Becattini, L. Csernai, and D. J. Wang, “Λ polarization in peripheral heavy ion collisions,” Phys.
Rev.C88 no. 3, (2013) 034905, arXiv:1304.4427 [nucl-th]. [Erratum: Phys. Rev.C93,no.6,069901(2016)].
[5] Y. Xie, D. Wang, and L. P. Csernai, “Global Λ polarization in high energy collisions,” Phys. Rev. C95 no. 3, (2017) 031901, arXiv:1703.03770 [nucl-th].
[6] ALICE Collaboration, J. Adam et al., “Event shape engineering for inclusive spectra and elliptic flow in Pb-Pb collisions at√sNN= 2.76 TeV,” Phys. Rev. C93 no. 3, (2016) 034916,
arXiv:1507.06194 [nucl-ex].
[7] PHOBOS Collaboration, B. B. Back et al., “Pseudorapidity distribution of charged particles in d + Au collisions at s(NN)**(1/2) = 200-GeV,” Phys. Rev. Lett. 93 (2004) 082301,
arXiv:nucl-ex/0311009 [nucl-ex].
[8] ALICE Collaboration, B. Abelev et al., “Pseudorapidity density of charged particles in p + Pb collisions at√sNN= 5.02 TeV,” Phys. Rev. Lett. 110 no. 3, (2013) 032301, arXiv:1210.3615
[nucl-ex].
[9] ALICE Collaboration, J. Adam et al., “Centrality dependence of particle production in p-Pb collisions at√sNN= 5.02 TeV,” Phys. Rev. C91 no. 6, (2015) 064905, arXiv:1412.6828
[nucl-ex].
[10] ATLAS Collaboration, G. Aad et al., “Measurement of the centrality dependence of the
charged-particle pseudorapidity distribution in proton–lead collisions at√sNN= 5.02 TeV with the ATLAS detector,” Eur. Phys. J. C76 no. 4, (2016) 199, arXiv:1508.00848 [hep-ex].
[11] P. Steinberg, “Inclusive pseudorapidity distributions in p(d) + A collisions modeled with shifted rapidity distributions,” Submitted to: Phys. Lett. B (2007) , arXiv:nucl-ex/0703002
[NUCL-EX].
[12] A. Bzdak and D. Teaney, “Longitudinal fluctuations of the fireball density in heavy-ion collisions,” Phys. Rev.C87 no. 2, (2013) 024906, arXiv:1210.1965 [nucl-th].
[13] J. Jia, S. Radhakrishnan, and M. Zhou, “Forward-backward multiplicity fluctuation and
longitudinal harmonics in high-energy nuclear collisions,” Phys. Rev. C93 no. 4, (2016) 044905, arXiv:1506.03496 [nucl-th].
[14] ATLAS Collaboration, M. Aaboud et al., “Measurement of forward-backward multiplicity correlations in lead-lead, proton-lead, and proton-proton collisions with the ATLAS detector,” Phys. Rev.C95 no. 6, (2017) 064914, arXiv:1606.08170 [hep-ex].
[15] ALICE Collaboration, K. Aamodt et al., “Elliptic flow of charged particles in Pb-Pb collisions at 2.76 TeV,” Phys. Rev. Lett. 105 (2010) 252302, arXiv:1011.3914 [nucl-ex].
[16] ALICE Collaboration, K. Aamodt et al., “Centrality dependence of the charged-particle
multiplicity density at mid-rapidity in Pb-Pb collisions at√sNN= 2.76 TeV,” Phys. Rev. Lett. 106
(2011) 032301, arXiv:1012.1657 [nucl-ex].
[17] ALICE Collaboration, K. Aamodt et al., “The ALICE experiment at the CERN LHC,” JINST 3 (2008) S08002.
[18] ALICE Collaboration, B. B. Abelev et al., “Performance of the ALICE Experiment at the CERN LHC,” Int. J. Mod. Phys. A29 (2014) 1430044, arXiv:1402.4476 [nucl-ex].
[19] ALICE Collaboration, B. Abelev et al., “Measurement of the Cross Section for Electromagnetic Dissociation with Neutron Emission in Pb-Pb Collisions at√sNN= 2.76 TeV,” Phys. Rev. Lett.
109 (2012) 252302, arXiv:1203.2436 [nucl-ex].
[20] ALICE Collaboration, B. Abelev et al., “Centrality determination of Pb-Pb collisions at√sNN=
2.76 TeV with ALICE,” Phys. Rev. C88 no. 4, (2013) 044909, arXiv:1301.4361 [nucl-ex]. [21] B. Alver, M. Baker, C. Loizides, and P. Steinberg, “The PHOBOS Glauber Monte Carlo ,”
arXiv:0805.4411 [nucl-ex].
[22] ALICE Collaboration, E. Abbas et al., “Centrality dependence of the pseudorapidity density distribution for charged particles in Pb-Pb collisions at√sNN= 2.76 TeV,” Phys. Lett. B726
(2013) 610–622, arXiv:1304.0347 [nucl-ex].
[23] ALICE Collaboration, B. Abelev et al., “Centrality dependence of π, K, p production in Pb-Pb collisions at√sNN= 2.76 TeV,” Phys. Rev. C88 (2013) 044910, arXiv:1303.0737 [hep-ex].
[24] ALICE Collaboration, J. Adam et al., “Centrality evolution of the charged-particle pseudorapidity density over a broad pseudorapidity range in Pb-Pb collisions at√sNN= 2.76 TeV,” Phys. Lett.
B754 (2016) 373–385, arXiv:1509.07299 [nucl-ex].
8 The ALICE Collaboration
S. Acharya137, J. Adam96, D. Adamová93, J. Adolfsson32, M.M. Aggarwal98, G. Aglieri Rinella33,
M. Agnello29, N. Agrawal46, Z. Ahammed137, N. Ahmad15, S.U. Ahn78, S. Aiola141, A. Akindinov63,
M. Al-Turany106, S.N. Alam137, J.L.B. Alba111, D.S.D. Albuquerque122, D. Aleksandrov89, B. Alessandro57, R. Alfaro Molina73, A. Alici11 ,25 ,52, A. Alkin3, J. Alme20, T. Alt69, L. Altenkamper20, I. Altsybeev136, C. Alves Garcia Prado121, C. Andrei86, D. Andreou33, H.A. Andrews110, A. Andronic106, V. Anguelov103, C. Anson96, T. Antiˇci´c107, F. Antinori55, P. Antonioli52, R. Anwar124, L. Aphecetche114, H. Appelshäuser69, S. Arcelli25, R. Arnaldi57, O.W. Arnold104 ,34, I.C. Arsene19, M. Arslandok103, B. Audurier114,
A. Augustinus33, R. Averbeck106, M.D. Azmi15, A. Badalà54, Y.W. Baek59 ,77, S. Bagnasco57, R. Bailhache69, R. Bala100, A. Baldisseri74, M. Ball43, R.C. Baral66 ,87, A.M. Barbano24, R. Barbera26, F. Barile51 ,31,
L. Barioglio24, G.G. Barnaföldi140, L.S. Barnby92, V. Barret131, P. Bartalini7, K. Barth33, E. Bartsch69, M. Basile25, N. Bastid131, S. Basu139, G. Batigne114, B. Batyunya76, P.C. Batzing19, I.G. Bearden90, H. Beck103, C. Bedda62, N.K. Behera59, I. Belikov133, F. Bellini25 ,33, H. Bello Martinez2, R. Bellwied124, L.G.E. Beltran120, V. Belyaev82, G. Bencedi140, S. Beole24, A. Bercuci86, Y. Berdnikov95, D. Berenyi140, R.A. Bertens127, D. Berzano33, L. Betev33, A. Bhasin100, I.R. Bhat100, A.K. Bhati98, B. Bhattacharjee42, J. Bhom118, A. Bianchi24, L. Bianchi124, N. Bianchi49, C. Bianchin139, J. Bielˇcík37, J. Bielˇcíková93,
A. Bilandzic34 ,104, G. Biro140, R. Biswas4, S. Biswas4, J.T. Blair119, D. Blau89, C. Blume69, G. Boca134,
F. Bock81 ,33 ,103, A. Bogdanov82, L. Boldizsár140, M. Bombara38, G. Bonomi135, M. Bonora33, J. Book69,
H. Borel74, A. Borissov103 ,17, M. Borri126, E. Botta24, C. Bourjau90, L. Bratrud69, P. Braun-Munzinger106, M. Bregant121, T.A. Broker69, M. Broz37, E.J. Brucken44, E. Bruna57, G.E. Bruno33 ,31, D. Budnikov108,
H. Buesching69, S. Bufalino29, P. Buhler113, P. Buncic33, O. Busch130, Z. Buthelezi75, J.B. Butt14,
J.T. Buxton16, J. Cabala116, D. Caffarri33 ,91, H. Caines141, A. Caliva62 ,106, E. Calvo Villar111, P. Camerini23, A.A. Capon113, F. Carena33, W. Carena33, F. Carnesecchi25 ,11, J. Castillo Castellanos74, A.J. Castro127, E.A.R. Casula53, C. Ceballos Sanchez9, P. Cerello57, S. Chandra137, B. Chang125, S. Chapeland33,
M. Chartier126, S. Chattopadhyay137, S. Chattopadhyay109, A. Chauvin34 ,104, C. Cheshkov132, B. Cheynis132, V. Chibante Barroso33, D.D. Chinellato122, S. Cho59, P. Chochula33, M. Chojnacki90, S. Choudhury137, T. Chowdhury131, P. Christakoglou91, C.H. Christensen90, P. Christiansen32, T. Chujo130, S.U. Chung17, C. Cicalo53, L. Cifarelli11 ,25, F. Cindolo52, J. Cleymans99, F. Colamaria31, D. Colella33 ,64 ,51, A. Collu81, M. Colocci25, M. Concas57 ,ii, G. Conesa Balbastre80, Z. Conesa del Valle60, M.E. Connors141 ,iii,
J.G. Contreras37, T.M. Cormier94, Y. Corrales Morales57, I. Cortés Maldonado2, P. Cortese30,
M.R. Cosentino123, F. Costa33, S. Costanza134, J. Crkovská60, P. Crochet131, E. Cuautle71, L. Cunqueiro70,
T. Dahms34 ,104, A. Dainese55, M.C. Danisch103, A. Danu67, D. Das109, I. Das109, S. Das4, A. Dash87,
S. Dash46, S. De47 ,121, A. De Caro28, G. de Cataldo51, C. de Conti121, J. de Cuveland40, A. De Falco22, D. De
Gruttola28 ,11, N. De Marco57, S. De Pasquale28, R.D. De Souza122, H.F. Degenhardt121, A. Deisting106 ,103, A. Deloff85, C. Deplano91, P. Dhankher46, D. Di Bari31, A. Di Mauro33, P. Di Nezza49, B. Di Ruzza55, T. Dietel99, P. Dillenseger69, R. Divià33, Ø. Djuvsland20, A. Dobrin33, D. Domenicis Gimenez121,
B. Dönigus69, O. Dordic19, L.V.R. Doremalen62, A.K. Dubey137, A. Dubla106, L. Ducroux132, A.K. Duggal98, M. Dukhishyam87, P. Dupieux131, R.J. Ehlers141, D. Elia51, E. Endress111, H. Engel68, E. Epple141,
B. Erazmus114, F. Erhardt97, B. Espagnon60, S. Esumi130, G. Eulisse33, J. Eum17, D. Evans110,
S. Evdokimov112, L. Fabbietti104 ,34, J. Faivre80, A. Fantoni49, M. Fasel94 ,81, L. Feldkamp70, A. Feliciello57, G. Feofilov136, A. Fernández Téllez2, A. Ferretti24, A. Festanti27 ,33, V.J.G. Feuillard74 ,131, J. Figiel118, M.A.S. Figueredo121, S. Filchagin108, D. Finogeev61, F.M. Fionda20 ,22, M. Floris33, S. Foertsch75, P. Foka106, S. Fokin89, E. Fragiacomo58, A. Francescon33, A. Francisco114, U. Frankenfeld106, G.G. Fronze24, U. Fuchs33, C. Furget80, A. Furs61, M. Fusco Girard28, J.J. Gaardhøje90, M. Gagliardi24, A.M. Gago111, K. Gajdosova90, M. Gallio24, C.D. Galvan120, P. Ganoti84, C. Garabatos106, E. Garcia-Solis12, K. Garg26, C. Gargiulo33, P. Gasik104 ,34, E.F. Gauger119, M.B. Gay Ducati72, M. Germain114, J. Ghosh109, P. Ghosh137, S.K. Ghosh4,
P. Gianotti49, P. Giubellino106 ,33 ,57, P. Giubilato27, E. Gladysz-Dziadus118, P. Glässel103, D.M. Goméz
Coral73, A. Gomez Ramirez68, A.S. Gonzalez33, P. González-Zamora2, S. Gorbunov40, L. Görlich118,
S. Gotovac117, V. Grabski73, L.K. Graczykowski138, K.L. Graham110, L. Greiner81, A. Grelli62, C. Grigoras33, V. Grigoriev82, A. Grigoryan1, S. Grigoryan76, J.M. Gronefeld106, F. Grosa29, J.F. Grosse-Oetringhaus33, R. Grosso106, L. Gruber113, F. Guber61, R. Guernane80, B. Guerzoni25, K. Gulbrandsen90, T. Gunji129, A. Gupta100, R. Gupta100, I.B. Guzman2, R. Haake33, C. Hadjidakis60, H. Hamagaki83, G. Hamar140, J.C. Hamon133, M.R. Haque62, J.W. Harris141, A. Harton12, H. Hassan80, D. Hatzifotiadou11 ,52,
S. Hayashi129, S.T. Heckel69, E. Hellbär69, H. Helstrup35, A. Herghelegiu86, E.G. Hernandez2, G. Herrera Corral10, F. Herrmann70, B.A. Hess102, K.F. Hetland35, H. Hillemanns33, C. Hills126, B. Hippolyte133, J. Hladky65, B. Hohlweger104, D. Horak37, S. Hornung106, R. Hosokawa80 ,130, P. Hristov33, C. Hughes127, T.J. Humanic16, N. Hussain42, T. Hussain15, D. Hutter40, D.S. Hwang18, S.A. Iga Buitron71, R. Ilkaev108, M. Inaba130, M. Ippolitov82 ,89, M. Irfan15, M.S. Islam109, M. Ivanov106, V. Ivanov95, V. Izucheev112, B. Jacak81, N. Jacazio25, P.M. Jacobs81, M.B. Jadhav46, J. Jadlovsky116, S. Jaelani62, C. Jahnke34,
M.J. Jakubowska138, M.A. Janik138, P.H.S.Y. Jayarathna124, C. Jena87, S. Jena124, M. Jercic97, R.T. Jimenez Bustamante106, P.G. Jones110, A. Jusko110, P. Kalinak64, A. Kalweit33, J.H. Kang142, V. Kaplin82, S. Kar137,
A. Karasu Uysal79, O. Karavichev61, T. Karavicheva61, L. Karayan106 ,103, P. Karczmarczyk33,
E. Karpechev61, U. Kebschull68, R. Keidel143, D.L.D. Keijdener62, M. Keil33, B. Ketzer43, Z. Khabanova91,
P. Khan109, S.A. Khan137, A. Khanzadeev95, Y. Kharlov112, A. Khatun15, A. Khuntia47, M.M. Kielbowicz118, B. Kileng35, B. Kim130, D. Kim142, D.J. Kim125, H. Kim142, J.S. Kim41, J. Kim103, M. Kim59, M. Kim142, S. Kim18, T. Kim142, S. Kirsch40, I. Kisel40, S. Kiselev63, A. Kisiel138, G. Kiss140, J.L. Klay6, C. Klein69, J. Klein33, C. Klein-Bösing70, S. Klewin103, A. Kluge33, M.L. Knichel103 ,33, A.G. Knospe124, C. Kobdaj115, M. Kofarago140, M.K. Köhler103, T. Kollegger106, V. Kondratiev136, N. Kondratyeva82, E. Kondratyuk112, A. Konevskikh61, M. Konyushikhin139, M. Kopcik116, M. Kour100, C. Kouzinopoulos33, O. Kovalenko85, V. Kovalenko136, M. Kowalski118, G. Koyithatta Meethaleveedu46, I. Králik64, A. Kravˇcáková38, L. Kreis106, M. Krivda110 ,64, F. Krizek93, E. Kryshen95, M. Krzewicki40, A.M. Kubera16, V. Kuˇcera93, C. Kuhn133, P.G. Kuijer91, A. Kumar100, J. Kumar46, L. Kumar98, S. Kumar46, S. Kundu87, P. Kurashvili85, A. Kurepin61, A.B. Kurepin61, A. Kuryakin108, S. Kushpil93, M.J. Kweon59, Y. Kwon142, S.L. La Pointe40, P. La Rocca26, C. Lagana Fernandes121, Y.S. Lai81, I. Lakomov33, R. Langoy39, K. Lapidus141, C. Lara68, A. Lardeux74 ,19, A. Lattuca24, E. Laudi33, R. Lavicka37, R. Lea23, L. Leardini103, S. Lee142, F. Lehas91, S. Lehner113, J. Lehrbach40, R.C. Lemmon92, V. Lenti51, E. Leogrande62, I. León Monzón120, P. Lévai140, X. Li13,
J. Lien39, R. Lietava110, B. Lim17, S. Lindal19, V. Lindenstruth40, S.W. Lindsay126, C. Lippmann106, M.A. Lisa16, V. Litichevskyi44, W.J. Llope139, D.F. Lodato62, P.I. Loenne20, V. Loginov82, C. Loizides81, P. Loncar117, X. Lopez131, E. López Torres9, A. Lowe140, P. Luettig69, J.R. Luhder70, M. Lunardon27, G. Luparello58 ,23, M. Lupi33, T.H. Lutz141, A. Maevskaya61, M. Mager33, S. Mahajan100, S.M. Mahmood19, A. Maire133, R.D. Majka141, M. Malaev95, L. Malinina76 ,iv, D. Mal’Kevich63, P. Malzacher106,
A. Mamonov108, V. Manko89, F. Manso131, V. Manzari51, Y. Mao7, M. Marchisone75 ,128, J. Mareš65,
G.V. Margagliotti23, A. Margotti52, J. Margutti62, A. Marín106, C. Markert119, M. Marquard69, N.A. Martin106, P. Martinengo33, J.A.L. Martinez68, M.I. Martínez2, G. Martínez García114, M. Martinez Pedreira33,
S. Masciocchi106, M. Masera24, A. Masoni53, E. Masson114, A. Mastroserio51, A.M. Mathis104 ,34, P.F.T. Matuoka121, A. Matyja127, C. Mayer118, J. Mazer127, M. Mazzilli31, M.A. Mazzoni56, F. Meddi21, Y. Melikyan82, A. Menchaca-Rocha73, E. Meninno28, J. Mercado Pérez103, M. Meres36, S. Mhlanga99,
Y. Miake130, M.M. Mieskolainen44, D.L. Mihaylov104, K. Mikhaylov63 ,76, J. Milosevic19, A. Mischke62,
A.N. Mishra47, D. Mi´skowiec106, J. Mitra137, C.M. Mitu67, N. Mohammadi62, B. Mohanty87, M. Mohisin
Khan15 ,v, D.A. Moreira De Godoy70, L.A.P. Moreno2, S. Moretto27, A. Morreale114, A. Morsch33, V. Muccifora49, E. Mudnic117, D. Mühlheim70, S. Muhuri137, M. Mukherjee4, J.D. Mulligan141,
M.G. Munhoz121, K. Münning43, R.H. Munzer69, H. Murakami129, S. Murray75, L. Musa33, J. Musinsky64, C.J. Myers124, J.W. Myrcha138, D. Nag4, B. Naik46, R. Nair85, B.K. Nandi46, R. Nania52 ,11, E. Nappi51, A. Narayan46, M.U. Naru14, H. Natal da Luz121, C. Nattrass127, S.R. Navarro2, K. Nayak87, R. Nayak46, T.K. Nayak137, S. Nazarenko108, A. Nedosekin63, R.A. Negrao De Oliveira33, L. Nellen71, S.V. Nesbo35, F. Ng124, M. Nicassio106, M. Niculescu67, J. Niedziela138 ,33, B.S. Nielsen90, S. Nikolaev89, S. Nikulin89, V. Nikulin95, F. Noferini11 ,52, P. Nomokonov76, G. Nooren62, J.C.C. Noris2, J. Norman126, A. Nyanin89, J. Nystrand20, H. Oeschler17 ,103 ,i, S. Oh141, A. Ohlson33 ,103, T. Okubo45, L. Olah140, J. Oleniacz138, A.C. Oliveira Da Silva121, M.H. Oliver141, J. Onderwaater106, C. Oppedisano57, R. Orava44, M. Oravec116, A. Ortiz Velasquez71, A. Oskarsson32, J. Otwinowski118, K. Oyama83, Y. Pachmayer103, V. Pacik90, D. Pagano135, P. Pagano28, G. Pai´c71, P. Palni7, J. Pan139, A.K. Pandey46, S. Panebianco74, V. Papikyan1, G.S. Pappalardo54, P. Pareek47, J. Park59, S. Parmar98, A. Passfeld70, S.P. Pathak124, R.N. Patra137, B. Paul57,
H. Pei7, T. Peitzmann62, X. Peng7, L.G. Pereira72, H. Pereira Da Costa74, D. Peresunko89 ,82, E. Perez
Lezama69, V. Peskov69, Y. Pestov5, V. Petráˇcek37, V. Petrov112, M. Petrovici86, C. Petta26, R.P. Pezzi72,
S. Piano58, M. Pikna36, P. Pillot114, L.O.D.L. Pimentel90, O. Pinazza52 ,33, L. Pinsky124, D.B. Piyarathna124, M. Płosko´n81, M. Planinic97, F. Pliquett69, J. Pluta138, S. Pochybova140, P.L.M. Podesta-Lerma120,
M.G. Poghosyan94, B. Polichtchouk112, N. Poljak97, W. Poonsawat115, A. Pop86, H. Poppenborg70, S. Porteboeuf-Houssais131, V. Pozdniakov76, S.K. Prasad4, R. Preghenella52, F. Prino57, C.A. Pruneau139, I. Pshenichnov61, M. Puccio24, G. Puddu22, P. Pujahari139, V. Punin108, J. Putschke139, S. Raha4, S. Rajput100, J. Rak125, A. Rakotozafindrabe74, L. Ramello30, F. Rami133, D.B. Rana124, R. Raniwala101, S. Raniwala101, S.S. Räsänen44, B.T. Rascanu69, D. Rathee98, V. Ratza43, I. Ravasenga29, K.F. Read127 ,94, K. Redlich85 ,vi, A. Rehman20, P. Reichelt69, F. Reidt33, X. Ren7, R. Renfordt69, A.R. Reolon49, A. Reshetin61, K. Reygers103, V. Riabov95, R.A. Ricci50, T. Richert32, M. Richter19, P. Riedler33, W. Riegler33, F. Riggi26, C. Ristea67, M. Rodríguez Cahuantzi2, K. Røed19, E. Rogochaya76, D. Rohr33 ,40, D. Röhrich20, P.S. Rokita138, F. Ronchetti49, E.D. Rosas71, P. Rosnet131, A. Rossi27 ,55, A. Rotondi134, F. Roukoutakis84, A. Roy47, C. Roy133, P. Roy109, O.V. Rueda71, R. Rui23, B. Rumyantsev76, A. Rustamov88, E. Ryabinkin89, Y. Ryabov95, A. Rybicki118, S. Saarinen44, S. Sadhu137, S. Sadovsky112, K. Šafaˇrík33, S.K. Saha137,
B. Sahlmuller69, B. Sahoo46, P. Sahoo47, R. Sahoo47, S. Sahoo66, P.K. Sahu66, J. Saini137, S. Sakai130,
M.A. Saleh139, J. Salzwedel16, S. Sambyal100, V. Samsonov95 ,82, A. Sandoval73, D. Sarkar137, N. Sarkar137,
P. Sarma42, M.H.P. Sas62, E. Scapparone52, F. Scarlassara27, B. Schaefer94, R.P. Scharenberg105, H.S. Scheid69, C. Schiaua86, R. Schicker103, C. Schmidt106, H.R. Schmidt102, M.O. Schmidt103, M. Schmidt102, N.V. Schmidt94 ,69, J. Schukraft33, Y. Schutz33 ,133, K. Schwarz106, K. Schweda106,
G. Scioli25, E. Scomparin57, M. Šefˇcík38, J.E. Seger96, Y. Sekiguchi129, D. Sekihata45, I. Selyuzhenkov106 ,82, K. Senosi75, S. Senyukov3 ,133 ,33, E. Serradilla73, P. Sett46, A. Sevcenco67, A. Shabanov61, A. Shabetai114, R. Shahoyan33, W. Shaikh109, A. Shangaraev112, A. Sharma98, A. Sharma100, M. Sharma100, M. Sharma100, N. Sharma98 ,127, A.I. Sheikh137, K. Shigaki45, Q. Shou7, K. Shtejer9 ,24, Y. Sibiriak89, S. Siddhanta53, K.M. Sielewicz33, T. Siemiarczuk85, S. Silaeva89, D. Silvermyr32, C. Silvestre80, G. Simatovic97,
G. Simonetti33, R. Singaraju137, R. Singh87, V. Singhal137, T. Sinha109, B. Sitar36, M. Sitta30, T.B. Skaali19, M. Slupecki125, N. Smirnov141, R.J.M. Snellings62, T.W. Snellman125, J. Song17, M. Song142, F. Soramel27, S. Sorensen127, F. Sozzi106, E. Spiriti49, I. Sputowska118, B.K. Srivastava105, J. Stachel103, I. Stan67, P. Stankus94, E. Stenlund32, D. Stocco114, M.M. Storetvedt35, P. Strmen36, A.A.P. Suaide121, T. Sugitate45, C. Suire60, M. Suleymanov14, M. Suljic23, R. Sultanov63, M. Šumbera93, S. Sumowidagdo48, K. Suzuki113,
S. Swain66, A. Szabo36, I. Szarka36, U. Tabassam14, J. Takahashi122, G.J. Tambave20, N. Tanaka130, M. Tarhini60, M. Tariq15, M.G. Tarzila86, A. Tauro33, G. Tejeda Muñoz2, A. Telesca33, K. Terasaki129, C. Terrevoli27, B. Teyssier132, D. Thakur47, S. Thakur137, D. Thomas119, F. Thoresen90, R. Tieulent132, A. Tikhonov61, A.R. Timmins124, A. Toia69, S.R. Torres120, S. Tripathy47, S. Trogolo24, G. Trombetta31, L. Tropp38, V. Trubnikov3, W.H. Trzaska125, B.A. Trzeciak62, T. Tsuji129, A. Tumkin108, R. Turrisi55, T.S. Tveter19, K. Ullaland20, E.N. Umaka124, A. Uras132, G.L. Usai22, A. Utrobicic97, M. Vala116 ,64, J. Van Der Maarel62, J.W. Van Hoorne33, M. van Leeuwen62, T. Vanat93, P. Vande Vyvre33, D. Varga140, A. Vargas2, M. Vargyas125, R. Varma46, M. Vasileiou84, A. Vasiliev89, A. Vauthier80, O. Vázquez Doce104 ,34,
V. Vechernin136, A.M. Veen62, A. Velure20, E. Vercellin24, S. Vergara Limón2, R. Vernet8, R. Vértesi140, L. Vickovic117, S. Vigolo62, J. Viinikainen125, Z. Vilakazi128, O. Villalobos Baillie110, A. Villatoro Tello2, A. Vinogradov89, L. Vinogradov136, T. Virgili28, V. Vislavicius32, A. Vodopyanov76, M.A. Völkl103 ,102,
K. Voloshin63, S.A. Voloshin139, G. Volpe31, B. von Haller33, I. Vorobyev104 ,34, D. Voscek116,
D. Vranic33 ,106, J. Vrláková38, B. Wagner20, H. Wang62, M. Wang7, D. Watanabe130, Y. Watanabe129 ,130,
M. Weber113, S.G. Weber106, D.F. Weiser103, S.C. Wenzel33, J.P. Wessels70, U. Westerhoff70, A.M. Whitehead99, J. Wiechula69, J. Wikne19, G. Wilk85, J. Wilkinson103 ,52, G.A. Willems33 ,70,
M.C.S. Williams52, E. Willsher110, B. Windelband103, W.E. Witt127, S. Yalcin79, K. Yamakawa45, P. Yang7, S. Yano45, Z. Yin7, H. Yokoyama130 ,80, I.-K. Yoo17, J.H. Yoon59, V. Yurchenko3, V. Zaccolo57, A. Zaman14, C. Zampolli33, H.J.C. Zanoli121, N. Zardoshti110, A. Zarochentsev136, P. Závada65, N. Zaviyalov108,
H. Zbroszczyk138, M. Zhalov95, H. Zhang20 ,7, X. Zhang7, Y. Zhang7, C. Zhang62, Z. Zhang7 ,131, C. Zhao19, N. Zhigareva63, D. Zhou7, Y. Zhou90, Z. Zhou20, H. Zhu20, J. Zhu7, A. Zichichi25 ,11, A. Zimmermann103, M.B. Zimmermann33, G. Zinovjev3, J. Zmeskal113, S. Zou7,
Affiliation notes
iDeceased
iiDipartimento DET del Politecnico di Torino, Turin, Italy iiiGeorgia State University, Atlanta, Georgia, United States
ivM.V. Lomonosov Moscow State University, D.V. Skobeltsyn Institute of Nuclear, Physics, Moscow, Russia vDepartment of Applied Physics, Aligarh Muslim University, Aligarh, India
viInstitute of Theoretical Physics, University of Wroclaw, Poland
Collaboration Institutes
1 A.I. Alikhanyan National Science Laboratory (Yerevan Physics Institute) Foundation, Yerevan, Armenia 2 Benemérita Universidad Autónoma de Puebla, Puebla, Mexico
3 Bogolyubov Institute for Theoretical Physics, Kiev, Ukraine
4 Bose Institute, Department of Physics and Centre for Astroparticle Physics and Space Science (CAPSS),
Kolkata, India
5 Budker Institute for Nuclear Physics, Novosibirsk, Russia
6 California Polytechnic State University, San Luis Obispo, California, United States 7 Central China Normal University, Wuhan, China
8 Centre de Calcul de l’IN2P3, Villeurbanne, Lyon, France
9 Centro de Aplicaciones Tecnológicas y Desarrollo Nuclear (CEADEN), Havana, Cuba
10 Centro de Investigación y de Estudios Avanzados (CINVESTAV), Mexico City and Mérida, Mexico 11 Centro Fermi - Museo Storico della Fisica e Centro Studi e Ricerche “Enrico Fermi’, Rome, Italy 12 Chicago State University, Chicago, Illinois, United States
13 China Institute of Atomic Energy, Beijing, China
14 COMSATS Institute of Information Technology (CIIT), Islamabad, Pakistan 15 Department of Physics, Aligarh Muslim University, Aligarh, India
16 Department of Physics, Ohio State University, Columbus, Ohio, United States 17 Department of Physics, Pusan National University, Pusan, Republic of Korea 18 Department of Physics, Sejong University, Seoul, Republic of Korea
19 Department of Physics, University of Oslo, Oslo, Norway
20 Department of Physics and Technology, University of Bergen, Bergen, Norway 21 Dipartimento di Fisica dell’Università ’La Sapienza’ and Sezione INFN, Rome, Italy 22 Dipartimento di Fisica dell’Università and Sezione INFN, Cagliari, Italy
24 Dipartimento di Fisica dell’Università and Sezione INFN, Turin, Italy
25 Dipartimento di Fisica e Astronomia dell’Università and Sezione INFN, Bologna, Italy 26 Dipartimento di Fisica e Astronomia dell’Università and Sezione INFN, Catania, Italy 27 Dipartimento di Fisica e Astronomia dell’Università and Sezione INFN, Padova, Italy
28 Dipartimento di Fisica ‘E.R. Caianiello’ dell’Università and Gruppo Collegato INFN, Salerno, Italy 29 Dipartimento DISAT del Politecnico and Sezione INFN, Turin, Italy
30 Dipartimento di Scienze e Innovazione Tecnologica dell’Università del Piemonte Orientale and INFN
Sezione di Torino, Alessandria, Italy
31 Dipartimento Interateneo di Fisica ‘M. Merlin’ and Sezione INFN, Bari, Italy 32 Division of Experimental High Energy Physics, University of Lund, Lund, Sweden 33 European Organization for Nuclear Research (CERN), Geneva, Switzerland 34 Excellence Cluster Universe, Technische Universität München, Munich, Germany 35 Faculty of Engineering, Bergen University College, Bergen, Norway
36 Faculty of Mathematics, Physics and Informatics, Comenius University, Bratislava, Slovakia
37 Faculty of Nuclear Sciences and Physical Engineering, Czech Technical University in Prague, Prague,
Czech Republic
38 Faculty of Science, P.J. Šafárik University, Košice, Slovakia
39 Faculty of Technology, Buskerud and Vestfold University College, Tonsberg, Norway
40 Frankfurt Institute for Advanced Studies, Johann Wolfgang Goethe-Universität Frankfurt, Frankfurt,
Germany
41 Gangneung-Wonju National University, Gangneung, Republic of Korea 42 Gauhati University, Department of Physics, Guwahati, India
43 Helmholtz-Institut für Strahlen- und Kernphysik, Rheinische Friedrich-Wilhelms-Universität Bonn, Bonn,
Germany
44 Helsinki Institute of Physics (HIP), Helsinki, Finland 45 Hiroshima University, Hiroshima, Japan
46 Indian Institute of Technology Bombay (IIT), Mumbai, India 47 Indian Institute of Technology Indore, Indore, India
48 Indonesian Institute of Sciences, Jakarta, Indonesia 49 INFN, Laboratori Nazionali di Frascati, Frascati, Italy 50 INFN, Laboratori Nazionali di Legnaro, Legnaro, Italy 51 INFN, Sezione di Bari, Bari, Italy
52 INFN, Sezione di Bologna, Bologna, Italy 53 INFN, Sezione di Cagliari, Cagliari, Italy 54 INFN, Sezione di Catania, Catania, Italy 55 INFN, Sezione di Padova, Padova, Italy 56 INFN, Sezione di Roma, Rome, Italy 57 INFN, Sezione di Torino, Turin, Italy 58 INFN, Sezione di Trieste, Trieste, Italy 59 Inha University, Incheon, Republic of Korea
60 Institut de Physique Nucléaire d’Orsay (IPNO), Université Paris-Sud, CNRS-IN2P3, Orsay, France 61 Institute for Nuclear Research, Academy of Sciences, Moscow, Russia
62 Institute for Subatomic Physics of Utrecht University, Utrecht, Netherlands 63 Institute for Theoretical and Experimental Physics, Moscow, Russia
64 Institute of Experimental Physics, Slovak Academy of Sciences, Košice, Slovakia
65 Institute of Physics, Academy of Sciences of the Czech Republic, Prague, Czech Republic 66 Institute of Physics, Bhubaneswar, India
67 Institute of Space Science (ISS), Bucharest, Romania
68 Institut für Informatik, Johann Wolfgang Goethe-Universität Frankfurt, Frankfurt, Germany 69 Institut für Kernphysik, Johann Wolfgang Goethe-Universität Frankfurt, Frankfurt, Germany 70 Institut für Kernphysik, Westfälische Wilhelms-Universität Münster, Münster, Germany
71 Instituto de Ciencias Nucleares, Universidad Nacional Autónoma de México, Mexico City, Mexico 72 Instituto de Física, Universidade Federal do Rio Grande do Sul (UFRGS), Porto Alegre, Brazil 73 Instituto de Física, Universidad Nacional Autónoma de México, Mexico City, Mexico
74 IRFU, CEA, Université Paris-Saclay, Saclay, France