HAL Id: tel-02981706
https://tel.archives-ouvertes.fr/tel-02981706
Submitted on 28 Oct 2020HAL is a multi-disciplinary open access
archive for the deposit and dissemination of sci-entific research documents, whether they are pub-lished or not. The documents may come from teaching and research institutions in France or abroad, or from public or private research centers.
L’archive ouverte pluridisciplinaire HAL, est destinée au dépôt et à la diffusion de documents scientifiques de niveau recherche, publiés ou non, émanant des établissements d’enseignement et de recherche français ou étrangers, des laboratoires publics ou privés.
flow in laminate viscous discontinuous composites
Gregoire Sorba
To cite this version:
Gregoire Sorba. Experimental study and numerical modelling of squeeze flow in laminate viscous dis-continuous composites. Fluids mechanics [physics.class-ph]. École centrale de Nantes, 2017. English. �NNT : 2017ECDN0038�. �tel-02981706�
Grégoire SORBA
JURY
Président du jury : ALLIX Olivier, Professeur des Universités, ENS Paris-Saclay
Mémoire présenté en vue de lʼobtention
du grade de Docteur de lʼEcole Centrale de Nantes Sous le label de l’UNIVERSITÉ BRETAGNE LOIRE
École doctorale : Sciences pour l’Ingénieur (SPI)
Discipline : Mécanique des solides, des matériaux, des structures et des surfaces Unité de recherche : UMR 6183 – Institut de recherche et génie civil et mécanique Soutenue le 4 décembre 2017
Etude expérimentale et modélisation numérique des
écoulements de compression dans les composites
Grégoire SORBA
Etude expérimentale et modélisation numérique des écoulements de
compression dans les composites stratifiés visqueux à plis discontinus
Experimental study and numerical modelling of squeeze flow in
laminate viscous discontinuous composites
RésuméLa liberté de conception des composites peut être améliorée par la combinaison de préimprégnés continus et discontinus. Le formage d’un empilement préchauffé constitué de plis discontinus distribués et orientés de manière optimale peut mener à des défauts
inacceptables tels que des plissements dans le plan et hors-plan, glissement de plis, rotation de plis adjacents, flexion de fibres induite par un écoulement de
compression transverse et finalement une distribution des fibres inappropriée et inefficace. Ces phénomènes naissent de la liberté individuelle de déplacement et de déformation des plis discontinus à l’intérieur du moule pendant la phase de formage. Premièrement ce travail présente des expériences conduites afin d’identifier le comportement sous compression d’un empilement de préimprégnés visqueux discontinus unidirectionnels et tissés. Un modèle basé sur une approche fluide hétérogène visqueux isotrope transverse est ensuite développé en accord avec les observations
expérimentales. Il est notamment montré que les différents phénomènes observés sont retrouvés
numériquement pour les unidirectionnels et partiellement pour les tissés et que les valeurs prédites sont
globalement en bon accord avec les mesures expérimentales. L’obtention de résultats réalistes nécessite une résolution en 3D avec un maillage relativement fin dans l’épaisseur. Finalement des méthodes numériques avancées sont mises en place afin de tenter de réduire le coût des simulations.
Mots clés
Préimprégnés UD, préimprégnés tissés, propriétés rhéologiques, simulation de procédé, écoulement de compression, fluide isotrope transverse (TIF),
complément de Schur, décomposition en modes propres généralisée (PGD)
Abstract
The design freedom of composites can be improved by combining continuous and discontinuous prepregs. The forming of a pre-heated blank made of optimally oriented and distributed discontinuous prepreg plies may lead to unacceptable defects such as in-plane and out-of-plane wrinkles, sliding of plies, rotation of adjacent plies, bending of fibres induced by transverse squeeze flow and finally to inappropriate and inefficient fibre distribution. This arises because the individual discontinuous plies are free to move and deform in the mould during the forming step. First, this work presents some experiments conducted to identify the behaviour of a stack of unidirectional and woven discontinuous viscous prepregs subjected to through-thickness compression. Then a model based on a heterogeneous transverse isotropic fluid approach is gradually
developped in agreement with the experimental findings. It is shown that the various observed phenomena are retrieved for the unidirectional and partly for the woven prepreg by the numerical model. The predicted values are in good agreement with measurements, when the problem is solved in 3D with a relatively fine mesh in the thickness. Finally an attempt is made to reduce the computational cost by the use of advanced numerical simulation techniques.
Key Words
UD prepreg, woven prepreg, rheological properties, process simulation, squeeze flow, Transversely Isotropic Fluid (TIF), Schur complement, Proper Generalized Decomposition (PGD)
Je souhaite avant toute chose remercier du fond du cœur ma femme Nimeüe pour son soutien continu toutes ces années, sans la patience de qui cette thèse, et tout ce qui a précédé, n’aurait probablement jamais abouti. Ceci est vrai également pour mes deux enfants, Myfanwy et Taliesin, à qui j’adresse aussi mes remerciements, bien qu’ils ne s’en rendront compte que dans quelques années.
Je souhaite également remercier ma famille, et particulièrement mes grand-parents et mon père, pour tout l’amour et le soutien qu’ils m’ont apporté depuis le tout début. Je leur dois toute une partie mémorable et très agréable de ma vie. Je remercie bien sûr spécialement ma sœur et mes frères.
Je remercie vivement Alexis et Quentin pour leur bonne humeur permanente et leurs visites “Tchaka-poum” régulières.
Je tiens à remercier Christophe, Adrien et Sébastien pour l’encadrement scientifique et humain de cette thèse, leur disponibilité, leur aide ainsi que leurs précieux conseils tout du long (et quelques très bonnes blagues). Cette thèse fut pleine de rebondissements mais je ne pouvais l’imaginer plus enrichissante ou plus intéressante. Je remercie aussi Jean-Michel pour toute l’aide logistique pour la partie expérimentale, et les stagiaires qui ont réalisé lesdites expériences.
Je n’oublie bien sûr pas tout les autres membres de l’équipe, les échanges lors des pauses café et les pâtisseries partagées. J’adresse un remerciement spécifique à Nicolas pour avoir accepté d’échanger son écran pour un (légèrement) plus petit.
Je tiens également à remercier Michel, Laurent et Anthony pour m’avoir fait suffisam-ment confiance pour me laisser enseigner dans leur cours. Cette expérience d’enseignesuffisam-ment a été particulièrement intéressante, instructive et formatrice.
Je remercie le Ministère de l’Enseignement Supérieur et de la Recherche pour m’avoir accordé une allocation pour faire ma thèse en me laissant complètement libre du sujet et du contenu, c’est une opportunité incroyable que j’ai grandement appréciée.
General introduction 1
Introduction. . . 1
Forming of discontinuous prepregs . . . 2
Forming modelling and simulation . . . 5
1 Experimental part 7 1.1 Experimental setup . . . 9
1.1.1 Kinematic tracers . . . 9
1.1.2 Unidirectional specimens . . . 10
1.1.3 Woven prepreg specimens . . . 10
1.2 Experimental observations on unidirectional prepregs. . . 12
1.2.1 Compression of a [0]6 stack of Hexcel Hexply M21 prepreg. . . 12
1.2.2 Compression of a [0/90]6 stack of Hexcel Hexply M21 prepreg . . . . 12
1.2.3 Compression of a [+30/-30]3 stack of Hexcel Hexply M21 prepreg. . 14
1.2.4 Copper threads kinematics . . . 15
1.3 Experimental observations on woven prepregs . . . 15
1.3.1 Compression of a [0/20/0] stack of Vizilon™ SU75G1 prepreg . . . . 15
1.3.2 Compression of a [0/80/0] stack of Vizilon™ SU75G1 prepreg . . . . 16
1.3.3 Influence of the specimen size . . . 17
1.3.3.1 Compression of a [0/20/0] stack of Vizilon™ SU75G1 prepreg 18 1.3.4 Influence of the structure . . . 19
1.3.4.1 Compression of a [0/45/0] stack of Vizilon™ SU75G1 prepreg 20 1.3.4.2 Compression of a [0/20/0] stack of Vizilon™ SB75G1 prepreg 20 1.3.4.3 Compression of a [0/45/0] stack of Vizilon™ SB75G1 prepreg 22 1.3.5 Influence of the fibre fraction . . . 23
2.1.2.1 2D plane stress . . . 34 2.1.2.2 2D plane strain. . . 35 2.1.3 Kinematic constraints . . . 35 2.1.4 Explicit update . . . 36 2.1.4.1 Mesh position . . . 36 2.1.4.2 Fibre reorientation . . . 36 2.2 Numerical simulation . . . 37 2.2.1 Weak form . . . 37 2.2.2 Discretisation . . . 38
2.2.3 Choice of shape functions . . . 38
2.2.3.1 Q9-3 element . . . 39
2.2.3.2 Q9-4 element . . . 41
2.3 Results. . . 41
2.3.1 Traction along the fibre direction . . . 42
2.3.1.1 Discontinuous fibre tension . . . 42
2.3.1.2 Continuous fibre tension . . . 43
2.3.2 In-plane shear. . . 44
2.3.2.1 Discontinuous fibre tension . . . 45
2.3.2.2 Continuous fibre tension . . . 46
2.3.2.3 Dynamic results . . . 47
2.3.3 Traction with two different fibre orientations . . . 53
2.3.3.1 Continuous fibre tension . . . 53
2.3.3.2 Discontinuous fibre tension . . . 54
2.3.4 Tensile loading on sinusoidal fibres . . . 55
2.3.5 Discontinuous patch under in-plane shearing, force, velocity and fric-tion force . . . 61
2.3.6 Traction with randomly oriented fibres . . . 64
2.3.7 Pulling out of a single layer from a 0◦ stack . . . 71
2.3.8 45◦ tensile test . . . 74
2.3.8.1 Variation of the applied force . . . 74
2.3.8.2 Variation of the fibre fraction . . . 75
2.3.8.3 Variation of the resin viscosity . . . 76
3 3D Transversely Isotropic Fluid model 80 3.1 Modification of the model . . . 81
3.1.1 3D constitutive model of viscous uniaxial composite . . . 81
3.1.2 Choice of shape functions . . . 81
3.1.2.1 Velocity shape functions. . . 82
3.1.2.2 Pressure/tension shape functions . . . 82
3.1.2.3 Gauss points . . . 83
3.2 Results. . . 84
3.2.1 Stack of unidirectional prepregs . . . 84
3.2.1.1 Cross-ply stack without resin layer interface . . . 84
3.2.1.2 Cross-ply stack with resin layer interface . . . 87
3.2.1.3 [30/-30] stack with resin layer interface . . . 89
3.2.1.4 Single UD ply with thickness variation of the fluid layer . . 91
3.2.1.5 Two UD plies subjected to bending under the self-weight . 92 3.2.1.6 Comparison with experiment . . . 99
3.2.2 Stack of woven prepregs . . . 100
3.2.2.1 [0/20/0] stack of unbalanced prepreg with resin layer in-terface . . . 102
3.2.2.2 [0/80/0] stack of unbalanced prepreg with resin layer in-terface . . . 103
3.2.2.3 [0/20/0] stack of balanced prepreg with resin layer interface106 4 Advanced numerical simulation 110 4.1 Mixed formulation . . . 112 4.1.1 Formulation . . . 112 4.1.2 Reference problem . . . 112 4.2 Penalized formulation . . . 114 4.2.1 Formulation . . . 114 4.2.2 Results . . . 115 4.3 Augmented Lagrangian . . . 118 4.3.1 Uzawa algorithm . . . 118 4.3.2 Conjugate corrections . . . 119 4.4 Schur complement . . . 120 4.5 Performance comparison . . . 121 4.5.1 Residual . . . 122 4.5.2 Iterations . . . 122 4.5.3 CPU time . . . 123 4.5.4 Results . . . 124
4.6 Proper Generalized Decomposition . . . 125
4.6.1 Chosen separation . . . 126
4.6.2 Modified algorithm for computing the Schur complement application 127 4.6.3 Results . . . 127
4.6.3.1 Penalized formulation . . . 127
4.6.3.2 Schur complement formulation . . . 129
Conclusion & further work 133
1 a) UD prepreg deformation and sliding, b) flat multi-material blank before
forming, c) woven prepreg rotation [44]. . . 3
1.1 Configuration of the copper threads. . . 9
1.2 Illustration of the test specimen made with the Vizilon™ prepreg sheets. . 11
1.3 CT-scan of the [0]6stack of Hexcel Hexply M21 prepreg, 400 kN compressive load. Red arrows represent the initial fibre orientation vector. (a) Before squeeze flow. Initial thickness: 1.85 mm. Initial grid space: 10 mm. (b) After squeeze flow. Final thickness: 1.30 mm. . . 12
1.4 CT-scan of the [0/90]6 stack of Hexcel Hexply M21 prepreg, 400kN com-pressive loading. Average expansion of the grid of 15%. (a) Before squeeze flow. Initial thickness: 3.15 mm. Initial grid space: 10 mm. (b) After squeeze flow. Final thickness: 2.38 mm. . . 13
1.5 Photograph of the [0/90]6 sample after compression. . . 14
1.6 CT-scan of the [+30/ − 30]3 stack of Hexcel Hexply M21 prepreg, 350kN compressive loading. Tracers in the mid-plane. Average expansion of the grid between 13% to 16% on 3 repeats. (a) Before squeeze flow. Initial thickness: 1.75 mm. Initial grid space: 10 mm. (b) After squeeze flow. Final thickness: 1.25 mm. . . 15
1.7 CT-scan of the [0/20/0] stack of Vizilon™ SU75G1 prepreg. . . 16
1.8 CT-scan of the [0/80/0] stack of Vizilon™ SU75G1 prepreg. . . 17
1.9 Illustration of the different grid lay ups to study the influence of the speci-men size. . . 18
1.10 CT-scan of [0/20/0] stack of Vizilon™ SU75G1 prepreg. . . 18
1.11 Illustration of the 45◦ grid lay up and the final specimen to study the influence of the structure. . . 19
1.12 CT-scan of [0/45/0] stack of Vizilon™ SU75G1 prepreg. . . 20
1.13 CT-scan of [0/20/0] stack of Vizilon™ SB75G1 prepreg. . . 21
1.14 CT-scan of [0/45/0] stack of Vizilon™ SB75G1 prepreg. . . 22
1.15 CT-scan of [0/20/0] stack of Vizilon™ SU63G1 prepreg. . . 23
1.16 CT-scan of [0/45/0] stack of Vizilon™ SU63G1 prepreg. . . 25
1.17 CT-scan of [0/20/0] stack of Vizilon™ SB63G1 prepreg. . . 26
1.18 CT-scan of [0/45/0] stack of Vizilon™ SB63G1 prepreg. . . 28
2.1 Q9-3 element. . . 39
2.3 Representation of the traction along the fibre direction problem. Velocity is imposed null on the left edge and a horizontal Neumann condition is imposed on the right edge, equal to 1N. The elements are represented, fibres
are horizontally oriented. . . 42
2.4 Results of the traction along the fibre direction using a discontinuous inter-polation for the fibre tension. . . 43
2.5 Results of the traction along the fibre direction using a continuous interpo-lation for the fibre tension. . . 44
2.6 Case of a transverse shear. Velocity is imposed null on the left edge of the mesh and a vertical Neumann condition is imposed on the right edge, equal to 100N. Elements are represented, fibres are placed horizontally. . . 45
2.7 Results of the transverse shear using a discontinuous interpolation for the fibre tension. . . 46
2.8 Results of the transverse shear using a continuous interpolation for the fibre tension. . . 47
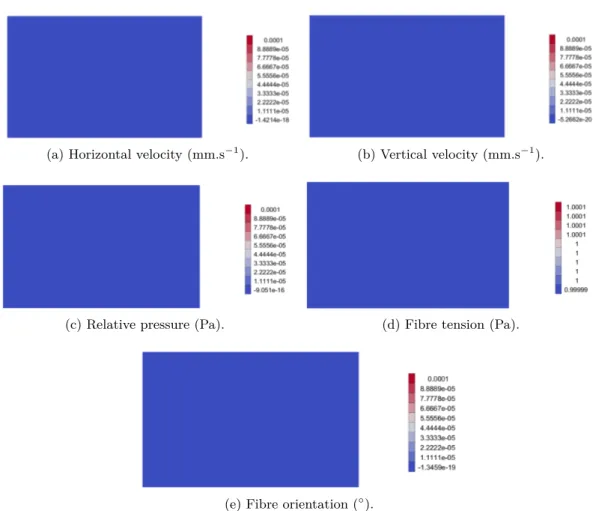
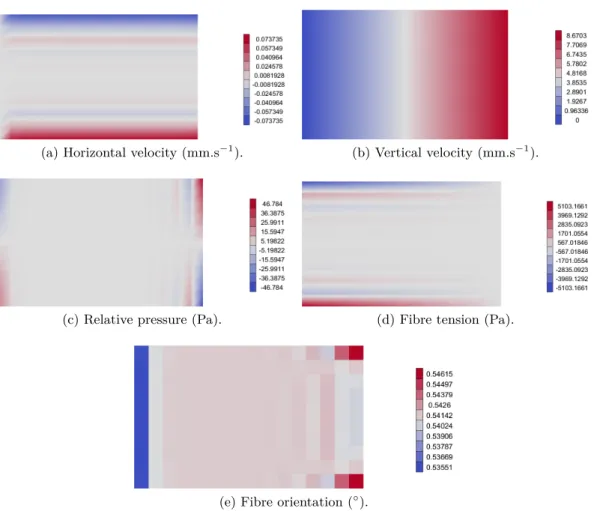
2.9 Horizontal velocity for the plane transverse shear, dynamic simulation. . . . 48
2.10 Vertical velocity for the plane transverse shear, dynamic simulation. . . 49
2.11 Relative pressure for the plane transverse shear, dynamic simulation. . . 50
2.12 Fibre tension for the plane transverse shear, dynamic simulation. . . 51
2.13 Fibre orientation for the plane transverse shear, dynamic simulation. . . 52
2.14 Case of traction with two different fibre orientations problem. Velocity is imposed null on the left side and an horizontal Neumann condition is imposed on the right side, equal to 1N. The fibres on the left half of the domain are horizontal, and vertical in the right half. The elements are represented in the figure.. . . 53
2.15 Results of the traction with two different fibre orientations using a contin-uous interpolation for the fibre tension. . . 54
2.16 Results of the traction with two different fibre orientations using a discon-tinuous interpolation for the fibre tension. . . 55
2.17 Case of tensile loading on sinusoidal fibres. Velocity is imposed null on the left edge of the mesh and a horizontal Neumann condition is imposed on the right edge, equal to 100N. Elements are represented. Fibres describe a sinu-soid in the horizontal direction and their orientation is the same throughout the width. . . 56
2.18 Horizontal velocity for the tensile loading on sinusoidal fibres, dynamic sim-ulation. . . 56
2.19 Vertical velocity for the tensile loading on sinusoidal fibres, dynamic simu-lation. . . 57 2.20 Relative pressure for the tensile loading on sinusoidal fibres, dynamic
sim-2.26 Relative pressure for the patch, dynamic simulation. . . 63 2.27 Fibre tension for the patch, dynamic simulation. . . 64 2.28 Fibre orientation for the patch, dynamic simulation. . . 64 2.29 Case of traction with randomly oriented fibres. Velocity is imposed null on
the left edge of the mesh and a horizontal Neumann condition is imposed on the right edge, equal to 1N. Elements are represented, fibres are randomly oriented within the ±20◦ range. . . 65 2.30 Horizontal velocity for the traction with randomly oriented fibres, dynamic
simulation. . . 66 2.31 Vertical velocity for the traction with randomly oriented fibres, dynamic
simulation. . . 67 2.32 Relative pressure for the traction with randomly oriented fibres, dynamic
simulation. Pressure imposed at the right edge is 103 Pa. . . 68 2.33 Fibre tension for the traction with randomly oriented fibres, dynamic
sim-ulation. . . 69 2.34 Fibre orientation for the traction with randomly oriented fibres, dynamic
simulation. . . 70 2.35 Case of the pulling out of a single layer from a 0◦ stack. Horizontal velocity
is imposed null on the top side, horizontal and vertical velocity is imposed null on the bottom side, a vertical Neumann condition is imposed on the top side, equal to 1N, and an horizontal velocity is imposed on the right side of the middle layer, equal to 1 mm.s−1. . . 71 2.36 Laminate cross-section. The TIF layers are represented in red and the resin
layers are represented in blue. . . 72 2.37 Results of the pulling of a single layer from a 0◦ stack, using a continuous
interpolations for the pressure and the fibre tension. . . 72 2.38 Geometry of the laminate after deformation. The red represents the TIF
layers and the blue represents the resin interfaces. A multiplicative factor of 2 was applied. . . 73 2.39 Case of a tensile test on 45◦ oriented fibres. Velocity is imposed null on
the left edge of the mesh and a horizontal Neumann condition on the right edge which value may vary. Fibres are represented by the blue segments, elements are represented too. . . 74 2.40 Closing angle with respect to time for different values of applied force. . . . 75 2.41 Closing angle with respect to time for different values of fibre fraction. . . . 75 2.42 Closing angle with respect to time for different values of resin viscosity.
The curve for η = 100 Pa.s is not smooth as the computation presented an instability for this value. . . 76 3.1 Nodes of the H27-8 element. . . 82 3.2 Velocity magnitude expressed in mm.s−1. The bottom ply is oriented at
0◦ and the top one at 90◦. . . 85 3.3 Micrography of the thickness of a cross-ply stack. Orientation of the plies
is 90◦. Dark grey area represent a resin rich layer. . . 85 3.4 Deformed interface corresponding to the case in Figure 3.2. A multiplicative
factor of 3 was applied to the deformation to improve visualization. The fibre tension is expressed in Pa. . . 86 3.5 Velocity magnitude expressed in mm.s−1. The bottom ply is oriented at
3.6 Deformed interface corresponding to the case in Figure 3.5. The bottom interface correponds to the tool/composite interface. The top interface if the composite/composite interface. A multiplicative factor of 3 was applied to the deformation to improve visualization. The fibre tension is expressed in Pa. . . 88 3.7 Comparison between the simulation with and without the explicit Stokes
layer interface. Values are taken along the line (x = 0.5mm, y=0.5mm). . . 89 3.8 Velocity magnitude expressed in mm.s−1. The bottom ply is oriented at
30◦ and the top one at -30◦. . . 90 3.9 Decomposition of the velocity field in the middle of the lower ply. The
velocity is expressed in mm.s−1.. . . 91 3.10 Velocity component along the fibre direction. The horizontal velocity is
expressed in mm.s−1. The plain geometry represents the undeformed shape. 92 3.11 X-axis velocity for the bending of two UD plies, dynamic simulation.
Max-imum deflection of the composite plies is 61◦. . . 93 3.12 Y-axis velocity for the bending of two UD plies, dynamic simulation. . . 94 3.13 Z-axis velocity for the bending of two UD plies, dynamic simulation. . . 95 3.14 Relative pressure for the bending of two UD plies, dynamic simulation. . . . 96 3.15 Fibre tension for the bending of two UD plies, dynamic simulation. Yellow
areas represent the domain where the fibre tension is not defined, in this case in the pure resin layer. . . 97 3.16 Details of the unheld edge of the stack, the staircase profile can be clearly
seen as the different layers are not aligned. Yellow areas represent the domain where the fibre tension is not defined, in this case in the pure resin layer.. . . 98 3.17 Deformed geometry of the middle of the TIF layers. The angle is expressed
in◦. . . 99 3.18 Recall of the experiments for comparison with the numerical simulation. . . 101 3.19 Model of the [0/20/0] specimen. In red (thick layer) are the TIF layers and
in blue (thin layer) the resin layers. . . 102 3.20 Comparison of the deformed interfaces for the [0/20/0] specimen. Angles
are expressed in ◦. . . 103 3.21 Comparison of the deformed interfaces for the [0,80,0] specimen. Angles are
expressed in ◦. . . 104 3.22 Comparison of the deformed interfaces for the [0/20/0] balanced specimen.
Angles are expressed in◦. . . 107 4.1 Geometry of the reference problem. TIF layer are represented in red and
4.7 Number of iteration against residual. . . 123 4.8 CPU time against residual. . . 123 4.9 Comparison between the results obtained by applying a direct solver to the
mixed formulation and the results obtained by the presented algorithms. Values are taken along the line (x = 0.5mm, y=0.5mm). . . 124 4.10 Error of the different algorithms compared to the direct solver on the
ref-erence problem. . . 125 4.11 Visual representation of the chosen decomposition. . . 126 4.12 Magnitude of the velocity and warped geometry using the PGD on the
penalized formulation. Velocity is expressed in mm.s−1 . . . 128 4.13 Comparison between the FEM and the PGD approach on the penalized
for-mulation. Values are taken along the line (x = 0.5mm, y=0.5mm). Vertical velocity is not represented.. . . 128 4.14 Comparison the results obtained by applying a direct solver to the mixed
formulation and the results obtained by a PGD solver coupled with the Schur complement formulation. Values are taken along the line (x = 0.5mm, y=0.5mm). . . 129 4.15 Residual against number of iterations for the Schur complement formulation
1 Most frequent defects observed in the thermo-stamping of thermoplastic viscous prepregs, including those obtained with the Quilted Stratum Process
(QSP®). . . 4
1.1 Properties of the Vizilon™ prepreg sheets. . . 11
1.2 Angles for the [0/20/0] stack of Vizilon™ SU75G1 prepreg. . . 16
1.3 Angles for the [0/80/0] stack of Vizilon™ SU75G1 prepreg. . . 16
1.4 Initial and after compression at 0.5 MPa angles for the [0/20/0] stack of Vizilon™ SU75G1 prepreg. . . 19
1.5 Initial and after compression at 0.5 MPa angles for the [0/45/0] stack of Vizilon™ SU75G1 prepreg. . . 20
1.6 Initial and after compression at 0.5 MPa angles for the [0/20/0] stack of Vizilon™ SB75G1 prepreg. . . 21
1.7 Initial and after compression at 0.5 MPa angles for the [0/45/0] stack of Vizilon™ SB75G1 prepreg. . . 22
1.8 Average rotation of the Vizilon™ SU75G1 and SB75G1 prepregs for different stacking sequences. . . 22
1.9 Initial and after compression angles for the [0/20/0] stack of Vizilon™ SU63G1 prepreg. . . 24
1.10 Initial and after compression angles for the [0/45/0] stack of Vizilon™ SU63G1 prepreg. . . 24
1.11 Initial and after compression angles for the [0/20/0] stack of Vizilon™ SB63G1 prepreg. . . 27
1.12 Initial and after compression angles for the [0/45/0] stack of Vizilon™ SB63G1 prepreg. . . 27
3.6 Results of the sensitivity study . . . 100 3.7 Computed angles for a 20◦ initial orientation. Comparison between
exper-imental and numerical values. The total numerical value is the sum of the computed differences. . . 103 3.8 Computed angles for a 80◦ initial orientation. Comparison between
exper-imental and numerical values. The total numerical value is the sum of the computed differences. . . 105 3.9 Computed angles for a 20◦ initial orientation for the balanced specimen.
Comparison between experimental and numerical values. The total numer-ical value is the sum of the computed differences. . . 106
Introduction
One of the key advantages in designing fibre reinforced polymer composites is design flex-ibility. Polymer composites can be shaped in very complex forms to meet design require-ments. An important distinctive property of continuous fibre reinforced polymer (CFRP) is its high stiffness to weight ratio, making it suitable for structural components. Glass and carbon fibres are primarily used for structural applications; however only carbon fibres can fulfil the highest specifications. There is a choice between two classes of polymers, thermoset or thermoplastic polymers. The latter, re-moulded multiple times as long as properties are kept at an acceptable level, makes components more suitable for recycling and assembling by welding technologies. The ability of thermoplastics to melt allows for fast and cost-effective manufacturing processes, which is a crucial property for the auto-motive industry. A key question concerns the processing technology able to manufacture the part as designed, to meet very short cycle times.
Although some processes like pultrusion and filament winding can process individual yarns to produce parts, fibres are usually arranged in the form of sheets, either in the form of dry textile products or in the form of prepregs. A prepreg is a flat sheet that combines fibres and thermoplastic or an uncured thermoset matrix. To get a structural 3D part at a production rate suitable for the automotive industry, one of the available processes is to form the initially planar prepreg into a final 3D shape during forming. As far as automotive applications are concerned, low cycle time processes are sought. Good candidates are thermo-stamping processes where a pre-consolidated flat thermoplastic laminate is heated up above the melting temperature of the polymer matrix, and when the matrix material has melted, it is formed into the final 3D shape. Typical examples of technologies are autoclave-forming, diaphragm-forming and press-forming. Autoclave-forming and to a certain extent diaphragm-forming are too labour-intensive and not fast enough for
mass-Currently, new promising methods like automated fibre placement (also called au-tomated tape laying) are under development as well. Though it is a costly process, it increases the design flexibility even further by allowing full control of the fibre deposi-tion. However current technologies are not fast enough to be used for the mass production of composites. An alternative is to further develop the thermo-forming of thermoplastic materials combining continuous and discontinuous prepregs. Discontinuous prepregs are patches used to locally strengthen the part. They can be viewed as an intermediate ma-terial solution between the large continuous sheets and individual yarn. The structural analysis helps to identify locations where a part needs to be particularly reinforced with continuous fibre reinforced composites and where the part is less mechanically loaded, al-lowing cheaper composites to be used. Based on that information, parts can be optimally designed to improve the design with respect to cost.
Forming of discontinuous prepregs
A good example of technology that can offer a good traoff between flexibility in de-sign and a high production rate is the new technology QSP® (Quilted Stratum Process) developed by CETIM and its partners. This technology is based on a new design and manufacturing concept applied to structural thermoplastic composite parts initiated by Cetim and École Centrale de Nantes in 2012. It aims at providing a solution to a major challenge: produce high quality composite parts at a cost equivalent to that of a steel part in a context of middle to high rate production, especially for the automotive market. The QSP® relies on the manufacturing of a multi-thickness / multi-material blank made of pultruded unidirectional patches and discontinuous woven thermoplastic prepregs. This blank is then preheated, formed under press and overmoulded, leading to a net shaped part in one operation. The main advantages of this technology are:
• The us of noble (and costly) materials only where necessary (traditional technology uses noble organo-sheets with the same thickness throughout).
• Greatly reduced wasteage (with traditional technology, 30% to 40% of noble mate-rials can be scrapped).
• Significant reduction in the weight of the final part.
• The making of composite parts with very short tact time (about 1 minute),
• The avoidance of costly reworking after forming (machining, assembly for example). Besides these many advantages, there are still some difficulties to overcome. Removing the pre-heated blank from the tool under the press without holding the material leaves the patches free to move in the mould during the forming step. Figure 1b shows the blank designed to be formed to obtain a curved hat-shaped framing component. A discontinuous woven prepreg placed on the right-hand side of the blank is initially aligned with the component axis. After forming to obtain the hat shape, this patch experienced a rotation as shown in Figure 1c. No in-plane shearing is observed because the forming of the component in this region consists of squeezing and folding the discontinuous prepreg. On the left-hand side of the tailored blank, a discontinuous unidirectional prepreg underwent a large transformation as seen in Figure 1a. Fibres are no longer straight and the ply dimensions are not controlled due to the large squeeze flow. Pure sliding of discontinuous prepregs are also observed in vertical zones as a consequence of the mould closing.
Figure 1 – a) UD prepreg deformation and sliding, b) flat multi-material blank before forming, c) woven prepreg rotation [44].
As thermoplastic composites become a more popular material for use in automotive ap-plications, quality part production without extensive experimental investigations into the processing regime is needed. Part quality is degraded by a variety of defects which develop during processing. The occurrence of resulting defects has to be studied and understood in order to take them into account in the design step of the composite part. Table1 reports the most frequent defects observed during the thermo-stamping of melted thermoplastic prepregs, including those processed with the Quilted Stratum Process (QSP®) presented by [44]. They are listed in decreasing levels of severity. These defects were also presented in [45].
Unlike plastic sheets, metal or Glass Mat Thermoplastics (GMT), the formability of regular composite prepregs does not depend on the plasticity of the prepreg material itself but on the draping characteristics of the prepreg and the off-plane relative displacement between laminated layers. It is difficult to decide whether a part can be formed without any defects. The problem to solve is the position of the prepreg during the forming pro-cess to prevent wrinkles or folds in the part. It is important to know in advance where issues during forming may occur and can be solved. The thermo-stamping of complex laminates made of discontinuous prepregs of finite dimensions raises new questions about their formability. The forming processes can lead to unacceptable defects like wrinkles, the sliding of patches and the bending of fibre induced by squeeze flow or inefficient fibre dis-tribution. By inefficient fibre distribution we mean fibres not oriented in the main loading directions in critical regions after forming. These defects depend on several parameters, like the geometry of the part, material properties, lay-up, process parameters and friction between prepregs and between the top and bottom prepregs and mould. The individ-ual discontinuous plies in the material can slide with respect to each other and deform individually. Patches are not maintained by a blankholder or any device used to apply in-plane tensile loadings to the plies to control their motion. In this case the interlaminar shear effects can play a significant role in the forming of multi-layered composite parts,
Defects Most frequent origin Mechanical influence on composites In-plane fibre waviness • Friction on tooling • Inter-ply friction • In-plane compression of prepregs
• Transverse squeeze flow
• Local stiffness weakening
• Reduction of tensile and compression strength
• Higher risk of local buckling
Off-plane fibre waviness
• Buckling of fibres in part radii • Ply washing due to high
injection pressure during overloading • Local stiffness weakening • Reduction of tensile and compression strength
• Higher risk of local buckling
Wrinkles
• High shearing in 3D shape • Lack of room in the mould
cavity
• Equivalent to a broken ply
Delamination • Inappropriate thermal management of the process
• Bending strength weakening Incomplete impregnation • Pre-existing defect in prepregs • Early transverse cracking
Porosities • Too much moisture inpolymer
• Weak effect due to the high toughness of thermoplastics
Residual stresses
• Thermal mismatch between fibre and matrix
• High chemical shrinkage of polymer
• Overloading conditions in some areas of the part
Table 1 – Most frequent defects observed in the thermo-stamping of thermoplastic viscous prepregs, including those obtained with the Quilted Stratum Process (QSP®).
quality parts without extensive experimental investigations is needed. Due to the com-plexity of the problem, the need for simulations is obvious. Numerical tools can simulate the production processes and provide to the subsequent FEA a material-scale description of the "as-manufactured" part. They can help the designer to optimize the product in the design phase and lead to a first-time-right production cycle. These optimizations require a robust, accurate and fast enough numerical procedure. They also need to create a direct link between the process simulation and the structural analysis. The state-of-the-art pro-cedure is to chain software packages so that the outcome of the process simulation can be interpreted as the income of the structural analysis. When forming a flat fabric composite laminate into a 3D shape, the original arrangement of the fibres is strongly modified. The product shape and the forming process kinematics affect the extent of the fibre reorienta-tion. The outcome of the first numerical tool is not only the new orientations of fibre but also potential defects created during the process. The outcome of the second computation is the assessment of whether a defect is acceptable or not, with regards to its consequence on the part strength.
Forming modelling and simulation
In continuous fibre reinforced polymer deformation is constrained by the array of continu-ous fibres. The inextensibility of very stiff fibres means that tensile deformations along the fibre axis are prevented. In a material where extension is prevented by the inextensible fibres, deformation must rely on shear mechanism, bending and transverse squeeze flow. Understanding how to form a complex shape part from inextensible material is a diffi-cult task and requires knowing which of those deformations processes are admissible. The main deformation mechanisms are bending, axial and transverse intraply shear, interply slip where the lubricant polymer will play a crucial rule, flow of polymer through and along the fibre bed when the polymer is squeezed out through the fibres and squeeze flow. While most deformations involve relatively small overall strains, some of them may be much more pronounced. That is the case when plies slide past each other in opposite directions, or move in the same direction but at different velocities. During the deformation into a 3D shape of a multilayered composite, interply slip must occur. If interply slip is hindered by lack of slippage between plies, out-of-plane buckling of one or more layers may happen, especially in the interior of the part. This viscous deformation, also called interply slip, is limited to the resin rich layer in between plies and in between the mould wall and the top and bottom layers. Such deformations are of the order of 10 mm or even more, especially in discontinuous layers which is the focus of this work. For most thermoplastic polymers with shear-thinning behaviour, it means that the non-Newtonian behaviour of the fluid can be revealed in the process. If the process time scale is long and the resin viscosity is low, then forming may cause polymer to be squeezed out or there may be excessive transverse flow. On the contrary, too high a viscosity and too short a time
laminates [48]. It is also observed that fibres can deform so that the initial rectangular sample becomes barrel-shaped [49]. These mechanisms cannot be taken into account in a pure kinematic approach. FE simulations are based on solving equilibrium for the complete structure. They can include complex material models and boundary conditions. Finite element forming simulations of multi-layer composites have become common in commercial FE packages now [50].
However forming simulations of multi-layer composites including lubrication, squeeze flow and large slippage phenomena is still in a research stage [51], [52]. Stacking several plies with contact laws between each layer is the most common method to model forming. The forming behaviour of multi-layered composites is often modelled by stacking multiple element layers through the thickness of the sheet and connecting them by friction laws. However, as previously mentioned, within the range of allowable deformations, there are some situations where the discontinuous viscous prepregs slide past each other. Modelling that mechanism requires a viscous model where the matrix plays an important role. Also suitable constitutive relations are required in this mechanical approach. They can be gen-erally classified under the assumption that the prepreg material is modelled either as a fluid or a solid. Originally, owing to some similarities between the thermoforming of ther-moplastic composites and metal sheet forming, a first approach is to view the composite sheet as a deformable anisotropic solid and to use the displacements as the primary vari-ables. This solid mechanics approach is based on the use of elasto-plastic models. When finite and permanent deformations occur, a visco-plastic model is preferred to describe the behaviour of the deforming material, supposing elastic effects can be neglected [53]. This second approach is usually referred to as the flow formulation for forming processes [54]. In this technique, the material is viewed as a viscous medium and the velocities are the primary variables. Since the behaviour of the discontinuous viscous laminate at its forming temperature involve large transformation and deformation, sliding over long distance and squeeze flow, the flow formulation along with a constitutive equation for viscous anisotropic medium seems appropriate. The kinematical constraints, anisotropic behaviour, sliding and finite deformations create special situations which must be taken into account in order to successfully investigate the formability of discontinuous viscous composite laminates and to optimize the processing parameters in the forming process.
To do so, Chapter 1 presents dedicated experiments on instrumented viscous laminates to measure large-deformation including changes in fibre orientation and inter-ply rotation. Experimental findings are used to build a multi-layer heterogeneous 3D model. Chapter 2 presents a 2D Transversely Isotropic Fluid (TIF) model, solved by FE and validated through various numerical test cases. Then a more realistic 3D model is proposed in chapter 3 and validated against experimental measurements. Chapter 4 discusses the advanced numerical simulation of the 3D problem with the aim of reducing the CPU and memory requirements.
Chapter
1
Experimental part
This Chapter focuses on the through-thickness compression of unidirectional, cross-ply and woven discontinuous viscous prepreg laminates. A series of experiments and characterisa-tion are presented to better understand the flow kinematics induced by the compaccharacterisa-tion tests. To do so, new experiments are designed to distinguish between solid rotation of a patch and in-plane bending of yarns within the patch. Patch size effects are also investi-gated.
Contents
1.1 Experimental setup . . . . 9
1.1.1 Kinematic tracers . . . 9
1.1.2 Unidirectional specimens . . . 10
1.1.3 Woven prepreg specimens . . . 10
1.2 Experimental observations on unidirectional prepregs . . . 12
1.2.1 Compression of a [0]6stack of Hexcel Hexply M21 prepreg . . . . 12 1.2.2 Compression of a [0/90]6 stack of Hexcel Hexply M21 prepreg . . 12 1.2.3 Compression of a [+30/-30]3 stack of Hexcel Hexply M21 prepreg 14 1.2.4 Copper threads kinematics . . . 15
1.3 Experimental observations on woven prepregs . . . 15
1.3.1 Compression of a [0/20/0] stack of Vizilon™ SU75G1 prepreg . . 15
1.3.2 Compression of a [0/80/0] stack of Vizilon™ SU75G1 prepreg . . 16
1.3.5.1 Compression of a left[0/20/0] stack of Vizilon™ SU63G1 prepreg . . . 23
1.3.5.2 Compression of a [0/45/0] stack of Vizilon™ SU63G1 prepreg . . . 24
1.3.5.3 Compression of a [0/20/0] stack of Vizilon™ SB63G1 prepreg . . . 26
1.3.5.4 Compression of a [0/45/0] stack of Vizilon™ SB63G1 prepreg . . . 27
1.1 Experimental setup
1.1.1 Kinematic tracers
A 80x80 mm2 grid of thin copper threads of 0.1mm in diameter was added at some inter-faces between plies to probe the interface flow. One array of parallel threads aligned with adjacent plies is inserted at the interface. To form a grid, a second array of parallel threads can be placed at another interface between adjacent plies aligned in the second stacking direction. The two arrays of tracers are not inserted at the same interface as they would significantly increase the interface thickness and possibly interact with each other, leading to inaccurate results. A visual description of the configuration is presented in Figure1.1.
Figure 1.1 – Configuration of the copper threads.
The dimension of the tracers is higher than the average thickness of the resin interface, however it does not have an impact on the flow as their reaction force due to their stiffness is very low compared to the drag forces due to the viscosity of the matrix. Futhermore they will be convected by the resin in the same fashion as the fibres are, considering that the flow is induced by the through-thickness compression. While their exact position in the thickness cannot be controlled, they will penetrate the sheet of fibres with which they are aligned. They therefore remain an interesting solution to inspect the configuration of the fibres.
1.1.2 Unidirectional specimens
The material used in the experiments is a unidirectional carbon fibre-reinforced epoxy prepreg (Hexply M21/35.5M%/268/T700GC from Hexcel) of 56.9% nominal fibre volume fraction. As it is a material of industrial grade, the given properties are subjected to statistical variations. The experiments are conducted on uncured thermoset unidirection-nal prepregs because the principal desired characteristic being the material to be a linear viscous fluid. As a monomer is very likely to stay in its linear domain regardless of the rate of shear, this assumption is considered reasonable. Futhermore, considering that the charge added in the material is of small dimension compared to the ply, the resin rich layer can be considered an homogenized fluid which viscosity is the one provided by the manufacturer. Individual plies have a nominal cured thickness of 0.262 mm. 150x150 mm2 samples with 3 stacking sequences (UD, cross-ply and angle-ply) were considered. The ply edges are left unconstrained which allows them to expand and rotate freely. Specimens were squeezed in the thickness direction with a slow monotonic loading applied by a press in the range of 250kN to 400kN. The final thickness of the specimen is controlled through the use of spacers, limiting the reduction of the thickness. Compaction experiments are run on uncured unidirectional prepregs.
The application of a compaction force produces a pressure gradient within the material that induces transverse flow. This transverse flow allows fibres to spread sideways under normal compressive load. Because the fibres are inextensible, the sample ply cannot ex-pand along their axis but resin can be squeezed out in that direction if the resin viscosity is low enough. The viscosity evolves with the temperature and the degree of cure, but as the thermo-stamping is a fast process there is no evolution of these properties. In order to perform experiments at a constant viscosity, preliminary tests are carried out to determine the range of temperatures and time scales where the degree of cure does not evolve and the viscosity is high enough to generate pure squeeze flow without resin bleeding in the fibre direction. The results of these tests are a maximum temperature of 80◦C and a maximum processing time of 30 minutes at that temperature. Higher temperatures are close to the transition from squeezing to bleeding flow as observed in [55]. During the actual tests the time limit is never reached as thermo-stamping is a very fast process, lasting only a few seconds.
1.1.3 Woven prepreg specimens
The materials used are the Dupont™ Vizilon™ SU75G1, the Dupont™ Vizilon™ SB75G1, the Dupont™ Vizilon™ SU63G1 and the Dupont™ Vizilon™ SB63G1. The SU75G1 and the SU63G1 are 4-1 biased plain weave glass fabrics (they have 80% of fibres in the warp direction and 20% of fibres in the weft direction) reinforced polyamide 66-6 prepreg ma-terial with a fibre mass fraction of respectively 75% and 63%. Based on the respective fibre content in the warp and the weft directions, these materials are intermediate between the woven and the unidirectional prepregs. The SB75G1 and the SB63G1 are balanced twill weave glass fabrics with otherwise the same characteristic as the Dupont™ Vizilon™ SU75G1 and SU63G1. Material properties are presented in Table 1.1.
The test specimen are made by stacking three plies of preconsolidated prepreg of size 150x150 mm2 with three stacking sequences (0◦ ply, angle ply, 0◦ ply) where 20◦ , 45◦ and 80◦ angles were considered. The plies are cut accordingly to their respective angle 0◦, 20◦, 45◦ or 80◦. The copper tracers grid can be seen in Figure1.2a. The final thickness of the specimen including the grid is 5mm. The ply edges are left unconstrained to let the fibres expand and rotate/bend. An example of the final specimen is shown in Figure 1.2b.
Vizilon™ SU75G1 SU63G1 SB75G1 SB63G1 Fabric 4/1 biased plain weave 2-2 twill weave
Warp / weft ratio (%) 80 / 20 50 / 50
Thickness (mm) 1.6
Fibre mass fraction (%) 75 63 75 63
Fibre volumic fraction (%) 57 43 57 43
Density (g.cm−3) 1.98 1.78 1.98 1.78
Melting temperature (◦C) 260
Table 1.1 – Properties of the Vizilon™ prepreg sheets.
(a) Laying of copper threads along the fibre direction. (b) Specimen before compression Figure 1.2 – Illustration of the test specimen made with the Vizilon™ prepreg sheets.
A compaction force of 100 kN was applied on the specimen where the mould plates are pre-heated to 260◦C. The square specimen is placed inside the press with spacers of thickness 4.9 mm to control the thickness of the compressed specimen. It is maintained at the melting temperature for 5 min and finally cooled down gradually.
1.2 Experimental observations on unidirectional prepregs
1.2.1 Compression of a [0]6 stack of Hexcel Hexply M21 prepreg
Figure 1.3 – CT-scan of the [0]6 stack of Hexcel Hexply M21 prepreg, 400 kN compressive load. Red arrows represent the initial fibre orientation vector. (a) Before squeeze flow. Initial thickness: 1.85 mm. Initial grid space: 10 mm. (b) After squeeze flow. Final thickness: 1.30 mm.
Figure1.3shows the initial and final geometry of the grid for the [0]6stack. Initial fibre orientation is represented by the red arrow. The array of tracers orthogonal to the fibre direction was in the mid-plane, the parallel one on both sides of the fourth ply, counted from the bottom side of the stack. 60x60 mm2 scans are taken in the center of the sample. The high transverse squeeze flow perpendicular to the fibres induced the breakage of copper threads aligned in that direction as can be seen in the blue circle, while the parallel ones remain intact (Figure1.3b). This provides the evidence that a reaction stress develops in fibres to prevent the flow along their direction. The vertical tracers experienced in-plane bending, as can be seen in the green rectangle, that is more pronounced close to the lateral edges resulting from the squeeze flow kinematics.
1.2.2 Compression of a [0/90]6 stack of Hexcel Hexply M21 prepreg
Figure 1.4presents the initial and final geometry of the grid placed in the mid-plane of a [0/90]6 cross-ply stack. Initial fibre orientations are represented by the red arrows. The horizontal array of tracers was inserted between the fourth and the fifth plies, the second array oriented in the vertical direction was inserted between the eight and the ninth plies. As revealed by these images, the orthogonality of the grid is kept as shown by the blue wedges, but unlike the UD stack, all tracers underwent some bending as can be seen in the green rectangle. The bending and spreading of the composite layers are clearly visible on the composite layers as indicated in Figure 1.5. The grid dilated of 15% on average as highlighted by the yellow double-headed arrows in Figure 1.4, which proves there is actually a viscous flow between the plies. While orthogonally oriented plies impede flow
Figure 1.4 – CT-scan of the [0/90]6 stack of Hexcel Hexply M21 prepreg, 400kN com-pressive loading. Average expansion of the grid of 15%. (a) Before squeeze flow. Initial thickness: 3.15 mm. Initial grid space: 10 mm. (b) After squeeze flow. Final thickness: 2.38 mm.
in each direction within composite plies, they do not prevent the flow at their interface. This important observation is consistent with the existence of pure viscous resin layers in prepregs, as mentioned in Section . Even for prepregs with high fibre volume fraction, there is flow at ply interfaces.
Figure 1.5 – Photograph of the [0/90]6 sample after compression.
1.2.3 Compression of a [+30/-30]3 stack of Hexcel Hexply M21 prepreg
Figure 1.6 shows results obtained for a stack of plies with [+30/ − 30]3 lay-up. The first array of tracers was in the mid-plane, the second one on both sides of the fourth ply, counted from the bottom side of the stack. The initial grid has a shape of a rhombus with a 60◦angle corresponding to the total inclination of adjacent plies. A marker crossing one copper thread, highlighted in the blue square, is added to the grid for a more accurate comparison between the undeformed and deformed grids. Measurements made on three repeats indicate that the thin copper threads rotated 8◦ to 10◦ towards [+45/ − 45] and kept their straightness in the center of the sample. This experimental finding confirms real composites observations reported in [48] for a composite substitute made of carbon fibre reinforced syrup. The grid dilated of 13% to 16% of its original spacing for the three repeats. The [0/45]3 stack of 1.7mm initial thickness, squeezed under 350kN up to 1.2mm in thickness exhibited the highest rotation, typically 14◦, for the same squeeze rate than the one applied to the [+30/ − 30]3 lay-up.
Figure 1.6 – CT-scan of the [+30/ − 30]3 stack of Hexcel Hexply M21 prepreg, 350kN compressive loading. Tracers in the mid-plane. Average expansion of the grid between 13% to 16% on 3 repeats. (a) Before squeeze flow. Initial thickness: 1.75 mm. Initial grid space: 10 mm. (b) After squeeze flow. Final thickness: 1.25 mm.
1.2.4 Copper threads kinematics
Figure 1.3 presents the CT-scans of the [0]6 stack before and after compression. The vertical threads barrel, as can be expected from a stack of UD under compression, whereas the horizontal threads break, confirming that the copper threads are mostly at the interface as no carbon fibers were broken during the compression test.
Figure 1.4 presents the CT-scans of the [0/90]6 stack before and after compression, and Figure1.5presents the photograph of the stack after compression. The Figures show that all threads barrel and spread in the same fashion as the fibers.
It can therefore be concluded that while the copper threads can be thicker than the interface layer they are mostly located in the inter-layer zone, and their kinematics are representative of the kinematics of the fibers.
1.3 Experimental observations on woven prepregs
1.3.1 Compression of a [0/20/0] stack of Vizilon™ SU75G1 prepreg
For the first compression tests the Dupont™ Vizilon™ SU75G1 prepreg is considered. A 150x150 mm2 stack of one 20◦ orientation ply in between two 0◦ plies was subjected to compression. Measured rotation values are presented in Table 1.2.
(a) Orientation of threads before compression. (b) Orientation of threads after compression. Figure 1.7 – CT-scan of the [0/20/0] stack of Vizilon™ SU75G1 prepreg. Label Before After Difference Label Before After Difference
A 19.9 18.1 -1.8 G 22.6 31.3 8.7 B 17.0 34.6 17.6 H 20.4 22.2 1.8 C 18.7 36.4 17.7 I 18.3 24.7 6.4 D 17.0 38.5 21.5 J 20.6 20.29 -0.31 E 25.9 27.4 1.5 K 20.8 24.6 3.8 F 15.4 17.9 2.5
Table 1.2 – Angles for the [0/20/0] stack of Vizilon™ SU75G1 prepreg.
1.3.2 Compression of a [0/80/0] stack of Vizilon™ SU75G1 prepreg
A 150x150 mm2 stack of one 80◦ orientation ply in between two 0◦ plies was subjected to compression. The Dupont™ Vizilon™ SU75G1 prepreg is also used here. Measured rotation values are presented in Table 1.3.
Label Before After Difference Label Before After Difference
A 80.3 77.9 -2.4 G 79.6 67.5 -12.1 B 78.2 76.0 -2.2 H 78.1 67.9 -10.2 C 80.6 76.5 -4.1 I 82.5 91.1 8.6 D 80.3 76.7 -3.6 J 78.6 81.2 2.6 E 79.7 76.3 -3.4 K 80.0 74.7 -5.3 F 79.0 94.4 15.4 L 79.2 79.6 0.4
Table 1.3 – Angles for the [0/80/0] stack of Vizilon™ SU75G1 prepreg.
The same phenomenon of fibres bending can be seen near the edges. As it can be seen from Table 1.3, there is closing of the fibres when subjected to compression.
The above CT-images in Figures 1.7ato 1.8band the measured angles show that the fibres have opened i.e. rotated in the anti-clockwise direction in the [0/20/0] stack, while in the [0/80/0] stack most of the fibres have closed. An average of 1.35◦ rotation in clockwise direction of fibres is observed. No intra-ply shear was observed.
(a) Orientation of threads before compression. (b) Orientation of threads after compression. Figure 1.8 – CT-scan of the [0/80/0] stack of Vizilon™ SU75G1 prepreg.
1.3.3 Influence of the specimen size
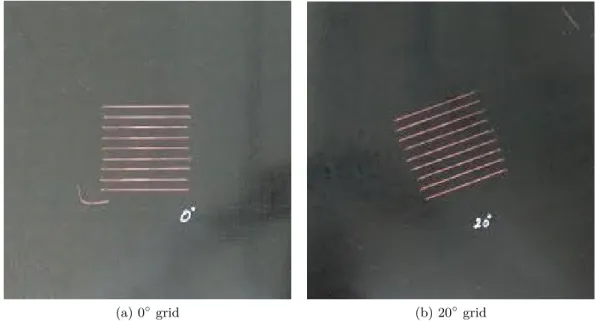
In the previous experiments specimens of size 150x150 mm2 are examined for the assess-ment of fibre rotation under compaction of 100kN with no edges being constrained. Due to the fibre rotation in the edges as a result of transverse polymer flow, the fibre orientation is disturbed to some extent. Assuming that the size effect has an influence on the rotation of the fibres, further examination was conducted on larger specimens of size 300x300 mm2. In order to observe the influence of the size the same Dupont™ Vizilon™ SU75G1 prepreg was considered. A stack of one 20◦ orientation ply in between two 0◦ plies was subjected to compression. The same test procedure as explained in Section1.1.3is followed. Figure 1.9shows the grids installed between the prepreg plies.
(a) 0◦grid (b) 20◦grid
Figure 1.9 – Illustration of the different grid lay ups to study the influence of the specimen size.
1.3.3.1 Compression of a [0/20/0] stack of Vizilon™ SU75G1 prepreg
An assembly of 20◦orientation ply in between two 0◦plies of the prepreg Vizilon™ SU75G1 was compressed under a pressure of 0.5 MPa at the melting temperature. Measured rotation values are presented in Table 1.4. The angles measured here are the obtuse angles at the points labelled in Figure 1.10.
(a) Before compression. (b) After compression. Figure 1.10 – CT-scan of [0/20/0] stack of Vizilon™ SU75G1 prepreg.
Label Initial Final A 159 152.3 B 159.6 153.7 C 159.7 156.6 D 159.7 157.5 E 159 154.6
Table 1.4 – Initial and after compression at 0.5 MPa angles for the [0/20/0] stack of Vizilon™ SU75G1 prepreg.
It can be seen in Table 1.4 that the fibres have rotated and that there is an overall 4.46◦ rotation of fibres on average. However at point C in the center of the grid and the composite, a minimum rotation of 3.1◦ is observed. A slight bending at the edges of the grid confirms that the polymer flows towards the sample edges when subjected to compression.
Figure1.10b reveals that there is no bending of the copper tracers in the grid directed towards the edges of the sample, which means that the rotation of the fibres is influenced by the size of the specimen.
1.3.4 Influence of the structure
The Dupont™ Vizilon™ SU75G1 and SB75G1 prepregs are considered in order to in-vestigate the fibre rotation in both unbalanced and balanced woven prepregs. A first compression on a [0/45/0] stack will be conducted on the Dupont™- Vizilon™ SU75G1 prepreg to complete the data for the comparison, then on a [0/20/0] and a [0/45/0] stacks on the Dupont™ Vizilon™ SB75G1 prepreg. The same test procedure as explained in Section1.1.3is followed.
Figure 1.11 presents the 45◦ used and a picture of the final specimen before compres-sion.
The overall fibre content and resin content is the same for both prepregs, they differ by the way the two constituents are distributed. This experiment with the above two prepeg materials will also helps us to investigate the influence of the polymer/fibre distribution on the fibre rotation.
1.3.4.1 Compression of a [0/45/0] stack of Vizilon™ SU75G1 prepreg
An assembly of 45◦ply in between two 0◦ plies of the Vizilon™ SU75G1 was compressed at a pressure of 0.5 MPa at the melting temperature. Measured rotation values are presented in Table1.5.
(a) Before compression. (b) After compression. Figure 1.12 – CT-scan of [0/45/0] stack of Vizilon™ SU75G1 prepreg.
Label Initial Final
A 43.6 48
B 43.4 47.2
C 43.2 47.7
D 43.4 47.5
E 43.5 50.7
Table 1.5 – Initial and after compression at 0.5 MPa angles for the [0/45/0] stack of Vizilon™ SU75G1 prepreg.
It can be seen from Table 1.5 and Figure 1.12 that the fibres have rotated, and that there is an overall 4.8◦rotation of fibres on average. It can be seen that the copper threads remained comparatively straight as of the initial orientation.
1.3.4.2 Compression of a [0/20/0] stack of Vizilon™ SB75G1 prepreg
An assembly of 20◦ oriented ply in between two 0◦ plies of the Vizilon™ SB75G1 was compressed at a pressure of 0.5 MPa at the melting temperature. Measured rotation values are presented in Table 1.6. The angles measured here are the obtuse angles at the points labelled in Figure 1.13.
(a) Before compression. (b) After compression. Figure 1.13 – CT-scan of [0/20/0] stack of Vizilon™ SB75G1 prepreg.
Label Initial Final
A 160 159.7
B 160.2 159.3 C 160.7 160.4
D 160.5 160
E 160.6 160
Table 1.6 – Initial and after compression at 0.5 MPa angles for the [0/20/0] stack of Vizilon™ SB75G1 prepreg.
It can be seen from Table 1.6 that there is almost no rotation of the fibres, which indicates that the balanced/unbalanced nature of the prepreg has an influence on the solid body rotation.
1.3.4.3 Compression of a [0/45/0] stack of Vizilon™ SB75G1 prepreg
An assembly of 45◦ oriented ply in between two 0◦ plies of the Vizilon™ SB75G1 was compressed at a pressure of 0.5 MPa at the melting temperature. Measured rotation values are presented in Table 1.7.
(a) Before compression. (b) After compression. Figure 1.14 – CT-scan of [0/45/0] stack of Vizilon™ SB75G1 prepreg.
Label Initial Final
A 45 45.3
B 45 45.8
C 45 45.2
D 45.4 46.5
E 45 45.4
Table 1.7 – Initial and after compression at 0.5 MPa angles for the [0/45/0] stack of Vizilon™ SB75G1 prepreg.
It can be seen from Table1.7that there is almost no rotation of fibres.
It can be seen that the rotation of the fibres in the balanced prepregs (Figures 1.13b and 1.14b) is much lower than in the unbalanced prepregs (Figures 1.10b and 1.12b). Average rotations are recalled in Table 1.8. It is believed that the asymmetric flow of polymer in the unbalanced prepreg is the origin of this solid body rotation.
Stack Average rotation [◦] Vizilon™ SU75G1 - [0/20/0] 7.21
Vizilon™ SU75G1 - [0/45/0] 4.8 Vizilon™ SB75G1 - [0/20/0] 0.52 Vizilon™ SB75G1 - [0/45/0] 0.56
Table 1.8 – Average rotation of the Vizilon™ SU75G1 and SB75G1 prepregs for different stacking sequences.
1.3.5 Influence of the fibre fraction
In the previous experiments specimens with a fibre mass fraction of 75% were considered. As the lubricative layer plays a very important role in the kinematics of a stack of prepreg plies during compression, experiments on specimens with a different viscosity were consid-ered. One way to achieve different viscosity is to consider prepregs with a different fibre mass fraction. Compression tests were therefore conducted on a [0/20/0] and a [0/45/0] stacks of Vizilon™ SU63G1 and SB63G1 prepregs. The size of the specimens is 150x150 mm2.
1.3.5.1 Compression of a left[0/20/0] stack of Vizilon™ SU63G1 prepreg
An assembly of 20◦oriented ply in between two 0◦plies of Vizilon™ SU63G1 was subjected to compression at a pressure of 0.5, 1 and 1.5 MPa at the melting temperature. Measured rotation values are presented in Table1.9. The angles measured here are the obtuse angles at the points labelled in Figure1.15.
Angle [◦]
Label Initial 0.5 MPa 1 MPa 1.5 MPa
A 156.7 151.8 150.4
-B 156.6 146.9 143.5
-C 156.4 143.9 133.7
-D 156.7 147.6 137.1
-E 156.5 151 147.1
-Table 1.9 – Initial and after compression angles for the [0/20/0] stack of Vizilon™ SU63G1 prepreg.
It can be seen from Table 1.9 that the fibres have rotated and there is an overall 8.34◦ rotation of fibres on average in the anti-clockwise direction. However in the center of the ply (point C) a maximum of rotation of 12.5◦ is observed as the resin fraction in this case is high, and as the resin flow influences the fibre orientation in the fabric. Slight displacement of the fibres can be noticed under a compression of 0.5 MPa (Figure 1.15b) as the fibres are washed away by the resin flow when subjected to compression. Under 1 and 1.5 MPa compression (respectively Figures1.15cand1.15d) it can be noticed that the displacement of the fibres is dominent compared to the rotation of the fibres due to the resin flow, thus confirming the resin flow towards the edges of the sample. The orientation of fibres under 1.5 MPa compression is not measured as the orientation of the fibres is more influenced by the displacement of the fibres due to the flow induced by the pressure rather than the rotation of the plies. Section 3.2.1.4 will present the compression of a single UD ply with thickness variation of the interfacial resin layer, which generates a directional flow. The large displacements seen in Figure 1.15d can probably be explained by such a flow as the woven prepreg will present a thickness variation due to its structure.
1.3.5.2 Compression of a [0/45/0] stack of Vizilon™ SU63G1 prepreg
An assembly of 45◦oriented ply in between two 0◦plies of Vizilon™ SU63G1 was subjected to compression at a pressure of 0.5, 1 and 1.5 MPa at the melting temperature. Measured rotation values are presented in Table 1.10. CT-scans are presented in Figure1.16.
Angle [◦]
Label Initial 0.5 MPa 1 MPa 1.5 MPa
A 45.8 50.2 53.6 57.4
B 45 42 47 49
C 45 47 51.7 58.9
D 45 51 58.8 68.4
E 45 51.2 59.3 68.3
Table 1.10 – Initial and after compression angles for the [0/45/0] stack of Vizilon™ SU63G1 prepreg.
It can be seen from Table1.10that most of the fibres have rotated and that there is an overall 4.32◦ rotation of fibres on average in the anti-clockwise direction, although in a few areas fibres have rotated in the clockwise direction. This phenomenon is more present at the edges of the sample where the bending of the fibres is more important due to the resin
(a) Before compression (b) After 0.5 MPa compression
(c) After 1 MPa compression (d) After 1.5 MPa compression Figure 1.16 – CT-scan of [0/45/0] stack of Vizilon™ SU63G1 prepreg.
flow towards the edges. Under 1 and 1.5 MPa compression (respectively Figures 1.16c and1.16d) displacement of the copper tracers can be noticed due to more important drag forces. Displacement of the fibres are observed clearly under 1.5 MPa compression (Figure 1.16d).
1.3.5.3 Compression of a [0/20/0] stack of Vizilon™ SB63G1 prepreg
An assembly of 20◦ oriented ply in between two 0◦plies of Vizilon™ SB63G1 was subjected to compression at a pressure of 0.5, 1 and 1.5 MPa at the melting temperature. Measured rotation values are presented in Table 1.11. The angles measured here are the obtuse angles at the points labelled in Figure 1.17.
(a) Before compression (b) After 0.5 MPa compression
(c) After 1 MPa compression (d) After 1.5 MPa compression Figure 1.17 – CT-scan of [0/20/0] stack of Vizilon™ SB63G1 prepreg.
It can be seen from Table 1.11 that the fibres have rotated and there is a overall rotation of 4.56◦ on average in the clockwise direction under a 0.5 MPa compression. The bending of the fibres due to the flow of resin towards the edges of the sample under 0.5 MPa compression can be seen in Figure 1.17b. It can be noticed in Figure1.17c that the fibres have been displaced particularly at the edges of the sample. Wrinkles of the copper tracers can be seen due to crimp of the woven fabric. The orientation of fibres under 1.5 MPa compression (Figure 1.17d) is not measured due to the state of the specimen after compression.
Angle [◦]
Label Initial 0.5 MPa 1 MPa 1.5 MPa
A 160 151.7 157.8
-B 160 156.2 160.5
-C 158.6 156.6 160.8
-D 159.5 155.5 161.7
-E 158.4 153.7 157.5
-Table 1.11 – Initial and after compression angles for the [0/20/0] stack of Vizilon™ SB63G1 prepreg.
1.3.5.4 Compression of a [0/45/0] stack of Vizilon™ SB63G1 prepreg
An assembly of 45◦oriented ply in between two 0◦plies of Vizilon™ SB63G1 was subjected to compression at a pressure of 0.5, 1 and 1.5 MPa at the melting temperature. Measured rotation values are presented in Table1.12.CT-scans are presented in Figure 1.18.
Angle [◦]
Label Initial 0.5 MPa 1 MPa 1.5 MPa
A 45 44.1 49.9 48.1
B 45 41.8 37.6 39.6
C 45 41.5 45.7 44.7
D 45 47.9 49.9 49.1
E 45 41.2 41.2 42.3
Table 1.12 – Initial and after compression angles for the [0/45/0] stack of Vizilon™ SB63G1 prepreg.
It can be noticed from Table 1.12 that the fibres have rotated and that there is an overall 2.86◦ rotation of fibres on average in the clock-wise direction. Figures1.18b,1.18c and1.18dshows the displacement of the fibres, which affected the orientation of the fibres due to the resin flow towards the edges of the sample when subjected to compression.
Displacement of the fibres can be seen in Figures 1.15, 1.16, 1.17 and 1.18, which is more important than in a prepreg with higher fibre fraction, as considered in previous experiments. This illustrates that the resin content plays a vital role in maintaining the orientation of the fibres.
(a) Before compression (b) After 0.5 MPa compression
(c) After 1 MPa compression (d) After 1.5 MPa compression Figure 1.18 – CT-scan of [0/45/0] stack of Vizilon™ SB63G1 prepreg.
1.3.6 Conclusion
In this chapter experiments were carried out of UD and woven prepregs. The phenomenon were observed with the use of copper wires that acted as kinematic tracers in the CT scanner.
The following important conclusions are drawn from the experimental campaign on the unidirectional prepregs:
• There is always a pure resin layer between the plies in prepreg laminates. • A reaction stress develops in fibres to prevent the flow along their direction. • There is a complex flow at the plies interface.
• The kinematics of the copper tracers differs from the kinematics of the plies, although the tracers are a good indicator of the movement of the plies.
• The observed phenomena that the unidirectional model should be able to retrieve are:
– Squeeze flow kinematics perpendicular to the fibre direction. – Inextensibility in the fibre direction.
– No bleeding of resin.
– Rotation and in-plane bending of the plies.
The following important conclusions are drawn from the experimental campaign on the woven prepregs:
• Initial orientation has an influence on the amplitude and the direction of the solid body rotation induced by the flow towards the edges of the sample under compres-sion.
• Specimen size has an influence as larger plies will be subjected to greater viscous forces.
• Structure of the woven fabric has an influence, probably due to the asymmetric flow of polymer in the unbalanced prepreg being the origin of the solid body rotation. • Fibre fraction has an influence as the excess resin content is responsible for higher

![Figure 1.4 – CT-scan of the [0/90] 6 stack of Hexcel Hexply M21 prepreg, 400kN com- com-pressive loading](https://thumb-eu.123doks.com/thumbv2/123doknet/7902404.264616/28.893.151.787.172.496/figure-scan-stack-hexcel-hexply-prepreg-pressive-loading.webp)
![Figure 1.6 – CT-scan of the [+30/ − 30] 3 stack of Hexcel Hexply M21 prepreg, 350kN compressive loading](https://thumb-eu.123doks.com/thumbv2/123doknet/7902404.264616/30.893.154.789.169.493/figure-scan-stack-hexcel-hexply-prepreg-compressive-loading.webp)
![Figure 1.7 – CT-scan of the [0/20/0] stack of Vizilon™ SU75G1 prepreg.](https://thumb-eu.123doks.com/thumbv2/123doknet/7902404.264616/31.893.128.725.189.481/figure-ct-scan-stack-vizilon-su-g-prepreg.webp)
![Figure 1.8 – CT-scan of the [0/80/0] stack of Vizilon™ SU75G1 prepreg.](https://thumb-eu.123doks.com/thumbv2/123doknet/7902404.264616/32.893.171.772.190.481/figure-ct-scan-stack-vizilon-su-g-prepreg.webp)