HAL Id: hal-01579434
https://hal.archives-ouvertes.fr/hal-01579434
Submitted on 31 Aug 2017
HAL is a multi-disciplinary open access
archive for the deposit and dissemination of
sci-entific research documents, whether they are
pub-lished or not. The documents may come from
teaching and research institutions in France or
abroad, or from public or private research centers.
L’archive ouverte pluridisciplinaire HAL, est
destinée au dépôt et à la diffusion de documents
scientifiques de niveau recherche, publiés ou non,
émanant des établissements d’enseignement et de
recherche français ou étrangers, des laboratoires
publics ou privés.
Hydrogen mapping in an aluminum alloy using an
alternating current scanning electrochemical microscope
(AC-SECM)
Manon Chloé Lafouresse, Marie-Laëtitia De Bonfils - Lahovary, Lydia
Laffont-Dantras, Christine Blanc
To cite this version:
Manon Chloé Lafouresse, Marie-Laëtitia De Bonfils - Lahovary, Lydia Laffont-Dantras, Christine
Blanc. Hydrogen mapping in an aluminum alloy using an alternating current scanning
electrochem-ical microscope (AC-SECM). Electrochemistry Communications, Elsevier, 2017, vol. 80, pp. 29-32.
�10.1016/j.elecom.2017.05.007�. �hal-01579434�
O
pen
A
rchive
T
OULOUSE
A
rchive
O
uverte (
OATAO
)
OATAO is an open access repository that collects the work of Toulouse researchers and
makes it freely available over the web where possible.
This is an author-deposited version published in :
http://oatao.univ-toulouse.fr/
Eprints ID : 18116
To link to this article : DOI: 10.1016/j.elecom.2017.05.007
URL : http://dx.doi.org/10.1016/j.elecom.2017.05.007
To cite this version : Lafouresse, Manon Chloé and Bonfils -
Lahovary, Marie-Laëtitia de and Laffont-Dantras, Lydia and Blanc,
Christine Hydrogen mapping in an aluminum alloy using an
alternating current scanning electrochemical microscope
(AC-SECM). (2017) Electrochemistry Communications, vol. 80. pp.
29-32. ISSN 1388-2481
Any correspondence concerning this service should be sent to the repository
administrator: [email protected]
Hydrogen mapping in an aluminum alloy using an alternating current
scanning electrochemical microscope (AC-SECM)
Manon Chloé Lafouresse, Marie-Laetitia de Bonfils-Lahovary, Lydia Laffont, Christine Blanc
⁎CIRIMAT, Université de Toulouse, CNRS, INPT, UPS, ENSIACET, 4 allée Emile Monso, BP44362, 31030 Toulouse cedex 4, France
A B S T R A C T
Measurements using an alternating current scanning electrochemical microscope (AC-SECM) were performed on a 2024 aluminum alloy pre-charged with hydrogen. A gradient in AC current magnitude was observed over several hundreds of microns on the side perpendicular to the charging side. After heat treatment at 130 °C for 2 h, the current gradient disappeared. Comparison with scanning Kelvin probe force microscopy (SKPFM) measurements confirmed that the increase in AC current magnitude observed with AC-SECM was due to the presence of hydrogen in the material. Fitting of localized impedance spectra with a suitable equivalent circuit showed the influence of H on the corrosion rate. AC-SECM is thus a powerful new method to detect hydrogen and study its effect on corrosion at the micrometer scale.
1. Introduction
Hydrogen embrittlement is suspected to play a role in the mechan-ical degradation of various materials[1]. Hydrogen can be inserted into the lattice (interstitial hydrogen) or at microstructural defects (e.g. grain boundaries or vacancies) or precipitates. H localization at a micrometer scale is thus necessary for a better understanding of the role of hydrogen in degradation mechanisms.
The scanning Kelvin probe (SKP)[2–4]and scanning Kelvin probe force microscopy (SKPFM)[5,6]have been used to detect hydrogen in a range of materials and alloys. Scanning electrochemical microscopy (SECM) has recently been reported as a new technique to detect hydrogen in steel [7]. In this paper, Schaller et al. monitored the oxygen reduction reaction at the SECM probe over H-charged regions and over regions with no hydrogen present. A decrease in the reduction current observed over line scans was associated with the presence of hydrogen. Although a 10 μm probe was used, the spatial resolution was several hundreds of microns.
Another technique with higher lateral resolution which has been used in the field of corrosion science [8,9] is alternating current scanning electrochemical microscopy (AC-SECM). No redox mediator or polarization of the substrate is necessary with this in situ method, allowing freely corroding materials to be studied. The AC-SECM response depends on the probe-to-sample distance and the ionic strength of the electrolyte as well as on the conductivity of the sample surface[10]. This technique can therefore provide information about electrochemical phenomena taking place at the sample/electrolyte
interface.
Here AC-SECM was used for the first time to detect hydrogen in H-charged 2024 aluminum alloy (AA 2024) samples at a micrometer scale. Intermittent contact (IC) mode was used in order to separate the effect of the topography from that of the hydrogen on the current measured by the AC-SECM probe[11]. The results are compared with measurements taken on the same type of H-charged samples using SKPFM. Desorption measurements with AC-SECM are also presented. Localized impedance spectra were also performed in zones with and without H in an attempt to model the role of H in the corrosion processes of AA 2024.
2. Materials and methods
The material used was an AA 2024-T351 rolled plate with the following chemical composition (in wt%): 4.46% Cu, 1.44% Mg, 0.60% Mn and 0.13% Fe[12]. Full details of the charging procedure can be found elsewhere[13,14]. Briefly, hydrogen was inserted into the AA 2024 by electrochemical charging at 25 °C in 10 mM H2SO4 (≥95%
Sigma Aldrich). A Pt counter electrode and a saturated calomel reference electrode (SCE) were used. A charging potential, E, of −0.8 V vs SCE was applied for 15 h or 48 h to ensure that a detectable amount of hydrogen was introduced into the material with a homo-geneous distribution of H in a plane parallel to the charging side
[13,14]. The solution was stirred with a magnetic stirrer during cathodic charging. Charging was done through one of the long transverse (LT)–short transverse (ST) sides. All the other sides were
⁎Corresponding author.
E-mail address:[email protected](C. Blanc).
protected with silicone elastomer paste.
The SKPFM measurements were performed using a 5500 Agilent AFM. Both topography and surface potential signals were acquired simultaneously (single-pass mode). The probes were conductive Pt-coated silicon tips. In the single-pass mode set-up, the tip is vibrated above the surface at two different frequencies: a frequency close to the resonant frequency of the tip (300 kHz) by mechanical excitation in order to control the tip–sample distance and a lower frequency (10 kHz) by electrical excitation to measure the surface potential [15]. The SKPFM measurements were performed on one of the ST-Rolling Direction (RD) sides after polishing it down to 0.25 μm with diamond paste. All SKPFM measurements were performed in air at room temperature. More details of the SKPFM measurement procedure are available elsewhere[13,14].
A BioLogic AC-SECM workstation (M 470) was used with the intermittent contact mode option selected. AC-SECM measurements were performed in a low conductivity electrolyte (1 mM Na2SO4). A
perturbation frequency between 5 and 8 kHz was used for the AC voltage applied to the probe. The amplitude of the perturbation was ± 100 mV in order to have a sufficiently large signal-to-noise ratio. The DC part of the applied voltage was kept at the open-circuit potential Ecorr. A 10 μm diameter Pt micro-electrode embedded in glass
was used as the probe with a RG ratio of ~10 (BioLogic). The spatial resolution of this set-up was a few tens of microns. The Pt electro-de–sample distance was ~4 μm. The roughness of the sample was much smaller (~10 nm), ensuring that local asperities did not affect the AC-SECM measurements. All the sample sides, except the one to be analyzed, were covered with varnish to avoid contribution of the other sides to the current measurement. To rule out possible artifacts, measurements both starting from and ending at the charging side were recorded. During H charging, an oxide film probably formed on the charging side but, as the AC-SECM measurements were performed on the side perpendicular to the charging side, the influence of the oxide on the AC-SECM measurements was minimal.
Heat treatments for hydrogen desorption were performed in a Carbolite furnace.
3. Results and discussion 3.1. Hydrogen insertion
Fig. 1(a) represents the AC current magnitude map of an AA 2024 sample H-charged for 48 h. Close to the charging side (x = 0), the AC current magnitude, |iac|, is about 28 nA, with its value decreasing as
the distance from the charging side, x, increases. It reaches a plateau
value of about 15 nA from x ~ 400 μm. InFig. 1(b), the normalized current |inorm| profiles averaged over the y direction are plotted as a
function of x for the 48 h H-charged sample and a non-charged sample. For normalization, the AC current magnitudes recorded by the probe |iac| were divided by the magnitude of the current far away from the
charging side, |i∞|. For a non-charged AA 2024 sample, |inorm| stays
constant over several hundred of microns. For the charged sample, there is a current increase, reaching a maximum in the zone closest to the charging side which is 1.8 times the value seen in the zone further away. These results suggest that the |inorm| gradient observed on the
charged sample is linked with the presence of hydrogen in the alloy. To confirm this, the current gradient obtained by AC-SECM was compared with the potential gradient observed using SKPFM for a sample of AA 2024 charged with hydrogen for 48 h. InFig. 1(b), ΔV, the plotted potential, is the difference between the potential in the uncharged part of the sample, V∞, and the potential Vxmeasured at a
distance x. The potential gradient was observed at a similar distance as for the current gradient, i.e. ~400 μm. The potential gradient observed in SKPFM for H-charged AA 2024 samples was confirmed to be due to hydrogen in an independent gas fusion analysis [13], and also in secondary ion mass spectroscopy (SIMS) measurements by Larignon et al.[16]. The good agreement between the distances over which the current and potential gradients are observed confirmed that the observed |iac| increase for small x is due to the presence of hydrogen.
Hydrogen could therefore be detected at a micrometer scale with AC-SECM.
3.2. Hydrogen desorption
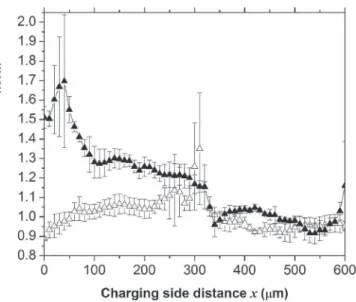
AC-SECM was also used to study the desorption of hydrogen from a pre-charged AA 2024 sample. An AA 2024 sample was pre-charged for 15 h at −0.8 V in 10 mM H2SO4. The normalized current, |inorm|, of
the charged sample is displayed inFig. 2. A current gradient over a slightly smaller distance (330 μm) than in Fig. 1(b) is observed, as expected. Moreover, |inorm| near the surface increases by a factor of
~1.5, reflecting the shorter charging period. After a 2 h heat treatment at 130 °C, the gradient in |inorm| disappears. Note that the peaks in
|inorm| at x ~ 50 μm before heat treatment and at x ~ 300 μm after heat
treatment are associated with the presence of intermetallic compounds. Similar changes in the potential gradient were observed using SKPFM after heat treatment [13,14]. This result confirms that the current gradient observed before the heat treatment is due to the presence of H in the material. As discussed in our previous papers [13,14], only interstitial hydrogen is expected to desorb at 130 °C[17]. Therefore only diffusible hydrogen was detected on the pre-charged sample by
Fig. 1.(a) 2D current scan for an AA 2024 sample H-charged for 48 h in 10 mM H2SO4. The AC-SECM measurement was done in 1 mM Na2SO4, with a voltage of Ecorr± 100 mV and a
perturbation frequency of 8 kHz applied to the probe. (b) Normalized AC current magnitudes averaged over the y direction as a function of the distance x from the H-charging side for uncharged (□) and 48 h H-charged (■) AA 2024 samples. For comparison the SKPFM potential difference ∆V = V∞− Vxfor the 48 h H-charged AA 2024 samples is also shown (●).
AC-SECM.
3.3. Frequency scans
To better understand the role of H in the AC-SECM response, frequency scans from 100 kHz to 500 Hz were performed both in zones containing H and in H-free zones on an AA 2024 sample which had been hydrogen charged for 15 h. Measurements were repeated several times in different locations and a typical response is presented inFig. 3. A clear difference between the two zones is observed. The impedance spectra were fitted with the equivalent circuit (EC) shown in the inset of
Fig. 3. L represents an inductance element to take into account the effects of the potentiostat at high frequencies. The rest of the EC is equivalent to the one used by Schuhmann et al. [18,19]. The part associated with the probe/electrolyte interface is represented by a double-layer capacitance, C′dl, probe, in parallel with an adsorption
resistance, Rad, probe, and an adsorption capacitance, Cad, probe, to reflect
possible adsorption of SO42 − anions on the probe surface [18]. No
obvious trend was observed for the elements associated with the probe/
electrolyte interface when going from a H-rich zone to a H-free zone. The part of the EC associated with the interface sample/electrolyte is represented by a double-layer capacitor, Cdl, sample and an effective
resistance, Reff, sample.Reff, sample is a combination of the electrolyte
resistance, Relectrolyte, and the local charge transfer resistance, Rct, sample,
which are connected in parallel and whose contribution cannot be separated[18]. The result of the fitting (seeFig. 3) indicated that Cdl, samplewas equal to 4.4 pF for the H zone and 6.1 pF for the H-free zone.
These relatively small values of Cdl, sample ensure that it is indeed
Reff,samplethat dominates the AC-SECM current response at frequencies
of 5 or 8 kHz, as used inFigs. 1(a), (b) and2. Reff,samplewas equal to
0.93 MΩ in the H zone and 1.34 MΩ in the H-free zone i.e. Reff,sampleis
about 1.4 times smaller in the presence of hydrogen. This value is consistent with the increase by a factor of 1.5 found for |inorm| in the
H-charged zone (Fig. 2). A lower Reff,samplevalue could be due to a lower
charge transfer resistance in the presence of H and/or to a lower Relectrolytedue to a higher quantity of corrosion products in the solution
above the H-charged zone. Either way, fitting to an equivalent circuit demonstrated that H increases the corrosion rate of AA 2024 in 1 mM Na2SO4. Further, the result clearly shows the utility of AC-SECM
measurements compared to optical microscope (OM) observations and even SKPFM measurements. OM observations (not shown here) showed the reactivity of the intermetallics in both the H zone and the H-free zone but did not make it possible to visualize the enhanced reactivity of the alloy in the H zone. Further, both AC-SECM and SKPFM allow H to be localized but only AC-SECM enables the influence of H on the reactivity of the material to be demonstrated.
4. Conclusions
AC-SECM was used for the first time to detect hydrogen absorbed in a metallic alloy. By comparing the AC-SECM current profiles with SKPFM potential profiles of H-charged AA 2024 samples, it was confirmed that the higher AC current measured by the probe close to the charging side was due to the presence of hydrogen in the material. Both hydrogen insertion and hydrogen desorption could be detected by AC-SECM. Moreover, comparison and fitting of full frequency spectra taken in the H zones and the H-free zones showed that the increased current magnitude measured in the H zones was due to a smaller Reff, sample, reflecting an enhanced corrosion rate in the presence of H. These
results show that AC-SECM is a very powerful technique for the better understanding of H embrittlement mechanisms.
Acknowledgements
The authors wish to thank Nicolas Murer and Nicolas Portail from Biologic for help with the AC-SECM measurements. This work was supported by ANR-14-CE07-0027-01 – M-SCOT: Multi Scale COrrosion Testing.
References
[1] M. Dadfarnia, P. Novak, D.C. Ahn, J.B. Liu, P. Sofronis, D.D. Johnson,
I.M. Robertson, Recent advances in the study of structural materials compatibility with hydrogen, Adv. Mater. 22 (2010) 1128–1135.
[2] R.F. Schaller, J.R. Scully, Spatial determination of diffusible hydrogen concentra-tions proximate to pits in a Fe-Cr-Ni-Mo steel using the Scanning Kelvin Probe, Electrochem. Commun. 63 (2016) 5–9.
[3] C. Senöz, S. Evers, M. Stratmann, M. Rohwerder, Scanning Kelvin probe as a highly sensitive tool for detecting hydrogen permeation with high local resolution, Electrochem. Commun. 13 (2011) 1542–1545.
[4] S. Evers, M. Rohwerder, The hydrogen electrode in the “dry”: a Kelvin probe approach to measuring hydrogen in metals, Electrochem. Commun. 24 (2012) 85–88.
[5] G. Wang, Y. Yan, X. Yang, J. Li, L. Qiao, Investigation of hydrogen evolution and enrichment by scanning Kelvin probe force microscopy, Electrochem. Commun. 35 (2013) 100–103.
[6] M. Koyama, A. Bashir, M. Rohwerder, S.V. Merzlikin, E. Akiyama, K. Tsuzaki, D. Raabe, Spatially and kinetically resolved mapping of hydrogen in a twinning-induced plasticity steel by use of scanning Kelvin probe force microscopy, J.
Fig. 2.Evolution of the AC-SECM normalized currents after charging for 15 h as a function of the distance x from the H-charging side (▲) and after an additional heat treatment for 2 h at 130 °C (Δ).
Fig. 3.Typical localized impedance spectra obtained in the H-containing zone (■) and in the H-free zone (□) for a 15 h H-charged AA 2024 sample. Measurements were performed in 1 mM Na2SO4. Frequency range: 100 kHz–500 Hz. The solid lines show the fitting to
Electrochem. Soc. 162 (12) (2015) C638–C647.
[7] R.F. Schaller, S. Thomas, N. Birbilis, J.R. Scully, Spatially resolved mapping of the relative concentration of dissolved hydrogen using the scanning electrochemical microscope, Electrochem. Commun. 51 (2015) 54–58.
[8] A. Schulte, S. Belger, M. Etienne, W. Schuhmann, Imaging localised corrosion of NiTi shape memory alloys by means of alternating current scanning electrochemical microscopy (AC-SECM), Mater. Sci. Eng. A 378 (2004) 523–526.
[9] B.B. Katemann, C.G. Inchauspe, P.A. Castro, A. Schulte, E.J. Calvo, W. Schuhmann, Precursor sites for localised corrosion on lacquered tinplates visualised by means of alternating current scanning electrochemical microscopy, Electrochim. Acta 48 (9) (2003) 1115–1121.
[10] K. Eckhard, W. Schuhmann, Alternating current techniques in scanning electro-chemical microscopy (AC-SECM), Analyst 133 (2008) 1486–1497.
[11] K.M. Kelvey, M.A. Edwards, P.R. Unwin, Intermittent Contact −Scanning Electrochemical Microscopy (IC−SECM): a new approach for tip positioning and simultaneous imaging of interfacial topography and activity, Anal. Chem. 82 (2010) 6334–6337.
[12] C. Larignon, J. Alexis, E. Andrieu, C. Blanc, G. Odemer, J.-C. Salabura, Corrosion damages induced by cyclic exposure of 2024 aluminum alloy in chloride-containing environments: corrosion, passivation, and anodic films, J. Electrochem. Soc. 158 (9) (2011) C284–C295.
[13]M.C. Lafouresse, M.-L. de Bonfils-Lahovary, C. Charvillat, L. Oger, L. Laffont, C. Blanc, A Kelvin probe force microscopy study of hydrogen insertion and desorption into 2024 aluminum alloy, J. Alloys Compd. (2017).
[14]M.C. Lafouresse, M.-L. de Bonfils-Lahovary, C. Charvillat, L. Laffont, C. Blanc, Role of hydrogen in intergranular corrosion of 2024 aluminum alloy: An SKPFM study, Conference Proceedings NACE, NACE Int., RIP, 2017, pp. 2017–9464.
[15]M. Nonnenmacher, M.P. O'Boyle, H.K. Wickramasinghe, Kelvin probe force microscopy, Appl. Phys. Lett. 58 (1991) 2921–2923.
[16]C. Larignon, J. Alexis, E. Andrieu, L. Lacroix, G. Odemer, C. Blanc, Investigation of Kelvin probe force microscopy efficiency for the detection of hydrogen ingress by cathodic charging in an aluminium alloy, Scr. Mater. 68 (2013) 479–482. [17]E. Charitidou, G. Papapolymerou, G.N. Haidemenopoulos, N. Hasiotis,
V. Bontozoglou, Characterization of trapped hydrogen in exfoliation corroded aluminium alloy 2024, Scr. Mater. 41 (12) (1999) 1327–1332.
[18]A.S. Bandarenka, A. Maljusch, V. Kuznetsov, K. Eckhard, W. Schuhmann, Localized impedance measurements for electrochemical surface science, J. Phys. Chem. C 118 (2014) 8952–8959.
[19]V. Kuznetsov, A. Maljusch, R.M. Souto, A.S. Bandarenka, W. Schuhmann, Characterisation of localized corrosion processes using scanning electrochemical impedance microscopy, Electrochem. Commun. 44 (2014) 38–41.