S Y M P O S I U M : C L I N I C A L L Y R E L E V A N T S T R A T E G I E S F O R T R E A T I N G C A R T I L A G E A N D M E N I S C A L P A T H O L O G Y
Stereologic Analysis of Tibial-Plateau Cartilage and Femoral
Cancellous Bone in Guinea Pigs With Spontaneous Osteoarthritis
Susanne X. Wang MD, PhD, Larry Arsenault PhD,Ernst B. Hunziker MD, PhD
Published online: 23 April 2011
Ó The Association of Bone and Joint Surgeons1 2011
Abstract
Background Two strains of guinea pig develop sponta-neous osteoarthritis of the knee. Although the disease evolves at different rates in the two strains, it is not known whether these differences are reflected in the structure of the cartilage and cancellous bone.
Questions/purposes We determined whether the three-dimensional structure of the tibial-plateau cartilage and femoral cancellous bone differed between the two strains. Methods Six Dunkin-Hartley and six GOHI/SPF guinea pigs were evaluated. The animals were sacrificed at 11 months of age. The 24 proximal tibias were used for a stereologic histomorphometric analysis of the tibial-plateau cartilage. The 24 femurs were used for a site-specific, three-dimensional quantitative analysis of the cancellous bone by micro-CT.
Results Compared to the GOHI/SPF guinea pigs, the tibial-plateau cartilage of the Dunkin-Hartley strain had a
larger lesion volume (3.8% versus 1.5%) and a thicker uncalcified cartilage layer (0.042 versus 0.035 mm), but a thinner calcified cartilage zone (0.008 versus 0.01 mm) and a thinner subchondral cortical bone plate (0.035 versus 0.039 mm). The femoral cancellous bone in the Dunkin-Hartley strain had a lower bone mineral density (477 versus 509 mg/cm3). However, the trabeculae were thicker (3.91 versus 3.53 pixels) and farther apart (7.8 versus 5.6 pixels). The osteoarthritic changes in the cartilage were topo-graphically mirrored in the subchondral bone. They were most severe on the medial side of the joint, particularly in the anterior region.
Conclusions Spontaneous osteoarthritis in the guinea pig is associated with site-specific changes in the articular cartilage layer, which are topographically mirrored in the underlying subchondral bone.
Clinical Relevance Three-dimensional structural infor-mation not revealed by two-dimensional radiography may help characterize the stages of osteoarthritis.
Introduction
Osteoarthritis (OA) is a progressive disorder of the syno-vial joints. Morphologically, it is characterized by destruction of the articular cartilage layer, sclerosis of the subchondral bone, the formation of cysts, and an accu-mulation of osteophytes along the joint margins. Two main types are recognized: primary (idiopathic) and secondary (induced by traumatic or pathologic agencies). Despite the prevalence of the disease in Western countries, little is known of its etiology and pathogenesis. In humans, the progression of OA is particularly difficult to follow in the early stages, owing to the slowness and subtlety of the degenerative process. By the time the disease is
Each author certifies that he or she has no commercial associations (eg, consultancies, stock ownership, equity interest, patent/licensing arrangements, etc) that might pose a conflict of interest in connection with the submitted article.
Each author certifies that his or her institution approved the animal protocol for this investigation and that all investigations were conducted in conformity with ethical principles of research. This study was performed at the University of Bern, Bern, Switzerland.
S. X. Wang, E. B. Hunziker (&)
Center of Regenerative Medicine for Skeletal Tissues, Department of Clinical Research, University of Bern, CH-3010 Bern, Switzerland
e-mail: ernst.hunziker@dkf.unibe.ch L. Arsenault
Department of Pathology and Molecular Medicine, McMaster University, Hamilton, ON, Canada DOI 10.1007/s11999-011-1899-6
symptomatic and radiographically evident as a narrowing of the joint space, it is already well advanced.
OA is a complex disease in that most, if not all, of the interdependent joint structures are implicated: the failure of one element triggers compensatory responses in the others. The increased stress thereby imposed on the other com-ponents of the joint complex usually triggers a process of tissue remodeling, which, by altering the loading dynamics of the joint, exacerbates rather than alleviates the disease symptoms [18, 21]. Furthermore, the pain and restricted ROM associated with OA necessitate changes in the pat-tern of loading by the affected individual, which further complicate the development of the disease.
Microscopically, the articular cartilage layer and the subchondral bone bear the most severe brunt of the disease. The articular cartilage layer is comprised principally of collagen and proteoglycans, the interrelationship between which is crucial for the biomechanical competence of the tissue as a whole. Changes in either the quality or quantity of one or the other of these components will influence the synthetic activity of the chondrocytes, and the remodeling process thereby set in train will impose a strain on the neighboring structures, especially on the underlying bone, which will then itself undergo compensatory remodeling. Remodeling of the bone will in turn impose a secondary strain on the articular cartilage layer, and so the vicious circle of events continues. Bone, which has an intrinsically higher capacity for healing than cartilage, does not neces-sarily respond in a manner that benefits the entire joint [14,
24]. In response to the higher stress levels, remodeling of osseous tissue leads initially to a decrease in its degree of mineralization and an increase in its mass. Later, the level of mineralization increases. These changes have a direct biomechanical impact on the overlying cartilage layer, decreasing its stiffness and thereby compromising its ability to absorb mechanical shocks. The increase in the vascularity of the subchondral bone, which is another consequence of its remodeling, will influence all tissues of the joint and may play a role in the formation of osteophytes [13,29].
The interrelationship between the layer of calcified cartilage and the subchondral bone is believed to play an important role in the pathogenesis of OA. However, available evidence for this tenet stems mainly from two-dimensional (2D) radiographs rather than three-dimensional (3D) imaging. Finely detailed 3D imaging is not possible in humans. However, OA-like diseases occur naturally in many animals, such as monkeys, horses, pigs, dogs, and guinea pigs [1,8,26]. The Dunkin-Hartley (DH) strain of guinea pig is a particularly well-recognized experimental model of primary (spontaneous) OA. It is genetically prone to obesity, and this predisposition is correlated with the development of OA [2]. The osteoar-thritic changes are radiographically, histologically, and
biochemically similar to those manifested in human patients suffering from the disease [1,19]. The GOHI/SPF strain of guinea pig likewise develops spontaneous OA, albeit at a slower rate than the DH strain, which accounts for it being seldom used and less well known as a model for the disease. Unlike DH guinea pigs, the GOHI/SPF strain is not genetically prone to obesity. While the rates of pro-gression of OA in these two strains differ, it is unclear whether these differences are reflected in the structure of the cartilage and cancellous bone.
We therefore determined whether the 3D structure of the tibial-plateau cartilage and femoral cancellous bone dif-fered between the two strains.
Materials and Methods
Six 6-month-old male GOHI/SPF guinea pigs (400–500 g) were purchased from RCC Ltd (Itingen, Switzerland) and six 6-month-old DH guinea pigs (750–800 g) from Charles River Laboratories (Sulzfeld, Germany). The animals were housed singly, had free access to food and water, and were exposed to a 12-hour-light/12-hour-dark cycle. They were sacrificed at 11 months of age by an intracardial injection of T-61 euthanasia solution (0.3 mL/kg of body weight: Schering-Plough, Quebec, Canada). At the time of sacri-fice, the mean weights of the GOHI/SPF and DH animals were 785 g and 1020 g, respectively.
The 24 hindlimbs were amputated, and the bones were freed of soft tissues. The proximal tibias (bearing the medial and lateral menisci), which were destined for his-tomorphometry, were chemically fixed for 2 to 4 days at ambient temperature in a solution containing 2.5% glutar-aldehyde (Merck and Co, Inc, Whitehouse Station, NJ) and 2.5% formaldehyde, which was buffered with 0.1 mol/L sodium cacodylate (pH 7.4) (Merck). They were then dehydrated in ethanol and embedded in methylmethacry-late. Using a diamond band saw (Exact Medical Instruments, Oklahoma City, OK), and with a random start at the left-hand margin of the specimen, five 200-lm-thick coronal sections, 1.2 mm apart, were prepared from each tibia. The sections were glued to Plexiglas1 holders, ground to a thickness of approximately 100 to 150 lm with a PolycutTM E microtome (Reichert-Jung, Heidelberg, Germany), polished, and surface-stained with McNeal’s tetrachrome, toluidine blue O, and basic fuchsin in prepa-ration for examination in a Vanox AH-2 light microscope (Olympus, Tokyo, Japan). The 24 distal femurs destined for micro-CT were chemically fixed in 10% formaldehyde at ambient temperature. They were not further processed.
Five coronal sections through each tibia were photo-graphed in a Vanox AH-2 light microscope at a final magnification of 9170 (Fig.1). In accordance with
Cavalieri’s principle [12], the total volume of tibial-plateau cartilage was determined stereologically from the photomi-crographs using the point-counting technique [11, 12]. Cartilage tissue was deemed to have undergone degeneration if proteoglycans had been lost from the extracellular matrix (no reactivity after staining with toluidine blue) or if less than 50% of the chondrocytes was viable (as gauged by their structural integrity). Damage to the cartilage surface was considered to have occurred if its structural continuity had been interrupted in any way, such as by fibrillations or by more yawning apertures. The volume of damaged cartilage tissue was likewise determined using the point-counting technique and Cavalieri’s principle. This volume was then expressed relative to the total volume of tibial-plateau cartilage.
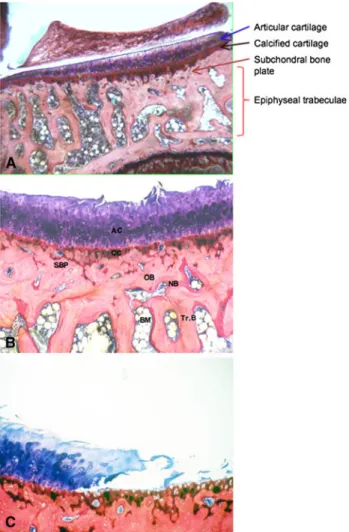
Light micrographs (9170) of the third (middle) section through the medial tibial plateau were used to measure the thicknesses of the articular cartilage layer, calcified carti-lage layer, and subchondral bone plate. Ten to 12 vertical lines, 20 lm apart, were drawn from the cartilage surface down to the lower end of the subchondral bone plate. The height of each layer was measured along these lines using a ruler [9]. The border between the hyaline cartilage layer and zone of calcified cartilage was defined by the position of the tidemark. The border between the calcified cartilage layer and subchondral bone plate was identified by the abrupt change in the staining properties of the two tissue types. The lower border of the subchondral bone plate was
demarcated by a bone marrow space (Fig.2). If a vertical test line coincided with a region in which the subchondral bone plate merged with the cancellous bone, no measure-ment was made. The measuremeasure-ments made along the 10 to 12 lines were averaged.
The 24 formalin-fixed femurs were imaged using a micro-CT scanner (Explore Locus SP micro-CT Scanner; GE Healthcare, Waukesha, WI). For each femur, 499 projections were produced using an isotropic voxel size of 16 lm. To avoid dehydration during scanning, each femur was immersed in a water-filled specimen tube; it was secured with its long axis parallel to the z-axis of the image coordination system to minimize beam-hardening effects [37]. After image acquisition, each scan was corrected for variations in temperature and xray attenuation.
Reconstructed images of the femoral epiphysis were divided into four rectangular prisms (1.5 9 1.5 9 0.5 mm): anterior medial, anterior lateral, posterior medial, and posterior lateral (Fig.3), which were analyzed with MicroView 2.0 software (GE Healthcare, London, ON, Canada). The following parameters were determined directly from the images [15]: total volume of tissue, total volume of trabecular bone, total surface area of trabecular bone, thickness of the trabecular bone layer, number of trabeculae, and volumetric bone mineral density. From these measurements, we calculated the trabecular separa-tion and connectivity, the volume fracsepara-tion of bone, and the
Fig. 1 Light micrographs of the five coronal sections through the medial and lateral tibial plateau (Stain, McNeal’s tetrachrome, toluidine blue O, and basic fuch-sin; original magnification, 92.5).
structure model index (SMI). The latter parameter quanti-fies the plate-like (SMI = 0) or rod-like (SMI = 3) characteristics of the cancellous bone [16].
A 3D isosurface image of each distal femur was obtained using the volume-rendering function (Fig.4). On volume-rendered 3D images, osteophytic tissue (newly formed bone of low density) was identified and the implicated zone marked in color on the corresponding 2D projection. The total volume of the osteophytic tissue was then calculated by relating the measured value to the known voxel volume.
Numerical data are expressed as means together with standard error of the mean. For the statistical analysis of
differences between two groups, means were compared using an independent-samples t-test. Some of the histologic data did not follow a normal distribution. Hence, all his-tologic data were subjected to a two-tailed Mann-Whitney U-test. For the statistical analysis of differences among the four bony sites (anterior medial, anterior lateral, posterior medial, and posterior lateral), means were compared using a one-way ANOVA and by applying a post-hoc test and Fisher’s least significance. The data were analyzed using
Fig. 2A–C (A) Low- and (B, C) high-magnification light micro-graphs of the medial tibial plateau in an 11-month-old guinea pig (DH strain) are shown (Stain, McNeal’s tetrachrome, toluidine blue O, and basic fuchsin; original magnification, 92.5 [A] and 96.3 [B, C]). (A) The borders between the articular cartilage layer and calcified cartilage zone, between the calcified cartilage zone and subchondral bone plate, and between the subchondral bone plate and a bone-marrow space are clearly demarcated. (B) Damage (fibrillation) of the articular cartilage layer is apparent. (C) A yawning, full-thickness lesion is manifested. AC = articular cartilage; CC = calcified carti-lage; SBP = subchondral bone plate; OB = old bone; NB = new bone; Tr.B = trabecular bone; BM = bone marrow.
Fig. 3 For the 3D analysis, reconstructed micro-CT images of the femoral condyle were divided into four rectangular prisms (1.5 9 1.5 9 0.5 mm): anterior medial, anterior lateral, posterior medial, and posterior lateral. The boxed area in the posterior medial region represents one of the areas analyzed with MicroView 2.0 software.
Fig. 4 An isosurface image of a distal femur shows the osteophytic tissue, which has been colored.
the SPSS1 14.0 for Windows1 statistical package (SPSS Inc, Chicago, IL).
Results
Macroscopic inspection of the surface of the tibial-plateau cartilage revealed various stages of roughness, fibrillation, and more overt damage. In extreme cases, the subchondral bone was exposed on both the tibial plateau and the fem-oral condyle. The pathologic changes were more severe in the former than in the latter region in both strains of guinea pig and were generally more profound in the DH than in the GOHI/SPF animals.
At the histologic level, pathologic changes in the tibial-plateau cartilage included loss of cells and extracellular matrix, clustering of chondrocytes, surface fibrillation, and more overt damage (Fig.2). The degenerative changes were more severe at the center of the medial tibial plateau than laterally and were more profound in the DH than in the GOHI/SPF guinea pigs.
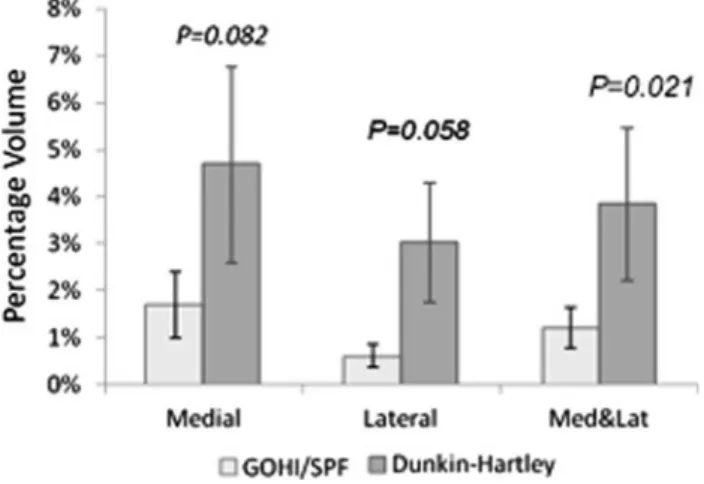
The small, shallow lesions were usually associated with a thickening of the cartilage layer. The cartilage layer was approximately 10% thicker and the size of the lesions (124.1 ± 59.9 lm2) was 1.5 to 3 times larger on the medial side than on the lateral side of the tibial plateau. The mean depth of the cartilage lesions on the medial side of the tibial plateau was greater in the DH than in the GOHI/SPF strain (47% ± 8.2% versus 22% ± 6.7%). The percentage vol-ume of damaged cartilage was larger on the medial side than on the lateral side of the tibial plateau in both the DH (4.7% ± 2.1% versus 3.0% ± 1.3%) and the GOHI/SPF guinea pigs (1.7% ± 0.6% versus 0.6% ± 0.2%). The total percentage volume of damaged cartilage on the tibial pla-teau was larger in the DH (3.8% ± 1.6%) than in the GOHI/SPF strain (1.2% ± 0.4%) (Fig.5).
The thicknesses of the articular cartilage layer and subchondral bone plate were similar in both strains. However, the layer of calcified cartilage was thinner in the DH than in the GOHI/SPF guinea pigs (68.8 ± 24.3 versus 100.5 ± 30.3 lm) (Fig.6).
The micro-CT analysis of the femoral cancellous bone in the 11-month-old guinea pigs revealed the volume of bone, the bone mineral density, the volume fraction of bone, and the surface area of bone to be lower in the DH than in the GOHI/SPF guinea pigs. However, the trabeculae were thicker and farther apart in the DH than in the GOHI/SPF strain. The increase in trabecular thickness observed in the DH strain was most pronounced in the posterior regions of both the lateral and medial femoral condyle. However, no such trend was revealed for the separation distance of the trabeculae (Table1). In the DH strain, signs of weakening of the 3D bony scaffold were most evident on the anterior
side of the medial femoral condyle. No obvious region-specific trend was apparent in the GOHI/SPF strain. The SMI was low in both the DH (0.567 ± 0.088) and the GOHI/SPF guinea pigs (0.726 ± 0.185), indicating that the cancellous bone was composed predominantly of plate-like (rather than rod-plate-like) units.
The microarchitecture of the four regions into which the femoral cancellous bone was divided was examined (Fig.7) and compared (Table2). In the DH strain, the most profound changes in the microarchitecture of the bony scaffold occurred in the anterior medial region of the femoral condyle (which bears the highest loads). The site corresponds to that in the tibial plateau where the largest articular cartilage lesions were observed. No site specificity was observed for any of the parameters in the GOHI/SPF strain.
Osteophytic tissue was observed most frequently at the interface between the layer of calcified cartilage and sub-chondral bone plate. In the DH strain, osteophytic tissue
Fig. 5 This graph depicts the percentage volume of damaged articular cartilage tissue on the tibial plateau in the two strains of guinea pig.
Fig. 6 This graph depicts the cartilage thickness at 11 months of age in the two strains of guinea pig.
was observed to a substantial degree in eight of the 12 joints. In the GOHI/SPF strain, it was observed in only two of the 12 joints. The volume of osteophytic tissue was generally larger in the DH than in the GOHI/SPF strain (Fig.8).
Discussion
For more than 20 years now, subchondral bone has been recognized to play an important role in the initiation and progression of OA [33]. From a physiologic and mechan-ical standpoint, it is clear that the structural characteristics of subchondral bone must influence the functionality of the joint complex as a whole. Clinically, remodeling of the subchondral bone is a landmark of advanced OA [5, 25,
31, 36]. However, due to past limitations in imaging technology, early data relating to changes in the subchon-dral bone were based primarily on the evidence of 2D radiographs. To date, no systematic investigation of the structural changes incurred by the subchondral bone has been undertaken at the 3D level. We therefore determined the 3D structure of the tibial-plateau cartilage and femoral cancellous bone in two strains of guinea pig that develop spontaneous OA at different rates.
Our study is subject to several limitations. First, our observations are based on measurements derived from only 12 joints/six animals in each of the two groups.
The variability of some of the measurements was high. Although such variability is not exceptional in studies of biologic systems, the relatively small sample size increases the risk of encountering Type-II errors, which lowers the chance of detecting differences between the two strains. Second, for animal models of spontaneous OA, we chose two strains of guinea pig that are genetically predisposed to develop the disease at different rates. Since two strains of the same animal species were utilized, some of our observations may be biologically species-specific and reflect the peculiar function of the joint in question. Third, while we describe some morphologic differences between the two strains, we cannot say whether the changes are primary or secondary.
At 11 months of age, the two strains of guinea pig did indeed manifest different stages of osteoarthritic devel-opment. As evidenced by the lesion volume within the articular cartilage layer, the disease was more advanced in the DH than in the GOHI/SPF strain (3.8% versus 1.5%). This finding is consistent with existing data [17,32]. The total thickness of the articular cartilage layer (uncalcified and calcified tissue) did not differ between the two strains. However, the layer of calcified cartilage did, being much thinner in the DH than in the GOHI/SPF strain (0.008 versus 0.01 mm); the layer of uncalcified cartilage was correspondingly thicker (0.042 versus 0.035 mm). With the onset of OA, it is conceivable that both the cartilagi-nous and osseous tissue respond to the elevated levels of
Table 1. Three-dimensional microarchitecture of the femoral spongiosa in the two stains of guinea pig
Parameter Strain Medial Lateral Average
Anterior Posterior Anterior Posterior
Volume of bone (mm3) GOHI/SPF 0.46 ± 0.02 0.50 ± 0.03 0.46 ± 0.03 0.44 ± 0.03 0.46 ± 0.02 DH 0.36 ± 0.02 0.45 ± 0.02 0.43 ± 0.02 0.44 ± 0.02 0.42 ± 0.01
p Value 0.005 0.228 0.498 0.845 0.042
Mineral density of bone (mg/cm3) GOHI/SPF 504 ± 13.6 541 ± 12.1 497 ± 21.6 494 ± 17.5 509 ± 9.7
DH 439 ± 24.9 501 ± 13.0 481 ± 16.3 487 ± 15.8 477 ± 12.5
p Value 0.033 0.033 0.566 0.761 0.055
Volume fraction of bone GOHI/SPF 0.47 ± 0.03 0.51 ± 0.03 0.46 ± 0.03 0.45 ± 0.02 0.47 ± 0.02 DH 0.37 ± 0.02 0.47 ± 0.02 0.44 ± 0.02 0.45 ± 0.02 0.43 ± 0.01
p Value 0.009 0.251 0.674 0.915 0.077
Surface area of bone (mm2) GOHI/SPF 6.88 ± 0.22 6.51 ± 0.19 6.78 ± 0.18 6.93 ± 0.13 6.77 ± 0.10 DH 5.19 ± 0.23 5.68 ± 0.13 5.95 ± 0.17 5.55 ± 0.13 5.59 ± 0.07
p Value 0.000 0.002 0.002 0.000 0.000
Thickness of trabeculae (pixels) GOHI/SPF 3.42 ± 0.24 3.97 ± 0.25 3.50 ± 0.28 3.22 ± 0.20 3.53 ± 0.16 DH 3.67 ± 0.23 4.07 ± 0.23 3.78 ± 0.29 4.11 ± 0.26 3.91 ± 0.09
p Value 0.470 0.774 0.494 0.013 0.048
Distance between trabeculae (pixels) GOHI/SPF 5.5 ± 0.4 5.2 ± 0.4 6.0 ± 0.6 5.7 ± 0.4 5.6 ± 0.3 DH 10.2 ± 1.1 6.7 ± 0.4 6.9 ± 0.4 7.4 ± 0.5 7.8 ± 0.3
p Value 0.000 0.024 0.197 0.012 0.000
mechanical stress by an increase in remodeling activity. In cartilage, such a response would be manifested as an increase in cell proliferation and matrix production, which would result in an overall increase in the thickness of the uncalcified cartilage layer. In contrast to remodeling within cartilaginous tissue, which depends on the activity
of a single cell type, that within bone depends on the cooperative activities of osteoblasts and osteoclasts. The initial response to elevated mechanical stress will be one of tissue resorption by osteoclasts, which will result in a thinning of the subchondral bone plate. Thinning of the subchondral bone did indeed occur to a greater extent in
Fig. 7A–F Site-specific box plots for the defined structural param-eters of the femoral cancellous bone in the two strains of guinea pig: (A) volume of bone, (B) mineral density of bone, (C) volume fraction of bone, (D) surface area of bone, (E) thickness of trabeculae, and (F) distance between trabeculae. Each box is divided by a horizontal line (the median) into an upper 75th percentile and a lower
25th percentile. The vertical bars (outside the boxes) embrace the ‘‘inner-fence’’ range of values (99%) for each parameter at each site (defined as 1.5 times the H-spread). AM = anterior medial; AL = anterior lateral; PL = posterior lateral; PM = posterior medial; DH = Dunkin-Hartley strain; GI = GOHI/SPF strain.
the DH than in the GOHI/SPF strain (0.035 versus 0.039 mm). This phenomenon has also been observed in other animal models of OA [17,28]. The reduction in the thickness of the calcified cartilage layer could be attrib-utable to a systematic process of demineralization in the activated joint [31], vascular invasion of the subchondral bone [18], or both phenomena. Changes in the mineral content and thickness of the calcified cartilage layer con-ceivably play a more prominent role in the pathogenesis of OA than has been hitherto supposed [6,30]. The process of demineralization associated with the rapid remodeling of osseous tissue results in a net reduction in bone stiffness and in support for the cartilage layer, which responds with an increase in matrix production [7, 34]. In human osteoarthritic patients, this response of the cartilaginous tissue results in the production of a poor-quality extra-cellular matrix [35]. Whether this phenomenon reflects the age of the cells per se in these elderly individuals or their tiring due to overexertion is unknown.
The micro-CT analysis revealed marked differences in the 3D structure and material properties of the subchondral bone between the two strains. These differences mirror those revealed by the stereologic histomorphometric anal-ysis of the cartilage layer. The femoral cancellous bone in the DH strain manifested a lower bone mineral density (477 versus 509 mg/cm3), a smaller volume fraction of bone (43% versus 47%), and a smaller surface area of bone (5.59 versus 6.77 mm2). These data confirm that bone mass losses due to remodeling occur during the early stages of OA. A decrease in bone mineral density has been observed during the early stages of OA in other animal models [17,28] and in patients with advanced forms of the disease [4,22,23,32].
While the theory of bone remodeling can account for the initial reduction in bone mass, it cannot explain why the bony trabeculae were thicker and more widely separated in the DH strain. We suspect that these traits are genetically determined. The wide separation of the trabeculae
Table 2. Site-specific comparison of the defined structural parameters of the femoral spongiosa in the two strains of guinea pig (Fig.7) Strain Parameter p Value
AL versus AM AM versus PL AM versus PM AL versus PL AL versus PM PL versus PM DH Volume of bone 0.014 0.005 0.001 0.721 0.296 0.490
Bone mineral density 0.089 0.052 0.013 0.798 0.404 0.562 Volume fraction of bone 0.014 0.006 0.001 0.742 0.387 0.591 Surface area of bone 0.001 0.090 0.024 0.070 0.219 0.551 Thickness of trabeculae 0.708 0.154 0.198 0.290 0.358 0.511 Distance between trabeculae 0.000 0.001 0.000 0.611 0.777 0.429 GOHI/SPF Volume of bone 0.781 0.606 0.281 0.811 0.177 0.113 Bone mineral density 0.720 0.637 0.076 0.910 0.034 0.026 Volume fraction of bone 0.703 0.510 0.296 0.781 0.156 0.091 Surface area of bone 0.687 0.824 0.133 0.532 0.268 0.085 Thickness of trabeculae 0.810 0.523 0.097 0.381 0.154 0.023 Distance between trabeculae 0.383 0.793 0.611 0.540 0.169 0.442 AM = anterior medial; AL = anterior lateral; PL = posterior lateral; PM = posterior medial; DH = Dunkin-Harley.
Fig. 8A–B Isosurface images of osteophytic tissue in the (A) GOHI/SPF and (B) DH guinea pigs. The volume of osteophytic tissue is larger in the DH (red circle) than in the GOHI/SPF strain.
compromises the robustness of the bony scaffold, which consequently furnishes insufficient support for the overly-ing cartilage. The latter responds with overcompensatory remodeling activity, thereby rendering the tissue more susceptible to osteoarthritic degeneration.
One other important finding of our study is the site specificity of the osteoarthritic changes. In general, tibial-plateau cartilage was thicker on the medial than on the lateral side. In the femoral cancellous bone, osteoarthritic changes in the DH strain were more pronounced on the medial side of the joint, particularly in the anterior region, which bears the highest loads [10]. These findings reveal the development of OA to be site-specific, presumably reflecting the influence of variations in loading dynamics between the different joint regions. Topographically, changes in the cartilaginous tissue were always mirrored by a corresponding change in the osseous tissue, thereby indicating the existence of a direct or indirect relationship between the remodeling mechanisms in the two compartments.
In aged guinea pigs, a substantial increase in ossification of the medial meniscus has been observed [20], which may reflect different loading patterns in the medial versus lateral compartments of the tibia and femur. This process of meniscal ossification would exacerbate the load imbalance within the joint and possibly trigger metabolic changes within the articular cartilage layer and subchondral bone. Increased loading of the articular cartilage layer is known to promote matrix degradation and chondrocyte death [27]. The alterations in load distribution elicited by osteotomy [38] or weight reduction [3] have a chondroprotective effect in animal models.
In conclusion, the development and progression of spontaneous OA are associated with site-specific changes in the articular cartilage layer, which are topographically mirrored in the underlying subchondral bone. In contrast to 2D radiography, stereologic histomorphometry and quan-titative micro-CT, which were used as analytical tools in our study, furnish 3D structural information that may be valuable in characterizing stages of the disease.
References
1. Anderson-MacKenzie JM, Quasnichka HL, Starr RL, Lewis EJ, Billingham ME, Bailey AJ. Fundamental subchondral bone changes in spontaneous knee osteoarthritis. Int J Biochem Cell Biol. 2005;37:224–236.
2. Bendele A, McComb J, Gould T, McAbee T, Sennello G, Chlipala E, Guy M. Animal models of arthritis: relevance to human disease. Toxicol Pathol. 1999;27:134–142.
3. Bendele AM, Hulman JF. Effects of body weight restriction on the development and progression of spontaneous osteoarthritis in guinea pigs. Arthritis Rheum. 1991;34:1180–1184.
4. Bettica P, Cline G, Hart DJ, Meyer J, Spector TD. Evidence for increased bone resorption in patients with progressive knee osteoarthritis: longitudinal results from the Chingford study. Arthritis Rheum. 2002;46:3178–3184.
5. Buckland-Wright C. Subchondral bone changes in hand and knee osteoarthritis detected by radiography. Osteoarthritis Cartilage. 2004;12(Suppl A):S10–S19.
6. Burr DB. Anatomy and physiology of the mineralized tissues: role in the pathogenesis of osteoarthrosis. Osteoarthritis Carti-lage. 2004;12(Suppl A):S20–S30.
7. Cake MA, Read RA, Guillou B, Ghosh P. Modification of articular cartilage and subchondral bone pathology in an ovine meniscectomy model of osteoarthritis by avocado and soya unsaponifiables (ASU). Osteoarthritis Cartilage. 2000;8:404–411. 8. Chateauvert JM, Grynpas MD, Kessler MJ, Pritzker KP. Spon-taneous osteoarthritis in rhesus macaques. II. Characterization of disease and morphometric studies. J Rheumatol. 1990;17:73–83. 9. Cruz-Orive LM, Hunziker EB. Stereology for anisotropic cells: application to growth cartilage. J Microsc. 1986;143(Pt 1):47–80. 10. de Bri E, Reinholt FP, Svensson O. Primary osteoarthrosis in guinea pigs: a stereological study. J Orthop Res. 1995;13:769– 776.
11. Gundersen HJ, Bagger P, Bendtsen TF, Evans SM, Korbo L, Marcussen N, Moller A, Nielsen K, Nyengaard JR, Pakkenberg B, et al. The new stereological tools: disector, fractionator, nucleator and point sampled intercepts and their use in patho-logical research and diagnosis. APMIS. 1988;96:857–881. 12. Gundersen HJ, Bendtsen TF, Korbo L, Marcussen N, Moller A,
Nielsen K, Nyengaard JR, Pakkenberg B, Sorensen FB, Vesterby A, et al. Some new, simple and efficient stereological methods and their use in pathological research and diagnosis. APMIS. 1988;96:379–394.
13. Hashimoto S, Creighton-Achermann L, Takahashi K, Amiel D, Coutts RD, Lotz M. Development and regulation of osteophyte formation during experimental osteoarthritis. Osteoarthritis Car-tilage. 2002;10:180–187.
14. Hayami T, Pickarski M, Wesolowski GA, McLane J, Bone A, Destefano J, Rodan GA, Duong le T. The role of subchondral bone remodeling in osteoarthritis: reduction of cartilage degen-eration and prevention of osteophyte formation by alendronate in the rat anterior cruciate ligament transection model. Arthritis Rheum. 2004;50:1193–1206.
15. Hildebrand T, Laib A, Muller R, Dequeker J, Ruegsegger P. Direct three-dimensional morphometric analysis of human can-cellous bone: microstructural data from spine, femur, iliac crest, and calcaneus. J Bone Miner Res. 1999;14:1167–1174. 16. Hildebrand T, Ruegsegger P. Quantification of bone
microar-chitecture with the structure model index. Comput Methods Biomech Biomed Engin. 1997;1:15–23.
17. Huebner JL, Hanes MA, Beekman B, TeKoppele JM, Kraus VB. A comparative analysis of bone and cartilage metabolism in two strains of guinea-pig with varying degrees of naturally occurring osteoarthritis. Osteoarthritis Cartilage. 2002;10:758–767. 18. Hwang J, Bae WC, Shieu W, Lewis CW, Bugbee WD, Sah RL.
Increased hydraulic conductance of human articular cartilage and subchondral bone plate with progression of osteoarthritis. Arthritis Rheum. 2008;58:3831–3842.
19. Jimenez PA, Glasson SS, Trubetskoy OV, Haimes HB. Sponta-neous osteoarthritis in Dunkin Hartley guinea pigs: histologic, radiologic, and biochemical changes. Lab Anim Sci. 1997;47: 598–601.
20. Kapadia RD, Badger AM, Levin JM, Swift B, Bhattacharyya A, Dodds RA, Coatney RW, Lark MW. Meniscal ossification in spontaneous osteoarthritis in the guinea-pig. Osteoarthritis Car-tilage. 2000;8:374–377.
21. Karsdal MA, Leeming DJ, Dam EB, Henriksen K, Alexandersen P, Pastoureau P, Altman RD, Christiansen C. Should subchondral bone turnover be targeted when treating osteoarthritis? Osteoar-thritis Cartilage. 2008;16:638–646.
22. Kart-Koseoglu H, Yucel AE, Niron EA, Koseoglu H, Isiklar I, Ozdemir FN. Osteoarthritis in hemodialysis patients: relation-ships with bone mineral density and other clinical and laboratory parameters. Rheumatol Int. 2005;25:270–275.
23. Karvonen RL, Miller PR, Nelson DA, Granda JL, Fernandez-Madrid F. Periarticular osteoporosis in osteoarthritis of the knee. J Rheumatol. 1998;25:2187–2194.
24. Lahm A, Kreuz PC, Oberst M, Haberstroh J, Uhl M, Maier D. Subchondral and trabecular bone remodeling in canine experimental osteoarthritis. Arch Orthop Trauma Surg. 2006;126:582–587. 25. Li B, Marshall D, Roe M, Aspden RM. The electron microscope
appearance of the subchondral bone plate in the human femoral head in osteoarthritis and osteoporosis. J Anat. 1999;195(Pt 1): 101–110.
26. Liu W, Burton-Wurster N, Glant TT, Tashman S, Sumner DR, Kamath RV, Lust G, Kimura JH, Cs-Szabo G. Spontaneous and experimental osteoarthritis in dog: similarities and differences in proteoglycan levels. J Orthop Res. 2003;21:730–737.
27. Loening AM, James IE, Levenston ME, Badger AM, Frank EH, Kurz B, Nuttall ME, Hung HH, Blake SM, Grodzinsky AJ, Lark MW. Injurious mechanical compression of bovine articular car-tilage induces chondrocyte apoptosis. Arch Biochem Biophys. 2000;381:205–212.
28. Muraoka T, Hagino H, Okano T, Enokida M, Teshima R. Role of subchondral bone in osteoarthritis development: a comparative study of two strains of guinea pigs with and without spontaneously occurring osteoarthritis. Arthritis Rheum. 2007;56:3366–3374. 29. Neuman P, Hulth A, Linden B, Johnell O, Dahlberg L. The role
of osteophytic growth in hip osteoarthritis. Int Orthop. 2003;27: 262–266.
30. Pan J, Zhou X, Li W, Novotny JE, Doty SB, Wang L. In situ measurement of transport between subchondral bone and articular cartilage. J Orthop Res. 2009;27:1347–1352.
31. Patel N, Buckland-Wright C. Advancement in the zone of cal-cified cartilage in osteoarthritic hands of patients detected by high definition macroradiography. Osteoarthritis Cartilage. 1999;7: 520–525.
32. Quasnichka HL, Anderson-MacKenzie JM, Bailey AJ. Sub-chondral bone and ligament changes precede cartilage degradation in guinea pig osteoarthritis. Biorheology. 2006;43: 389–397.
33. Radin EL, Rose RM. Role of subchondral bone in the initiation and progression of cartilage damage. Clin Orthop Relat Res. 1986;213:34–40.
34. Ratcliffe A, Shurety W, Caterson B. The quantitation of a native chondroitin sulfate epitope in synovial fluid lavages and articular cartilage from canine experimental osteoarthritis and disuse atrophy. Arthritis Rheum. 1993;36:543–551.
35. Sauren YM, Mieremet RH, Lafeber FP, Huber-Bruning O, Groot CG, Scherft JP. Changes in proteoglycans of ageing and osteoarthritic human articular cartilage: an electron micro-scopic study with polyethyleneimine. Anat Rec. 1994;240:208– 216.
36. Sowers M, Zobel D, Weissfeld L, Hawthorne VM, Carman W. Progression of osteoarthritis of the hand and metacarpal bone loss: a twenty-year followup of incident cases. Arthritis Rheum. 1991;34:36–42.
37. Wang SX, Cherian A, Dumitriu M, Grynpas MD, Carran J, Wainman D, Anastassiades T. Disease modifying effects of N-butyryl glucosamine in a streptococcal cell wall induced arthritis model in rats. J Rheumatol. 2007;34:712–720. 38. Wei L, de Bri E, Lundberg A, Svensson O. Mechanical load and
primary guinea pig osteoarthrosis. Acta Orthop Scand. 1998;69: 351–357.