ORIGINAL PAPER
Plasma and urine profiles of
Δ
9
-tetrahydrocannabinol
and its metabolites 11-hydroxy-
Δ
9
-tetrahydrocannabinol
and 11-nor-9-carboxy-
Δ
9
-tetrahydrocannabinol
after cannabis smoking by male volunteers to estimate recent
consumption by athletes
Rudolf Brenneisen&Pascale Meyer&Haithem Chtioui&
Martial Saugy&Matthias Kamber
Received: 16 September 2009 / Revised: 14 December 2009 / Accepted: 21 December 2009 / Published online: 30 January 2010
# Springer-Verlag 2010
Abstract Since 2004, cannabis has been prohibited by the World Anti-Doping Agency for all sports competitions. In the years since then, about half of all positive doping cases in Switzerland have been related to cannabis consumption. In doping urine analysis, the target analyte is 11-nor-9-carboxy-Δ9
-tetrahydrocannabinol (THC-COOH), the cutoff being 15 ng/mL. However, the wide urinary detection window of the long-term metabolite of Δ9
-tetrahydrocannabinol (THC) does not allow a conclu-sion to be drawn regarding the time of consumption or the impact on the physical performance. The purpose of the present study on light cannabis smokers was to evaluate target analytes with shorter urinary excretion times.
Twelve male volunteers smoked a cannabis cigarette standardized to 70 mg THC per cigarette. Plasma and urine were collected up to 8 h and 11 days, respectively. Total THC, 11-hydroxy-Δ9-tetrahydrocannabinol (THC-OH), and THC-COOH were determined after hydrolysis followed by solid-phase extraction and gas chromatography/ mass spectrometry. The limits of quantitation were 0.1– 1.0 ng/mL. Eight puffs delivered a mean THC dose of 45 mg. Plasma levels of total THC, OH, and THC-COOH were measured in the ranges 0.2–59.1, 0.1–3.9, and 0.4–16.4 ng/mL, respectively. Peak concentrations were observed at 5, 5–20, and 20–180 min. Urine levels were measured in the ranges 0.1–1.3, 0.1–14.4, and 0.5–38.2 ng/ mL, peaking at 2, 2, and 6–24 h, respectively. The times of the last detectable levels were 2–8, 6–96, and 48–120 h. Besides high to very high THC-COOH levels (245 ± 1,111 ng/mL), THC (3±8 ng/mL) and THC-OH (51± 246 ng/mL) were found in 65 and 98% of cannabis-positive athletes’ urine samples, respectively. In conclusion, in addition to THC-COOH, the pharmacologically active THC and THC-OH should be used as target analytes for doping urine analysis. In the case of light cannabis use, this may allow the estimation of more recent consumption, probably influencing performance during competitions. However, it is not possible to discriminate the intention of cannabis use, i.e., for recreational or doping purposes. Additionally, pharmacokinetic data of female volunteers are needed to interpret cannabis-positive doping cases of female athletes.
Keywords Cannabis doping . Clinical trial . Plasma and urine levels . Athletes’ samples
Electronic supplementary material The online version of this article (doi:10.1007/s00216-009-3431-3) contains supplementary material, which is available to authorized users.
R. Brenneisen (*)
:
P. MeyerDepartment of Clinical Research, University of Berne, Murtenstr. 35,
3010 Berne, Switzerland
e-mail: rudolf.brenneisen@dkf.unibe.ch H. Chtioui
Clinical Investigation Unit, University Hospital of Berne, 3010 Berne, Switzerland
M. Saugy
Swiss Laboratory for Doping Analyses, 1066 Epalinges, Switzerland
M. Kamber
Antidoping Switzerland,
P.O. Box 606, 3000 Berne 22, Switzerland DOI 10.1007/s00216-009-3431-3
Introduction
Before 2004, cannabis was only prohibited in competitions in some sports. Since January 2004, the World Anti-Doping Agency (WADA) has listed cannabis as a prohibited substance for all sports, however in competitions only [1]. Antidoping Switzerland, the organization responsible for antidoping measures in Switzerland, is bound to this list too [2]. In addition, cannabinoids are classified as so-called specified substances. Often athletes plausibly claim to have consumed cannabis several days or even weeks before a competition and only for recreational purposes not related to the competition. Other reported reasons for use are, for example, sleep improvement, stress reduction, and relaxa-tion [3,4]. Effects negatively influencing sport performance are reduced reaction time, problems of motor and hand–eye coordination, problems of perceptual accuracy, etc. [4]. Besides the ongoing increase of recreational cannabis use and the easy accessibility of highly potent material, it is also becoming increasingly popular to use cannabis products in a therapeutic context, for example, in the form of uncontrolled self-medication (cannabis tea, etc.) or as prescribed drug (dronabinol) to treat pain, muscle spasms, etc. This leads to an increased risk of positive doping urine tests.
Consumption of Δ9-tetrahydrocannabinol (THC)-con-taining cannabis products, such as marijuana (herbal cannabis) and hashish (resinous cannabis), is controlled in sports by testing urine samples. Urine concentrations of 15 ng/mL or more of 11-nor-9-carboxy-Δ9 -tetrahydrocan-nabinol (THC-COOH; the main THC metabolite, not psychoactive [5, 6]) are considered as“cannabis-positive.” This cutoff value of 15 ng/mL should avoid positive results due to passive inhalation. In general, a high number of adverse analytical findings for cannabis is reported by accredited laboratories [7]. Since 2004, about half of all positive doping cases in Switzerland have been related to cannabis consumption [8]. It is unsatisfactory if the authorities have to sanction athletes for cannabis use in a competition although the consumption took place days or even weeks before and was not intended to improve performance.
The high lipophilicity of THC, resulting in high tubular reabsorption [9], is responsible for the low renal excretion of the unchanged drug [9–11]. Body storage of THC increases with increasing frequency and chronicity of cannabis use [12]. Like its metabolites 11-hydroxy-Δ9 -tetrahydrocannabinol (THC-OH), which is psychoactive too [13–16], and THC-COOH it undergoes phase II biotrans-formation to a glucuronide conjugate [17]. About one third of the absorbed dose is excreted in the urine, about two thirds are eliminated via feces [18, 19]. Later it was suggested that urinary THC concentrations of more than 2 ng/mL following enzymatic hydrolysis indicate cannabis
exposure within 8 h of specimen collection [20]. However, sample collection lasted only for 8 h after controlled drug administration. Recently it has been shown that after a user has refrained from long-term heavy cannabis use, THC and THC-OH are excreted in urine for up to 24 days [12]. It was concluded that these cannabinoids are not suited as biomarkers of recent cannabis exposure.
After single and frequent consumption (daily) THC-COOH is detectable in urine for up to 3 and 30 days, respectively. This wide detection window is mainly due to multicompartment kinetics, multiphase distribution and elimination, and high affinity for lipid tissue [21–23]. For example, fatty acid conjugates of hydroxylated cannabi-noids have been identified as long-retained metabolites [22,
24]. It is problematic to predict the time of drug use and the degree of impairment of the physical and psychological performance on the basis of urinary THC-COOH levels [20]. Plasma levels are more reliable, whereas a urine test positive for THC-COOH so far only allows a “yes” conclusion and is not a proof of recent cannabis use [25,
26]. Consequently, it was the main objective of the present study to evaluate target analytes with shorter urinary excretion times. Pharmaceutical-grade cannabis cigarettes, the most prevalent application form, were used for this clinical trial on light cannabis users. Finally, urine samples from athletes who tested cannabis-positive (15 ng/mL or more THC-COOH) were reanalyzed.
Experimental
Materials
THC, THC-OH, THC-COOH and their d3-deuterated
analogs (internal standards) were supplied by Lipomed (Arlesheim, Switzerland). β-Glucuronidase (type IX-A from Escherichia coli) and N,O-bis(trimethylsilyl)trifluor-oacetamide (BSTFA) containing 1% trimethylchlorosilane (TMCS) were from Sigma-Aldrich (Buchs, Switzerland). The Bakerbond C18 500 mg/3 mL and UCT Clean Screen
CSTHC203 200 mg/3 mL solid phase extraction (SPE) columns were provided by Stehelin (Basel, Switzerland) and Amchro (Hattersheim, Germany), respectively. Pooled plasma was provided by the Blood Donation Center Berne. All other chemicals were of the highest analytical grade and were supplied by Sigma-Aldrich or Grogg (Bern, Switzerland).
Clinical test preparation
Dried cannabis flowers (cannabis flos, variety Bedrocan) standardized to 7% THC (Bedrobinol®) were supplied by the Dutch Ministry of Health, Welfare & Sport, Office of
Medicinal Cannabis (The Hague, The Netherlands). To prepare the cigarettes, this material was then crushed, homogenized, and 1,000 mg was filled into Cones® (Vandenberg Special Products, Rotterdam, The Nether-lands), resulting in a content of 70 mg THC.
Clinical study
Twelve healthy, male volunteers (age 26±3 years, BMI 24±2 kg/m2), tobacco and light cannabis smokers (once or less per month), with normal lung functions (spirometry) and a negative cannabis urine test (Instant-View marijuana/ THC urine test, Medim, Baar, Switzerland) before the start of the session were included in the study (ClinicalTrials.gov identifier NCT00534716). The use of alcohol, any medica-tion, or drugs within the last 2 days prior to and during the 1-day session was not allowed. Cannabis use was also not allowed during the following 10 days of urine collection. All participants provided written informed consent and were under medical surveillance at the Clinical Investiga-tion Unit (CIU) of the University Hospital Berne for 10 h after drug administration. To keep the subjects at the CIU for the whole study period (11 days) was technically not feasible. However, the subjects were evaluated very carefully regarding reliability and potential risk of smoking cannabis when not under observation. The study was conducted according to GCP and ICH guidelines and considering the Declaration of Helsinki (Washington). It was approved by the Ethics Committee of the Canton of Berne (permit KEK-BE 033/07), Swissmedic (reference no. 2007 DR 1139), and the Swiss Federal Office of Public Health.
The standardized smoking and inhalation procedure was performed according to a paced-puffing procedure [27,28]. It consisted of eight inhalation cycles, with 20-s retention and 40-s pause. According to the residual THC content, the mean THC amount released was 45±7 mg per cigarette. Blood samples (10 mL) were collected by a venous catheter 15 min before (baseline) and 5, 10, 20, 40, 60, 90, 120, 180, 240, and 480 min after smoking. The samples were immediately centrifuged (1,500 rcf, 10 min, 4 °C) and the plasma was then instantly frozen at −20 °C. The baseline urine sample was collected 15 min before the start of the study. Total urine (no voiding between collection intervals) was sampled 2, 4, 6, 8, 12, and 24 h after administration, followed by sampling once a day (first urine void in the morning) for the next 10 days. Aliquots of 50 mL of each void were instantly deep-frozen. Psychotropic and somatic side effects (sedation, euphoria, anxiety, nausea, vertigo, headache, irritation of airways, coughing, etc.) were measured by a visual analog scale (VAS), with 0 cm (0%) on the 10-cm VAS representing “not at all” and 10 cm representing (100%) “very strong.” Vital functions (pulse
oximetry, blood pressure, heart rate) were measured by patient monitors.
Urine samples from athletes
Eighty-one urine specimens from athletes were collected between 2004 and 2009 in Switzerland and other countries for doping control purposes in and out of competition. They tested positive for cannabis (15 ng/mL or more THC-COOH) and were provided by the Swiss Laboratory for Doping Analyses in Epalinges.
Analytical assays
THC analysis of clinical test materials
The THC content in cannabis flowers and cannabis cigarettes before and after smoking was determined by gas chromatography (GC) with flame-ionization detection [29].
Plasma analysis
The concentration of total THC, OH, and THC-COOH (conjugated plus free portion) in plasma was determined by GC/mass spectrometry (MS) after enzymatic hydrolysis and automated SPE, following the method of Feng et al. [30]. In detail, thawed plasma samples were sonicated for 2 min, centrifuged, and then 30 μL internal standard solution (containing 0.2 μg/mL THC-d3,
THC-OH-d3, and THC-COOH-d3, each), 2,440 μL 0.1 M
potassium phosphate buffer (pH 6.8), and 200 μL β-glucuronidase solution (type IX-A from E. coli, 25,000 U/ mL 0.1 M phosphate buffer) were added to 600-μL aliquots. The mixture was then incubated at 37 °C for 16 h and after cooling 500 μL was transferred to a preconditioned Bakerbond SPE C18 column by using a
robotic SPE system (Aspec XL, Gilson, Villiers Le Bel, France). The SPE procedure was as follows: conditioning with 3 mL methanol twice followed by 3 mL water; washing with 3 mL water, 3 mL 0.25 M acetic acid, 3 mL water, and 0.075 mL acetonitrile; elution with 0.5 mL acetone three times. After evaporation to dryness under nitrogen (Zymark TurboVap® LV Evaporator, Zymark, Oftringen, Switzerland) the residue was derivatized with 60μL BSTFA–TMCS at 70 °C for 30 min.
A 2-μL aliquot was then injected splitless into the GC/ MS system. The Agilent GC/MS system consisted of a GC 6890 N with electronic pressure control, a 7683 autosam-pler, and a 5975 C mass-selective detector (Agilent, Waldbronn, Germany). For separation, a DB-5MS capillary column was used (25 m×0.2-mm inner diameter, 0.33-μm film; J&W Scientific, supplied by MSP Kofel, Berne,
Switzerland) with helium as the carrier gas at a constant flow rate of 1.2 mL/min. The injector, transfer line, and ion source temperatures were 250, 280, and 230 °C, respec-tively. The oven temperature was programmed from 150 °C (0.5 min) to 280 °C at 5 °C/min, and was held at 280 °C for 5 min. The MS system was operated in the selected ion monitoring mode and the electron multiplier was set at 2,000 eV. The qualifier and quantifier ions (underlined) for identification were m/z 386, 371, and 303 for THC– tetramethylsilane (TMS); 474 and 371 for THC-OH-TMS2; 488, 473, and 371 for THC-COOH-TMS2; 389
and 374 for THC-d3-TMS; 477, 377, and 374 for
THC-OH-d3-TMS2; and 491, 476, and 374 for THC-COOH-d3
-TMS2. Peak assignment was achieved using retention
times, the characteristic ions and ion ratios of the analytes versus those of control samples. The accepted tolerances were ±0.1 min and ±15%, respectively.
Calibration was performed by using the internal standard method and linear regression analysis (least-squares model) over the concentration range from 0.3 to 75 ng/mL. The calibrators (N=7) were prepared by spiking pooled blank plasma with 10 ng/mL internal standard and 0.3–75 ng/mL nondeuterated standards. The controls (N=5) were prepared by spiking pooled blank plasma with 10 ng/mL internal standard and 0.5–50 ng/mL nondeuterated standards. Triplicates were extracted and analyzed as described above. Quantitation was based on the target ion ratio of non-deuterated to non-deuterated analyte abundance.
Urine analysis
The concentration of total THC, OH, and THC-COOH in urine was determined by GC/MS after enzymatic hydrolysis (according to [17]) and automated SPE. In detail, thawed urine specimens were vortexed and then 60 μL internal standard solution (containing 1.0 μg/mL THC-d3, THC-OH-d3, and THC-COOH-d3, each), 610μL
0.1 M potassium phosphate buffer (pH 6.8), and 200μL β-glucuronidase solution (50,000 U/mL 0.1 M phosphate buffer) were added to 2,400-μL aliquots. The mixture was then incubated at 37 °C for 16 h and after cooling 2,725μL was transferred to a preconditioned UCT Clean Screen CSTHC203 SPE column. The SPE procedure was as follows: conditioning with 3 mL methanol, 3 mL water, and 2 mL 0.1 M acetic acid; washing with 2 mL water, 2 mL 0.1 M hydrochloric acid–acetonitrile 70:30 (v/v); elution with 3 mL 80:20 hexane–ethyl acetate. After evaporation to dryness under nitrogen the residue was redissolved in 25 μL acetonitrile and derivatized with 20μL BSTFA–TMCS at 85 °C for 30 min.
A 2-μL aliquot was then injected splitless into the GC/ MS system. For separation, a DB-35MS capillary column was used (15 m×0.32-mm inner diameter, 0.2-μm film)
with helium as the carrier gas at a constant flow rate of 2.4 mL/min. The injector and transfer line temperatures were 250 and 280 °C, respectively. The oven temperature was programmed from 100 °C (1 min) to 325 °C at 10 °C/ min, and was held at 325 °C for 1 min. The MS system was operated in the selected ion monitoring mode and the electron multiplier was set at 2,000 eV (low-range calibration curve) or 1,200 eV (high-range calibration curve).
The same ions and parameters were used for peak assignment and quantitation as for the plasma analysis. However, owing to the extremely wide concentration ranges of the urine analytes, two calibration curves (low/ high range) were necessary for THC-OH (0.1–25/25– 250 ng/mL) and THC-COOH (0.1–50/50–1,000 ng/mL) to stay within the linear range of the calibration graph. Low-range calibrators (N=9) were prepared by spiking pooled blank (baseline) urine samples with 25 ng/mL internal standard, 0.1–25 ng/mL THC and THC-OH, and 0.1–50 ng/ mL THC-COOH. High-range calibrators (N=8) contained 25 ng/mL internal standard, 25–250 ng/mL THC-OH, and 50–1,000 ng/mL THC-COOH. No high-range calibration was necessary for THC. THC, THC-OH, and THC-COOH controls (N=10) were prepared by spiking pooled blank urine samples with 25 ng/mL internal standard and 0.25– 22.5, 0.25–225, and 0.25–550 ng/mL nondeuterated stand-ards, respectively. Triplicates were extracted and analyzed as described above.
Assay validation
Validation of plasma and urine analysis methods was performed according to the guidelines of ICH [31], the Society of Toxicological and Forensic Chemistry (GTFCh) [32] and Peters et al. [33]. Interferences of matrix peaks with target analytes (selectivity) were checked by pooled blank plasma and urine as well as baseline specimens of all 12 subjects without adding standards. Control samples (N= 3) were used to determine the lower limit of quantitation (LLOQ) and the limit of detection (LOD). The LOD was the lowest concentration at which the signal-to-noise ratio (S/N, peak height) was 3 or more with acceptable peak shape and resolution. The LLOQ was the lowest concen-tration fulfilling the LOD criterion, reaching at S/N 6 or more the nominal values of the analytes within ±20% and with a relative standard deviation (RSD) of less than 20%. Intraday and interday accuracy and precision were deter-mined at three concentrations. Each level was measured five times on the same day (intraassay) and on 9 days (interassay) during 1 month, respectively.
Analyte stability was checked using control samples at low, medium and high concentrations; the analytes were reanalyzed after being stored at −20 °C for 30 days and
were compared with freshly prepared control samples. The stability in derivatized extracts was similarly checked, however by comparing them with extracts kept at room temperature for 36 h. As plasma and urine specimens were instantly portioned and deep-frozen when collected, freeze– thaw stability was not determined. Athletes’ urine samples were stored at−80 °C until analysis. The relative recovery was determined by using control samples at low and medium concentrations (0.25–60 ng/mL, N=4) and com-paring the peak areas with those of the solution of analytes corresponding to 100% recovery.
Results
Assay validation
Correlation coefficients r2≥0.999 for all analytes indicate good linearity of the calibration graphs ranging from 0.3 to 75 ng/mL and from 0.1 to 1,000 ng/mL for plasma and urine, respectively. However, two calibration graphs were necessary for measuring THC-OH and THC-COOH in urine. Even in the case of sometimes very concentrated athletes’ urine samples, no matrix signals interfered with those of the analytes; thus, the chromatographic system proved to be selective. With an LLOQ of 1.0 (THC), 0.3 (THC-OH), and 0.75 ng/mL (THC-COOH) in plasma (S/N 10) and 0.1 ng/mL for all analytes in urine (S/N 8) the assays were sufficiently sensitive. The LOD for both matrices and all analytes was 0.1 ng/mL (S/N 3). With intraassay and interassay accuracies of−7 to 10% and −5 to 4% (deviation from target concentration, N=5) for plasma and −6 to 6% and −5 to 4% for urine, respectively, the assays were precise. With intraassay and interassay pre-cisions of 2 to 11% and 3 to 7% (RSD, N=5) for plasma and 1 to 3% and 1 to 5% for urine, respectively, the assays were also repeatable and reproducible.
The recoveries (mean ± RSD, N=4) ranged from 61±9 to 76±4% in plasma and from 68±4 to 88±3% in urine, respectively. The efficiency of the enzymatic conjugate hydrolysis has been shown by Huestis et al. [17] and therefore was not tested. When the analytes were stored at −20°C for 30 days in a matrix, no loss of analytes was observed. In derivatized extracts the content varied from−3 to 5% and from−7 to 4% when they were kept at ambient temperature for 36 h and at −20 °C for 1 month, respectively.
Smoking procedure
The rationale to use cannabis cigarettes with 7% THC was that the average THC content of marijuana sold in Switzerland for the last few years was about 11%
(Brenneisen et al., Swiss cannabis profiling study, unpub-lished data). Although standardized cannabis cigarettes were smoked following a paced-puffing procedure, the estimation of the THC dose administered by smoking is a major variable. Together with the differing efficiency of inhalation, the losses by side-stream smoke and pyrolysis are uncontrollable factors [19]. It has been shown that only 20–37% of THC is delivered in the main-stream smoke [34], with pyrolytic destruction of 23–30% and a
side-stream loss of 6–53% [18, 35]. The pulmonary bioavail-ability of THC varied between 10 and 50% [15,18].
In the present study, the mean amount of THC released by smoking from cigarettes, containing 70 mg THC, was 45±7 mg. Therefore, an average inhaled dose of about 25 mg THC can be estimated, with about 8 mg systemically available.
Plasma levels
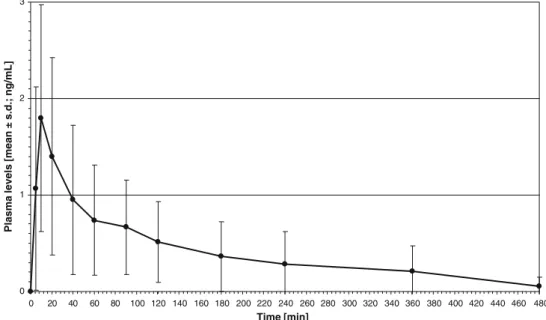
The plasma concentrations of total THC, THC-OH, and THC-COOH of subjects A–L after a pulmonary dose of 25 mg THC (estimated) are presented in the electronic supplementary material (Table S1). Figure 1 shows the plasma profiles of mean total THC with peak plasma concentrations of 4.2–59.1 ng/mL (20.9±16.9 ng/mL, mean ± standard deviation), occurring at tmaxof 5 min. The THC
levels varied between 0.2 and 59.1 ng/mL. THC disap-peared (levels below the LOD of 0.1 ng/mL) from plasma within 20 min (subjects B, I), 40 min (subjects A, E, G), 90 min (subjects D, J), and 120–180 min (subjects C, F, H, L). In subject K, THC was still detectable 360 min after administration.
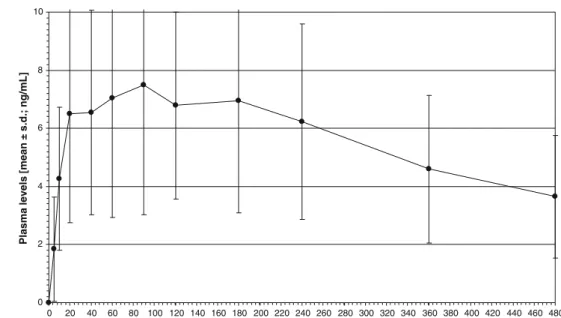
Figures 2 and3 show the plasma profiles of mean total THC-OH and THC-COOH. With 0.3–3.9 ng/mL (1.8± 1.2 ng/mL), plasma peaks of THC-OH were measured at 5– 20 min. The THC-OH levels varied between 0.1 and 3.9 ng/mL. THC-OH was detectable up to 40 min (subject A), 120 min (subjects B, J), 180 min (subjects H, I), and 240 min (subjects E, L), whereas the plasma samples of five subjects (C, D, F, G, K), still contained 0.2 ng/mL or more at the last two collection time points (360 and 480 min). The THC-COOH plasma peak concentrations of 3.3–16.4 ng/mL (7.7±4.4 ng/mL) occurred between 20 and 180 min. The THC-COOH levels varied between 0.4 and 16.4 ng/mL. With a mean concentration of 3.7±2.1 ng/ mL, THC-COOH was still present at 480 min in all 12 subjects.
Urine levels
The urine concentrations of total THC, THC-OH, and THC-COOH of subjects A–L after a pulmonary dose of 25 mg THC (estimated) are presented in the electronic
supplementary material (Table S2). The renal excretion of THC started within 2 h after smoking and mostly ended after 4–6 h, with peak concentrations of 0.2–1.3 ng/mL (0.7 ± 0.3 ng/mL, mean ± standard deviation) in the 2-h urine void (see also Fig. 4). The THC levels varied between 0.1 and 1.3 ng/mL. Subject A excreted THC only in the first void after administration, whereas subject I excreted THC up to 8 h. The maximum urine levels of THC-OH were 2.5–14.4 ng/mL (7.1±4.3 ng/mL), in most subjects measured in the 2-h urine voids too (Fig.5). The THC-OH levels varied between 0.1 and 14.4 ng/mL. Except for subject G, where this metabolite was amazingly detectable up to 96 h after administration, THC-OH dropped below the LOD (0.1 ng/mL) after 12–72 h. As expected, the urinary excretion window for THC-COOH
was broader than that for THC and THC-OH. In most subjects, THC-COOH could be detected up to 72–96 h after smoking, with 3.9–38.2 ng/mL (15.3±10.4 ng/mL), peak-ing at 6–24 h (Fig. 6). The THC-COOH levels varied between 0.5 and 38.2 ng/mL. Only subject E still had 1.1 ng/ mL in his 120-h urine. Subjects C, D, F, and J showed THC-COOH urine levels of 15 ng/mL or more (cutoff set by WADA) up to 24, 12, and 6 h, respectively. All other subjects did not reach concentrations above the cutoff.
The urine samples (N=81) from athletes who tested cannabis-positive (15 ng/mL or more THC-COOH) in the routine doping screening procedure showed THC concen-trations in the range from 0 to 68.8 ng/mL, with a mean of 2.5±8.2 ng/mL. No THC was detectable in 35% of the samples. In 22 and 40% of the samples the concentration
0 5 10 15 20 25 0 20 40 60 80 100 120 140 160 180 200 220 240 260 280 300 320 340 360 380 400 420 440 460 480 Time [min]
Plasma levels [mean s.d.; ng/mL]
Fig. 1 Plasma levels of total
Δ9
-tetrahydrocannabinol (THC; N=12) after smoking a cannabis cigarette standardized to 7% THC. Peak plasma concentra-tions (Cmax) of 4.2–59.1 ng/mL (20.9±16.9 ng/mL) occurred at
tmaxof 5 min. Minimum
detect-able amounts (greater than or equal to the limit of detection,
LOD) were measured at 10–
360 min. s.d. standard deviation
0 1 2 3 0 20 40 60 80 100 120 140 160 180 200 220 240 260 280 300 320 340 360 380 400 420 440 460 480 Time [min]
Plasma levels [mean ± s.d.; ng/mL]
Fig. 2 Plasma levels of total
11-hydroxy-Δ9
-tetrahydrocannabi-nol (THC-OH; N=12). The
mean Cmaxwas 1.8±1.2,
mea-sured at tmaxof 5–20 min.
Min-imum detectable amounts (greater than or equal to the
LOD) were reached at 40–
ranges were 0.1–1 and 1–10 ng/mL, respectively. THC-OH ranged from 0 to 2,213.6 ng/mL, with a mean of 51.2± 246.3 ng/mL. No THC-OH was detectable in 2% of the samples. In 40 and 47% of the samples it ranged from 1 to 10 ng/mL and from 10 ro 100 ng/mL, respectively. THC-COOH ranged from 1.0 to 9,982.9 ng/mL, with a mean of 245.3 ± 1,111.2 ng/mL. Fifty-two, 28, and 7% of the samples contained 10–100, 100–500, and more than 500 ng/mL, respectively.
Psychological and somatic side effects
The most observed side effects with high interindividual variability were sleepiness (18–48±15–33% VAS score, mean ± standard deviation), euphoria (18–32±23–31%),
dry mouth (3–43±4–32%), and perception alterations (1–19±1–32%). Mild cardiovascular side effects were tachycardia and hypotonia.
Discussion
The fully validated GC/MS methods with prior hydrolysis and automated SPE was shown to be robust, sensitive, accurate, and reproducible.
To the best of our knowledge, no controlled smoking study with high-grade cannabis on light cannabis users measuring THC and metabolites in plasma as well as monitoring excretion in urine over 11 days has been performed so far. It was a requirement of the Ethics
0 2 4 6 8 10 0 20 40 60 80 100 120 140 160 180 200 220 240 260 280 300 320 340 360 380 400 420 440 460 480 Time [min]
Plasma levels [mean ± s.d.; ng/mL]
Fig. 3 Plasma levels of total
11-nor-9-carboxy-Δ9
-tetrahydro-cannabinol (THC-COOH; N=
12). The mean Cmaxwas 7.7±
4.4 ng/mL (3.3–16.4 ng/mL),
measured at tmaxof 20–180 min.
At 480 min THC-COOH was still present in all subjects. The concentrations at the last
collec-tion time point were 1.6–7.8
ng/mL 0.0 0.2 0.4 0.6 0.8 1.0 0 12 24 36 48 60 72 84 96 108 120 132 144 156 168 180 192 204 216 228 240 252 264 Time [h]
Urine concentration [mean ± s.d., ng/mL]
Fig. 4 Urine levels of total THC (N=12). The mean Cmax
was 0.7±0.3 ng/mL (0.2–1.3 ng/
mL), measured in the 2-h void.
No more THC was detectable 4–
Committee to include only male volunteers in the study, being cannabis-naïve or infrequent, light users. These limiting inclusion criteria were not regarded as study drawback as we hypothesized that top athletes are not heavy, frequent users and because all Swiss athletes who have tested cannabis-positive so far have been males (Antidoping Switzerland, personal communication, 2009). However, to improve the interpretation of cannabis-positive doping cases of female athletes, pharmacokinetic data of a controlled smoking study on female volunteers are needed too.
To keep the subjects at the CIU for the whole study period (11 days) was technically not feasible and not necessary, as the subjects were evaluated very carefully regarding reliability, thus minimizing the potential risk of
smoking cannabis when not under observation. In addition, forbidden and uncontrolled cannabis consumption would have been detected by altered urine excretion profiles, such as concentration“spikes.”
THC rapidly reached peak levels, which were about tenfold and threefold higher than those of THC-OH and THC-COOH, respectively. Huestis et al. [36], who used cannabis cigarettes standardized to 1.75 or 3.55% THC, found mean THC plasma peaks 20 and 3 times greater than those of THC-OH and THC-COOH, respectively. The mean times to peak concentrations (THC, 8.4 min; THC-OH, 13.8 min) were rapid as in the present study. However, the detection times of 7–13 h for THC and 5–11 h for THC-OH were much longer. The THC plasma peaks are characterized by very high interindividual variability
0 2 4 6 8 10 0 12 24 36 48 60 72 84 96 108 120 132 144 156 168 180 192 204 216 228 240 252 264 Time [h]
Urine concentration [mean ± s.d., ng/mL]
Fig. 5 Urine levels of total THC-OH (N=12). The mean
Cmaxwas 7.1±4.3 ng/mL (2.5–
14.4 ng/mL), in nine of 12 subjects measured in the 2-h urine voids. Except for one subject, where THC-OH could be detected up to 96 h after administration, THC-OH dropped below the LOD (0.1 ng/ mL) after 12–72 h 0 5 10 15 20 0 12 24 36 48 60 72 84 96 108 120 132 144 156 168 180 192 204 216 228 240 252 264 Time [h]
Urine concentration [mean ± s.d., ng/mL]
Fig. 6 Urine levels of total THC-COOH (N=12). The
mean Cmaxwas 15.3±10.4 ng/
mL (3.9–38.2 ng/mL), mostly
measured after 6–8 h. In nine of
12 subjects, THC-COOH could
be detected up to 72–96 h. One
subject still excreted 1.1 ng/mL in his 120-h void
(20.9±16.9 ng/mL at 5 min). It is well known that the highly variable bioavailability of THC after smoking is mainly due to individual differences in inhalation techni-ques and experience [37]. Additionally, in contrast to experienced users, inexperienced cannabis smokers seem to titrate their dose to a much smaller amount.
As demonstrated by Huestis et al. [36], the THC-COOH plasma concentrations peaked later, and showed a long-lasting plateau and a slow decrease. The urinary peak times of THC and metabolites were in agreement with those found in another study, involving smoking cannabis cigarettes which contained 3.58% THC [20]. The authors suggested THC levels of more than 2 ng/mL as indicative for cannabis use within the last 5 h. However, the observation time was only 8 h (11 days in the present study); therefore, no comparison of the detection windows is possible.
Lowe et al. [12] studied chronic, heavy cannabis users and found THC and THC-OH to be excreted in urine for up to 24 days. These findings support the hypothesis of Hunt and Jones [38] that the rate-limiting step in the terminal elimination of THC is its slow excretion from tissue stores that may be extended following chronic cannabis use. Therefore, THC and THC-OH were not regarded as suitable biomarkers for recent cannabis consumption.
As reported previously [20], THC-COOH showed the highest intrasubject and intersubject variability (“sawtooth pattern” [18,39–41]) and was still detectable after 3 days (about 4 days after smoking a 3.58% cannabis cigarette [42]). Thus, the main THC metabolite is not suitable as a urine marker for recent use. Rather, THC-COOH in urine is only suggestive of cannabis consumption at some time in the past [20].
Only four of 12 subjects reached THC-COOH urine levels above the cutoff level set by WADA (15 ng/mL). These were measured 6–24 h after administration. Within 8 h, only 0.22±0.16% of the estimated absorbed THC dose (8 mg) was excreted in the form of THC and metabolites. The total excretion rate could not be calculated as only the first morning void was available from study day 2 to study day 11. Other studies have shown a 20% elimination of the total dose excreted via urine [38,43].
It has to be noted that all volunteers underwent an extensive medical check, stayed healthy for the whole study period (posttrial check, otherwise excluded), and were told not to start a diet and not to perform intensive sport activities. Therefore, these factors cannot be responsible for the sometimes highly variable plasma and urine profiles observed. However, as no genotyping was performed, polymorphisms cannot be excluded.
It is also for the first time that urine samples from athletes who tested positive for THC-COOH were rean-alyzed by measuring THC and THC-OH too. Besides high
to very high COOH concentrations, THC and THC-OH were detectable,in 53 (65%) and 79 (98%),
respective-ly, of the 81 urine samples from athletes. On the basis of the data of our controlled smoking study and assuming light cannabis use, we estimate that in these cases consumption of cannabis took place within 8 to 72 h before urine sampling. With 68.8 ng/mL THC, 2,213.6 ng/mL THC-OH, and 9,982.9 ng/mL THC-COOH, one athlete showed extremely high cannabinoid levels, indicating high-grade cannabis and/or regular, frequent use.
Conclusions
In addition to the long-lasting THC metabolite THC-COOH, the parent compound THC and its psychoactive first metabolite THC-OH should be used as target analytes for cannabis doping urine analysis. In the case of light cannabis use this would enhance the chance to detect recent cannabis consumption potentially influencing the athlete’s performance in competitions. However, these additional target analytes do not allow one to discriminate the intention of cannabis use, that is, for recreational or doping purposes.
Before cutoff levels for THC and THC-OH can be set, more cannabis-positive urine samples from athletes have to be reanalyzed. The results should then be carefully evaluated also considering the statements made by the athletes in justification interviews. Another option is to include blood in cannabis doping analysis. This would allow a firmer conclusion to be drawn on whether the subject indeed consumed cannabis shortly before being tested and experienced pharmacological effects of cannabi-noids during competition. It can be expected that in the future some female athletes will also test cannabis-positive. Therefore, pharmacokinetic data of a clinical smoking study on female volunteers are needed too.
Acknowledgements Special thanks go to the staff of the CIU and
Arno Hazekamp, University of Leiden, for assisting in the supply of the test material (Bedrobinol®). The study was supported by Antidoping Switzerland, Berne, Switzerland.
References
1. Thevis M, Kuuranne T, Geyer H, Schänzer W (2009) Drug Test
Anal 1:4–13
2. Antidoping Agency Switzerland (2009) List of prohibited sub-stances and methods (doping list). Antidoping Agency Switzer-land, Berne
3. Saugy M, Avois L, Saudan C, Robinson N, Giroud C, Mangin P,
Dvorak J (2006) Br J Sports Med 40(Suppl 1):i13–i15
4. Lorente FO, Peretti-Watel P, Grelot L (2005) Addict Behav
5. Wall ME, Perez-Reyes M (1981) J Clin Pharmacol 21:178S–189S
6. Fraser AD, Worth D (2004) Forensic Sci Int 143:147–152
7. Mareck U, Fusshöller G, Geyer H, Haenelt N, Thevis M, Kamber M, Brenneisen R, Schänzer W (2006) In: Schänzer W, Geyer H, Gotzmann A, Mareck U (eds) Recent advances in doping analysis (14). Sport und Buch Strauss, Cologne, pp 101–109
8. Kamber M, Hintz O (2005) Annual report 2005. Antidoping Switzerland, Berne
9. Musshoff F, Madea B (2006) Ther Drug Monit 28:155–163 10. Baselt RC, Cravey RH (1995) Disposition of toxic drugs and
chemicals in man, 4th edn. Chemical Toxicology Institute, Foster City
11. Perez-Reyes M, Lipton MA, Timmons MC, Wall ME, Brine DR,
Davis KH (1973) Clin Pharmacol Ther 14:48–55
12. Lowe RH, Abraham TT, Darwin WD, Herning R, Cadet JL,
Huestis MA (2009) Drug Alcohol Depend 105:24–32
13. Perez-Reyes M, Timmons MC, Lipton MA, Davis KH, Wall ME
(1972) Science 177:633–635
14. Christensen HD, Freudenthal RI, Gidley JT, Rosenfeld R, Boegli G, Testino L, Brine DR, Pitt CG, Wall ME (1971) Science
172:165–167
15. Iversen L (2000) The science of marijuana. Oxford University Press, Oxford
16. Cone EJ, Huestis MA (1993) Ther Drug Monit 15:527–532 17. Abraham TT, Lowe RH, Pirnay SO, Darwin WD, Huestis MA
(2007) J Anal Toxicol 31:477–485
18. Huestis M (1999) In: Nahas GG, Sutin K, Harvey D, Agurell S
(eds) Marihuana and medicine. Humana, Totowa, pp 105–116
19. McGilveray IJ (2005) Pain Res Manag 10:15A–22A
20. Manno JE, Manno BR, Kemp PM, Alford DD, Abukhalaf IK, McWilliams ME, Hagaman FN, Fitzgerald MJ (2001) J Anal
Toxicol 25:538–549
21. Skopp G, Potsch L (2008) J Anal Toxicol 32:160–164
22. Leighty EG, Fentiman AF Jr, Foltz RL (1976) Res Commun
Chem Pathol Pharmacol 14:13–28
23. Johansson E, Halldin MM, Agurell S, Hollister LE, Gillespie HK
(1989) Eur J Clin Pharmacol 37:273–277
24. Haggerty GC, Deskin R, Kurtz PJ, Fentiman AF, Leighty EG
(1986) Toxicol Appl Pharmacol 84:599–606
25. Niedbala RS, Kardos KW, Fritch DF, Kardos S, Fries T, Waga J,
Robb J, Cone EJ (2001) J Anal Toxicol 25:289–303
26. Toennes SW, Kauert GF, Steinmeyer S, Moeller MR (2005)
Forensic Sci Int 152:149–155
27. Fant RV, Heishman SJ, Bunker EB, Pickworth WB (1998) Pharmacol Biochem Behav 60:777–784
28. Heishman SJ, Stitzer ML, Bigelow GE (1988) Pharmacol Biochem Behav 31:649–655
29. Brenneisen R, ElSohly MA (1988) J Forensic Sci 33:1385– 1404
30. Feng S, ElSohly MA, Salamone S, Salem MY (2000) J Anal
Toxicol 24:395–402
31. International Conference on Harmonization (1996) Validation of analytical methods: methodology ICH Q2 B
32. Peters FT, Hartung M, Herbold M, Schmitt G, Daldrup T,
Musshoff F (2004) Toxichem Krimtech 71:146–154
33. Peters FT, Drummer OH, Musshoff F (2007) Forensic Sci Int
165:216–224
34. Davies KH, McDaniel IA, Caddel LW, Moody PL (1984) In: Agurell S, Dewey WL, Willette RE (eds) The cannabinoids: chemical, pharmacologic, and therapeutic aspects. Academic, New York, pp 97–109
35. Perez-Reyes M (1990) NIDA Res Monogr 99:42–62
36. Huestis MA, Henningfield JE, Cone EJ (1992) J Anal Toxicol 16:276–282
37. Kauert GF, Ramaekers JG, Schneider E, Moeller MR, Toennes
SW (2007) J Anal Toxicol 31:288–293
38. Hunt CA, Jones RT (1980) J Pharmacol Exp Ther 215:35–44
39. Agurell S, Halldin M, Hollister L (1990) In: Watson R (ed) Biochemistry and physiology of substance abuse. CRC, Boca
Raton, pp 138–172
40. McBurney LJ, Bobbie BA, Sepp LA (1986) J Anal Toxicol
10:56–64
41. Hollister L, Gillespie H, Ohlsson A, Lindgren J, Wahlen A,
Agurell S (1981) J Clin Pharmacol 21:171S–177S
42. Huestis MA, Mitchell JM, Cone EJ (1996) J Anal Toxicol
20:441–452
43. Wall ME, Sadler BM, Brine D, Taylor H, Perez-Reyes M (1983) Clin Pharmacol Ther 34:352–363