Publisher’s version / Version de l'éditeur:
Analytical Chemistry, 77, 8, pp. 2432-2436, 2005-02-23
READ THESE TERMS AND CONDITIONS CAREFULLY BEFORE USING THIS WEBSITE. https://nrc-publications.canada.ca/eng/copyright
Vous avez des questions? Nous pouvons vous aider. Pour communiquer directement avec un auteur, consultez la première page de la revue dans laquelle son article a été publié afin de trouver ses coordonnées. Si vous n’arrivez pas à les repérer, communiquez avec nous à PublicationsArchive-ArchivesPublications@nrc-cnrc.gc.ca.
Questions? Contact the NRC Publications Archive team at
PublicationsArchive-ArchivesPublications@nrc-cnrc.gc.ca. If you wish to email the authors directly, please see the first page of the publication for their contact information.
NRC Publications Archive
Archives des publications du CNRC
This publication could be one of several versions: author’s original, accepted manuscript or the publisher’s version. / La version de cette publication peut être l’une des suivantes : la version prépublication de l’auteur, la version acceptée du manuscrit ou la version de l’éditeur.
For the publisher’s version, please access the DOI link below./ Pour consulter la version de l’éditeur, utilisez le lien DOI ci-dessous.
https://doi.org/10.1021/ac048539t
Access and use of this website and the material on it are subject to the Terms and Conditions set forth at
Determination of thorium and uranium in ultrapure lead by inductively
coupled plasma mass spectrometry
Grinberg, Patricia; Willie, Scott; Sturgeon, Ralph E.
https://publications-cnrc.canada.ca/fra/droits
L’accès à ce site Web et l’utilisation de son contenu sont assujettis aux conditions présentées dans le site LISEZ CES CONDITIONS ATTENTIVEMENT AVANT D’UTILISER CE SITE WEB.
NRC Publications Record / Notice d'Archives des publications de CNRC:
https://nrc-publications.canada.ca/eng/view/object/?id=96474616-5f4e-4a67-b2ca-d08f94726305
https://publications-cnrc.canada.ca/fra/voir/objet/?id=96474616-5f4e-4a67-b2ca-d08f94726305
Determination of Thorium and Uranium in
Ultrapure Lead by Inductively Coupled Plasma
Mass Spectrometry
Patricia Grinberg,* Scott Willie, and Ralph E. Sturgeon
Institute for National Measurements Standards, National Research Council Canada, Ottawa, Ontario, Canada K1A 0R6
A method for the determination of U and Th at sub-ppt levels in high-purity Pb samples using extraction chro-matography with ICPMS detection is described. Following acid digestion, uranium and thorium are separated from the lead matrix using UTEVA resin. Sorption and elution procedures were optimized, the potential reusability of the chromatographic resin was evaluated, and a performance comparison between prepacked and freshly prepared UTEVA column was made. Uranium could be eluted with 0.025 M HCl and Th then recovered using 0.5% oxalic acid. Recovery yields for U exceed 80% whereas those for Th were typically 60%. Procedural detection limits of 0.5 and 1.5 pg g-1were obtained for U and Th, respectively.
For purposes of comparison, GD-MS analysis of samples was also performed, yielding results consistent with those generated by ICPMS but with inferior detection power.
One of the most important fields in particle physics today is neutrino physics.1Information regarding the properties of
neu-trinos, such as their mass and whether they interconvert, will provide researchers with a better understanding of how subatomic particles have influenced the evolution of the universe. Several detectors have been built in the last few decades in order to gather such information.2-5The enriched xenon-136 observatory (EXO)
is undertaking construction of a detector, which uses large amounts of isotopically enriched136Xe at the Waste Isolation Pilot
Plant facility in New Mexico. One of their goals is to make the first measurement of the absolute mass of the electron neutrino by detecting “neutrino-less double-β decay”, a rare nuclear process that occurs when a disintegrating nucleus emits two electrons.6
This detector must be housed deep underground to protect it from natural cosmic rays, which interfere with the detection of neutrinos. Furthermore, all materials selected for use in the detector must be of high purity. One particular concern is the
concentration of U and Th in the Pb shield surrounding the Xe, as these elements increase the background because their decay chain generates emission of a γ ray simulating the neutrino-less double β decay. The preconceived upper limit on the concentra-tions of U and Th that can be tolerated in the high-purity Pb is 3 and 1 pg g-1, respectively.7
Although these elements have been traditionally measured by radiometric techniques, such as R spectroscopy,8-10γ
spectros-copy,11-13and neutron activation analysis,14-18these are not ideally
suited to rapid or accurate determinations.
Inductively coupled plasma mass spectrometry (ICPMS) is considered one of the most powerful analytical methods for trace and ultratrace analysis, offering subpicogram per milliliter detec-tion limits for U and Th with minimal analysis time. However, one of the main limitations of this technique is the need for sample preparation prior to analysis, as higher levels of matrix compo-nents can give rise to deposition of matrix constituents on the sampler and skimmer cones of the spectrometer. Thus, a dissolved sample may need to be diluted in order to lower its total dissolved solids content to <1%, which clearly degrades achievable detection limits and, in this case, prevents determination of U and Th in Pb at ultratrace levels. One way of overcoming this drawback is to undertake prior separation of the analytes from the matrix. Several methods, such as ion exchange,19,20coprecipitation,21-23
liquid-* Corresponding author. Fax: 613-993-2451. E-mail:patricia.grinberg@nrc.ca. (1) Mohapatra, R. N.; Pal, P. B. Massive neutrinos in physics and astrophysics,
3rd ed.; World Scientific: Singapore, 1998.
(2) Bilenky, S. M. Proc. Math. Phys. Eng. Sci. R. Soc. London 2004, 460, 403-443.
(3) Simpson, J. J. Nuovo Cimento Della Societa Italiana Di Fisica B 2002, 117, 1227-1236.
(4) Alberico, W. M.; Bilenky, S. M. Physics Part. Nucl. 2004, 35, 297-323. (5) Bellerive, A. Int. J. Mod. Phys. A 2004, 19, 1167-1179.
(6) Danilov, D.; DeVoe, R.; Dolgolenko, A.; Giannini, G.; Gratta, G.; Picchi, P.; Piepke, A.; Pietropaolo, F.; Vogel, P.; Vuilleumier, J. L.; Wang, Y. F.; Zeldovich, O. Phys. Lett. B 2000, 480, 12-18.
(7) Piepke, A., personal communication, University of Alabama, 2004. (8) Vargas, M. J. Nucl. Instrum. Methods A 1994, 346, 298-305.
(9) Desideri, D.; Meli, M. A.; Roselli, C.; Testa, C.; Boulyga, S. F.; Becker, J. S. Anal, Bioanal, Chem,2002, 374, 1091-1095.
(10) Weber, R.; Esterland, R. A.; Patzelt, P. Appl. Radiat. Isot, 1999, 50, 929-934.
(11) Zikovsky, L. Radioact. Radiochem. 1994, 5, 22-25.
(12) Khorfan, A.; Wahoud, A.; Rafool, W. J. Radioanal. Nucl. Chem. 2003, 257, 313-316.
(13) Tzortzis, M.; Tsertos, H.; Christofides, S.; Christodoulides, G. Radiat. Meas.
2003, 37, 221-229.
(14) Kitamura, K. J. Radioanal. Nucl. Chem. 1997, 217, 175-178. (15) Byrne, A. R.; Benedik, L. Anal. Chem. 1997, 69, 996-999.
(16) Zarki, R.; Elyahyaoui, A.; Chiadli, A. Radiochim. Acta 2004, 92, 161-169. (17) Zikovsky, L. J. Radioanal. Nucl. Chem. 2004, 260, 219-220.
(18) Ohde, S.; Hossain, M. M. M.; Ozaki, H.; Masuzawa, T. J. Radioanal. Nucl. Chem.2003, 258, 275-280.
(19) Carter, H. E.; Warwick, P.; Cobb, J.; Longworth, G. Analyst 1999, 124, 271-274.
(20) Chai, J.; Oura, Y.; Ebihara, M. J. Radioanal. Nucl. Chem. 2003, 255, 471-475.
(21) Chou, C. L.; Moffatt, J. D. Fresenius J. Anal. Chem. 2000, 368, 59-61. (22) Eroglu, A. E.; McLeod, C. W.; Leonard, K. S.; McCubbin, D. Spectrochim.
Acta, Part B1998, 53, 1221-1233.
(23) Lozano, J. C.; Fernandez, F.; Gomez, J. M. G. Appl. Radiat. Isot. 1999, 50, 475-477.
Anal. Chem.2005,77,2432-2436
liquid extraction,24-26and distillation27have been frequently used
for this purpose. However, these techniques often give rise to additional analytical problems, including contamination during sample pretreatment, increased blank levels (consequently, a deterioration of the detection limits), and an increase in the time necessary for an analysis.
Our laboratory was approached by a consortium of analysts associated with the EXO project to aid in the selection of a suitable source of high-purity lead. Of direct interest was the quantitation of U and Th. For this purpose, an ICPMS approach was selected, in combination with matrix separation. This is the first such study to address the determination of ultratrace Th and U in high-purity Pb using mass spectrometry. The only alternative techniques available are radioassay approaches, which do not possess the required detection power.
Direct analysis of solid samples can be advantageously performed without chemical sample preparation by glow discharge mass spectrometry (GD-MS)28,29wherein the sample functions as
the cathode of the discharge making this approach particularly suitable for the analysis of high-purity metals. In this study, both GD-MS and ICPMS were used in an effort to screen submitted lead samples for their suitability for use in the EXO detection system.
EXPERIMENTAL SECTION
Instrumentation. An ELAN DRC II ICPMS (Perkin-Elmer
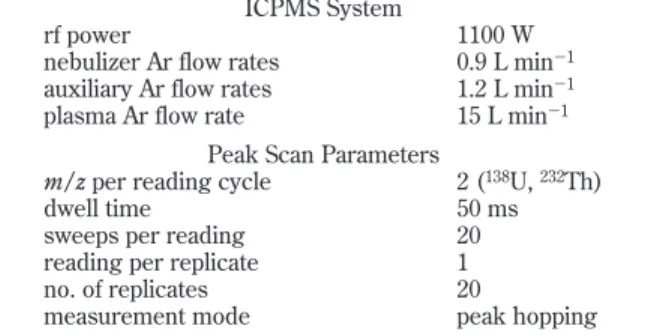
Sciex, Shelton, CT) equipped with a cyclonic glass spray chamber and a pneumatic nebulizer (Meinhard) was used in this work. The instrument was operated in standard mode, in that no alternate gas was added to the reaction cell as no significant interference was found in the measurement of U and Th intensities. Operating parameters are summarized in Table 1. Tygon sample tubing was used thoroughout.
A VG 9000 glow discharge mass spectrometer (Thermo Electron Corp.) was used for the direct analyses of the solid lead samples. The instrument relies on a dc glow discharge ion source coupled to a high-resolution magnetic sector analyzer in reverse
Nier Johnson geometry with electron multiplier detection at nominal 3000 resolution.
Reagents and Solutions. All acids used for the dissolution
and separation procedures were of super analytical grade (TAMA Pure AA-100, Tama Chemical Inc.). High-purity deionized water (DDW) was produced by reverse osmosis followed by a deion-ization (Barnstead/Thermolyne, Dubuque, IA) to yield 18 MΩ cm resistivity.
Stock solutions (1000 mg L-1) of Th and U were prepared by
dissolution of appropriate masses of the respective nitrate salts. UTEVA resin (Eichrom Industries, Inc., Darien IL), both free resin and prepacked beds, was used for extraction chromatography. Oxalic acid (purity 99.5%) and hydrogen peroxide solution (30%) were obtained from Anachemia and Sigma-Aldrich, respectively. Bottles were cleaned in 25% HNO3baths for at least 24 h.
Beakers were filled with 25% HNO3solution, covered with a watch
glass, and heated to ∼60°C for at least 24 h. At the end of the cleaning cycle, the cleaning solution was discharged and bottles and beakers were rinsed three times with high-purity deionized water. All sample digestion and cleaning procedures were con-ducted in a class 100 clean room; separations were undertaken in a class 10 fume hood.
High-purity Pb samples were provided by the consortium of researchers associated with the EXO project. NIST SRM 1566b Oyster Tissue (Gaithersburg, MD) was used for verifying the accuracy of the proposed method.
Procedure: Sample Preparation for ICPMS Analysis. Digestion. Prior to digestion of the lead sample, a surface cleaning
with nitric acid was performed. Following this, an approximate 1-g subsample was dissolved using 20 mL of high-purity nitric acid followed by evaporation of the solution to near dryness with subsequent reconstitution to 30 mL with 3 M nitric acid.
Separation. The UTEVA resin used in this study consists of a
diamyl amylphosphonate extractant adsorbed onto an inert poly-acrylamide support consisting of particles having an external diameter of 100-150 µm. Both prepacked and freshly prepared resins loaded into chromatographic columns with a bed volume of 2 mL were used.
The columns were prewashed before use with 3-fold alternating additions of 10 mL of 0.02 M HCl, 30 mL of 0.5 M oxalic acid, and 10 mL of DDW and were then conditioned with 10 mL of 3 M HNO3. The sample solution (30 mL) was then passed through
the column to extract uranium and thorium, followed by a 10 mL 3 M HNO3wash.According to Horwitz et al.,30this latter step is
necessary to remove most matrix constituents while allowing complete recovery of uranium. A 5 mL volume of 9 M HCl was then added to the columns to convert the resin to the chloride form. The U fraction was eluted with 15 mL of 0.02 M HCl and the Th fraction subsequently eluted with 30 mL of 0.5 M oxalic acid. Both fractions were evaporated to near dryness; the thorium fraction was decomposed with 24 mL of a mixture of concentrated HNO3/30% H2O2(1:1) and reconstituted to 2 mL with 0.5% nitric
acid. These solutions were analyzed using ICPMS with continuous sample introduction. All means and corresponding standard deviations were calculated from results of 3-5 analyses. Correc-tions for nonquantitative recovery were performed on all results.
(24) Becker, J. S.; Dietze, H. J. J. Anal. At. Spectrom. 1998, 13, 1057-1063. (25) Becker, J. S.; Kerl, W.; Dietze, H. J. Anal. Chim. Acta 1999, 387, 145-154. (26) Tagami, K.; Uchida, S. J. Radioanal. Nucl. Chem. 1995, 197, 409-416. (27) Vijayalakshmi, S.; Prabhu, R. K.; Mahalingam, T. R.; Mathews, C. K. At.
Spectrosc.1992, 13, 61-66.
(28) Mykytiuk, A. P.; Semeniuk, P.; Berman, S. Spectrochim. Acta Rev. 1990, 13, 1-10.
(29) Winchester, M. R.; Payling, R. Spectrochim. Acta, Part B 2004, 59, 607-666.
(30) Horwitz, E. P.; Dietz, M. L.; Chiarizia, R.; Diamond, H.; A. M., E.; Graczyk, D. Anal. Chim. Acta 1992, 266, 25-37.
Table 1. ICPMS Operating Conditions
ICPMS System
rf power 1100 W
nebulizer Ar flow rates 0.9 L min-1
auxiliary Ar flow rates 1.2 L min-1
plasma Ar flow rate 15 L min-1
Peak Scan Parameters
m/z per reading cycle 2 (138U,232Th)
dwell time 50 ms
sweeps per reading 20 reading per replicate 1 no. of replicates 20
measurement mode peak hopping
Procedure: Sample Preparation for GD-MS Analyses.
Solid samples are used in the GD-MS source. Test portions of the samples were prepared by cutting pins of approximately 2.5 × 2.5 × 20 mm and subjecting them to a careful surface leach in dilute ultrapure nitric acid. Following a rinse with ultrapure water, the samples were permitted to air-dry in a laminar flow class 100 clean bench, where they were subsequently mounted into the dc ion source. Once under vacuum and then Ar purged, the glow discharge was ignited and any surface contamination on the test samples was removed by a 30-min preburn in the plasma before data acquisition was initiated. Typically, 300 mass spectral scans were acquired, wherein each consists of a 50-ms dwell or integration time. The GD-MS instrument was calibrated with the use of a variety of reference materials used to establish relative sensitivity factors28to provide semiquantitative analysis, results
of which are deemed to be (conservatively) within a factor of 2 of the real value of the concentration of the measurand.
RESULTS AND DISCUSSION
The ICPMS operating parameters were selected to maximize sensitivity for U and Th while maintaining precision (i.e., optimum detection limit). No significant changes in day-to day instrument sensitivity were encountered during this investigation.
Chromatographic Separation. Sorption. According to
Hor-witz et al.,30the capacity factor, k′, (i.e., the number of free column
volumes to peak maximum) for U (VI) using UTEVA resin remains high over a wide range of nitric acid concentrations (from 1 to 6 M), suggesting that the resin efficiently sorbs uranium. These authors also showed that the behavior of Th roughly parallels that of U(VI), although at any given acidity, k′for thorium is typically a factor of 2-5 less than for U. They also showed that, under such conditions, Pb is not retained by the UTEVA column. About 98% of the Pb can be removed using 2 M HNO3.
A solution containing 10 µg g-1Pb, 1 ng g-1U, and 1 ng g-1
Th in 3 M HNO3was loaded onto the UTEVA resin and the eluate
analyzed. Both Th and U were efficiently adsorbed (∼100%) onto the column whereas Pb was effectively washed through (∼90%). The remaining Pb was removed when passing 10 mL of 3 M HNO3
through the UTEVA resin prior to elution of U and Th. It was verified that the concentration of residual Pb in the U and Th eluants was less than 1 ppm in all cases and presented no problems with respect to spectral interferences.
Elution. Both U and Th exhibit significantly smaller capacity
factors in dilute HCl, which permits complete elution of both elements using this acid.30The capacity factor for Th in 0.025 M
HCl is ∼50-fold lower than that for U, indicating that Th should be easier to remove from the resin than U.30 Although it was
verified that U could be easily eluted using 0.025 M HCl, thorium was not recovered. Carter et al.19were able to remove Th using
even higher HCl concentrations (for which higher capacity factors should exist), although they worked with ppm concentrations of the analyte. Extrapolation of their results to the ppt level may not be valid.
Thorium could be recovered using a 0.5% solution of oxalic acid. Figure 1 shows the elution profiles for U and Th using 0.02 M HCl and oxalic acid. About 80% of the U loaded could be recovered in the first 15 mL of 0.02 M HCl eluant while the remaining was recovered in the oxalic acid fraction. Approximately 60% of added Th was recovered in the first 30 mL of oxalic acid eluant. It should be noted that the oxalic acid fraction must be decomposed prior to analysis by ICPMS. This was achieved by adding 24 mL of a mixture of concentrated HNO3/30% H2O2(1:
1), evaporating to near dryness, and reconstituting to 2 mL with 0.5% nitric acid prior to sample introduction.
Care must be taken when evaporating the oxalic acid fraction as Th tends to adsorb to the vessel walls, leading to low recovery. The Th fraction should not be evaporated to dryness, otherwise recovery decreases substantially. Both Pyrex and Teflon vessels were evaluated for use in this step. Evaporation to dryness in a Pyrex beaker results in at least a 30% loss of Th, depending on the heating time. No loss of Th is observed when evaporation occurs in a Teflon beaker unless the solution goes to dryness, for which the Th losses are similar to those in Pyrex. Under optimized conditions, the RSD for recovery of the Th fraction is ∼10% using a 10 ppt solution of Th.
Prepacked versus Freshly Prepared Columns. Both
pre-packed and freshly prepared UTEVA columns were examined. Improved recovery, especially for Th, was obtained when freshly prepared UTEVA columns were used.
For U, the recovery decreases from 100 to ∼80% (summing both the HCl and oxalic acid fractions) when prepacked columns are used. For Th, the loss is more severe; when using the prepacked column, almost no Th is recovered. To study this
behavior, a portion of the UTEVA resin was kept as a slurry (in water). After a week, recoveries were again evaluated and a significant decrease noted, especially for Th. To our knowledge, this observation has not been reported in the literature addressing UTEVA resin. However, similar behavior has been noted when prepacked TEVA resins are used for Th.31
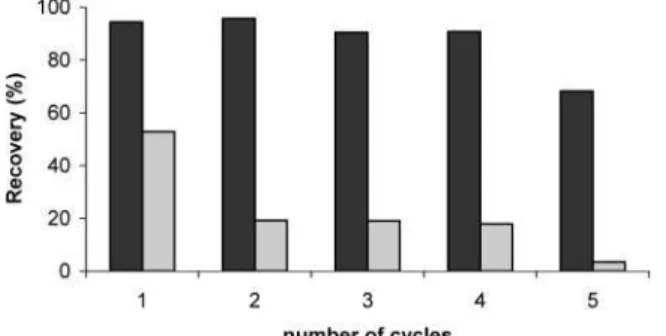
Recovery for Th decreased when a freshly prepared UTEVA column was used more than once (Figure 2). A column could be used up to four times before a significant decrease in recovery of U occurred. Thus, to obtain accurate results, freshly prepared UTEVA columns were used for all determinations of Th and U. An attempt was made to reduce the amount of UTEVA resin used and, consequently, the volume of acids required for elution, but recovery decreased as the mass of UTEVA decreased, especially when larger sample volumes were processed.
Figures of Merit and Method Validation. Analytical figures
of merit were obtained under optimum conditions and are summarized in Table 2. Detection limits were calculated based on a 3σ criterion, where σ is the estimated standard deviation of the results for at least 10 repetitive measurements of processed blanks.
Blanks included all reagents and were run in parallel with samples. To avoid memory effects from the resin, especially for Th, a column was used only once.
The estimated procedural LODs for the determination of U and Th are 0.5 and 1.5 pg g-1in the solid, respectively. These
values are based on solubilization of 1-g subsamples in 30 mL of acid followed by their passage through the resin column and reconstitution to 2 mL. The procedural detection limit for U by ICPMS is lower than that for Th due to lower blank values in the processing reagents.
Higher blank values were obtained in the oxalic acid fraction, although this contamination arises mainly from the resins. For
example, the concentration of Th in new resin is ∼8 pg g-1, and
despite several alternate washings with HCl, oxalic acid, and DDW, the resin continues to produce a high blank (∼1.7 pg g-1).
Additionally, bleeding of the organic extractants from the columns into the Th fraction was observed, necessitating its destruction by digestion with hot concentrated HNO3 and H2O2, thereby
further elevating the blank.
A severe memory effect was also present for Th, as this element tends to adhere to the internal components of the ICPMS (walls of the pump tubing, spray chamber, and sampler cone). Washing the system between samples or standards is thus necessary. When a 5% (v/v) nitric acid solution was used, the system washout time was typically 5-10 min after reading samples having Th concentrations lower than 10 pg g-1. This can also
contribute to the higher detection limit obtained for Th. For a 1 ng g-1solution of Th and U, ∼45 min was needed to completely
wash the system to a level equivalent to the working blank signal. The reason for the extended washout time was determined to be adsorption of Th and U onto the walls of the Tygon pump tubing followed by their slow release into the wash solution. When introducing a 1 ng g-1solution, wash times could be reduced from
45 min to 5 by simply replacing the pump tubing or using self-aspiration through a short Teflon line.
Recovery experiments were performed by comparing the response obtained from spikes of known amounts of both uranium and thorium added to Pb samples (prior to or after the digestion procedure) with those obtained from deionized water calibration standards. An 80% recovery of uranium was obtained for samples spiked both prior to or after the digestion procedure, showing that U losses occur during the column separation procedure. Complete recovery of U could be achieved with a further elution with oxalic acid (see Figure 1), but in this case, poorer detection limits (at least 2-fold) were achieved due to high blank values arising from the oxalic acid fraction. Thus, to get better detection limits, only the HCl fraction was used and a recovery factor was applied to correct the data for nonquantitative elution.
On the other hand, poorer recovery (typically 60%) was obtained for thorium. The source of these losses, as stated earlier, is irreversible adsorption onto the resin (which was only used once for each sample) and partial loss to the walls of the vessel used for solution evaporation. Similarly to U, a correction to the result for nonquantitative recovery was performed. Note that recovery studies were made at different concentrations ranging from low-ppt to ppb levels and they showed the same behavior. To our knowledge, there is no CRM available for determination of ultratrace concentrations of U and Th in high-purity Pb. The accuracy of the method was therefore evaluated by analyzing NIST SRM 1566b Oyster Tissue. For this, a nominal 0.25-g sample was accurately weighed into a Teflon digestion vessel (CEM type) and 7 mL of HNO3was added. The vessel was capped, and the sample
was digested using microwave heating at a pressure of 120 psi for 30 min. The digested material was then cooled and diluted to 37 mL with deionized water. Blanks were also prepared in conjunction with both digestion procedures by subjecting all reagents to identical manipulations described for the samples.
Although the digestion procedure used for this CRM was different from that used for the Pb samples, the same column separation procedure was applied. Sample volumes of 7 mL were
(31) Thakkar, A. H. http://www.eichrom.com/analytical/radio/meet/2004/pow-erpoint/workhop_2004_charleston_files/frame.htm, Eichrom Technologies, Inc. 2004.
Figure 2. Effect of reuse of prepared UTEVA columns on recovery
of (9) U and (gray box) Th. Table 2. Figures of Merit
U Th
detection limit (pg g-1) 0.1 0.1
procedural detection limit (pg g-1) 0.5 1.5
procedural blank (pg g-1)
HCl 0.02 M fraction 0.15 0.3
oxalic acid 1.2 1.7
recovery (%) 80 ( 3 60 ( 4
used for the separation procedure. A calibration curve, prepared from standards in DDW as well as a standard additions curve, for which the standards were added to the sample before the column separation was applied, was examined. Results, summarized in Table 3, are based on three samples with three replicates per sample.
Good agreement with the reference value was found for U using both an external calibration curve and the method of additions. For Th, a low result (∼60% lower than the certified value) was obtained when the external calibration curve was used. We believe this to be a result of losses of Th due to irreversible adsorption onto the resin and partial loss to the walls of the vessel used for solution evaporations. When a standard additions calibra-tion was used, this problem was overcome since the sample was spiked prior to the column separation and good agreement was found with the certified value.
Analytical Results. Two Pb samples were identified by the
EXO staff as being of most interest and were analyzed using the described method. For comparison, these same samples were also analyzed by GD-MS (based on data collected over 300 spectral scans). Results are summarized in Table 4.
The U and Th concentrations in both samples are below the detection limits for all techniques, although lowest detection limits can be achieved using ICPMS.
γ-Counting data for both samples were provided by A. Piepke;
U values are < 7.4 and <5.4 pg g-1 for samples 1 and 2,
respectively, and Th values are <16.2 and < 2.4 pg g-1for samples
1 and 2, respectively, consistent with results obtained in this study.
It should be noted that, for GD-MS data, the higher concentra-tion reported for U in sample 1 is due to a higher S content present in this sample (21 µg g-1versus 1 ng g-1for sample 2). As a
consequence of the interference of PbS on U, detection limits are elevated for this sample.
CONCLUSION
Extraction chromatography combined with ICPMS detection provided a method for the determination of U and Th at sub-ppt levels in high-purity Pb samples. Enhanced detection limits, relatively simple sample preparation, and rapid analysis time are achieved. The required target concentration for U in high-purity Pb samples could be met, but this was not the case for Th due to limitations imposed by contamination (procedure and resin) as well as memory effects. ICPMS provides a complimentary ap-proach to the analysis of high-purity lead for these elements. Detection limits are improved by ∼10-fold for U over GD-MS and γ-counting techniques whereas those for Th are comparable. The more laborious and potentially contamination prone procedure required for ICPMS, however, offsets its attractive attributes of high sample throughput and detection power.
ACKNOWLEDGMENT
The authors are grateful to A. G. Piepke (University of Alabama) and C. Hargrove (Carleton University) for the invitation to participate in this stage of the EXO project, and for providing the Pb samples and Eichron resins. A. Mytytuik is thanked for GD-MS data and A. G. Piepke for γ-counting results. P.G. thanks the NSERC postdoctoral fellowship program for financial support.
Received for review October 1, 2004. Accepted January 20, 2005.
AC048539T
Table 3. Analytical Results
determinedb(mg kg-1)
element
certified valuea
(mg kg-1) calibration curvemethod standard additionmethod
Th 0.0367( 0.0043 0.0227 ( 0.0015 0.0323 ( 0.0019 Uc 0.2550( 0.0014 0.2522 ( 0.0027 0.2528 ( 0.0030
aUncertainty reflects 95% confidence interval.bMean and sample
standard deviation (n ) 3).cReference concentration value only.
Table 4. Analysis of Samples (Results in pg.g-1)
ICPMS GD-MS
sample U Th U Th
1 <0.5 <1.5 <20 <9.0 2 <0.5 <1.5 <4.0 <4.0