Sensitivity of PM<sub>2.5</sub> to climate in the Eastern U.S.: a modeling case study
40
0
0
Texte intégral
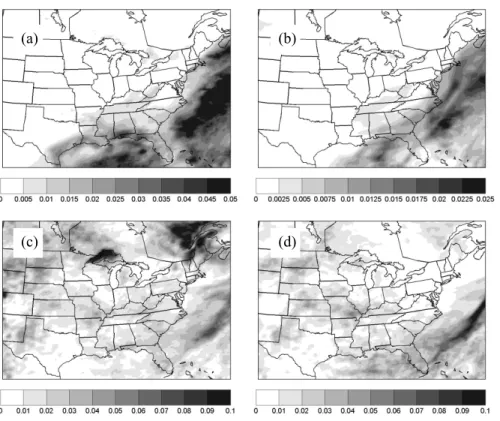
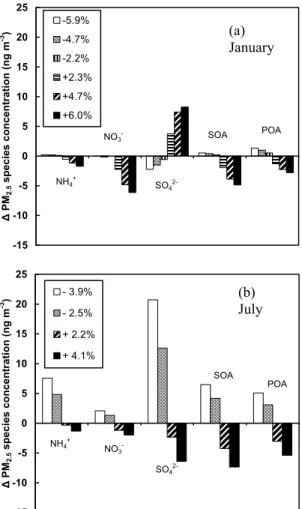
Figure
+7
Documents relatifs
