Follow-up of the Swiss Cohort Study on Air Pollution
and Lung Diseases in Adults (SAPALDIA 2) 1991–2003:
methods and characterization of participants
Submitted: 13 July 2004 Accepted: 23 February 2005 Published Online First: 21 July 2005
Margaret W. Gerbase5, Medea Imboden2, Roland Keller6, Bruno Knöpfli7,
Nino Künzli8, Laurent Nicod9, Marco Pons10, Patricia Staedele1, Jean-Marie
Tschopp11, Jean-Pierre Zellweger12, Philippe Leuenberger12and SAPALDIA team* + Equal contribution
1Institute of Social and Preventive Medicine, University of Basel, Switzerland
2Molecular Epidemiology/Cancer Registry, Institute of Social and Preventive Medicine/Dept.
of Pathology, University of Zürich, Switzerland
3Zürcher Höhenklinik, Wald, Switzerland
4Dept of Pulmonology, University Hospital Basel, Switzerland 5Pulmonology Service, University Hospital of Geneva, Switzerland 6Lung Clinic at Schachen, Aarau, Switzerland
7Alpine Children’s Hospital, Davos, Switzerland
8Division of Occupational and Environmental Health, University of Southern California,
United States of America
9Pulmonology Service, “Inselspital” Bern, Switzerland 10Pulmonology Service, Hospital of Lugano, Switzerland 11Centre Valaisan de Pneumologie, Montana, Switzerland
12Service of Pulmonology, University Hospital of Lausanne, CHUV, Switzerland
Soz.- Präventivmed. 50 ( 2005) 245 – 263 0303-8408/05/040245–19 DOI 10.1007/s00038-005-4075-5 * SAPALDIA Team Senior scientific team
(a) allergology, (c) cardiology, (cc) clinical chemistry, (e) epi-demiology, (exp) exposure, (g) genetic and molecular biology, (m) meteorology, (p) pneumology, (s) statistics.
Ph. Leuenberger (p) co-dir and U. Ackermann-Liebrich (e) co-dir J.C. Barthélémy (c), W. Berger (g), R. Bettschart (p), A. Bircher (a), K. Blaser (a), G. Bolognini (p), O. Brändli (p), M. Brutsche (p), L. Burdet (p), S. Downs (e/s), M. Frey (p), J.M. Gaspoz (c), M. Ger-base (p), D. Gold (e/c/p), W. Karrer (p), R. Keller (p), B. Knöpfli (p), N. Künzli (e/exp), A. Morabia (e), U. Neu (exp), L. Nicod (p), A.P. Perruchoud (p), M. Pons (p), N. Probst Hensch (g), Th. Rochat (p), E. Russi (p), C. Schindler (s), P. Schmid-Grendelmeyer (a), J. Schwartz (e), F. Schwarz (p), P. Straehl (exp), J.M. Tschopp (p), A. von Eckardstein, J.P. Zellweger (p), E. Zemp Stutz (e).
Scientific team at coordinating centers
L. Bayer-Oglesby (exp), D. Felber Dietrich (c), M. Imboden (g), D. Keidel (s), B. Kuna-Dibbert (e), P. Städele-Kessler (s), M. Ger-base (p), C. Quinto (e).
Scientific team at local study sites
C. Burrus, D. Felber Dietrich, U. Egermann, M. Gerbase, R. Gimmi, A. Kick, N. Lutz.
Research support
Research support provided by the National Science Founda-tion of Switzerland (grant no. 32-65896.01, NF 32-58996.99 (for Basel preparations) 32-54996.98, NF 32-54996.98 (Prosper Nicole Probst), NF 3233-048922.96 (Prosper Nino Künzli) and NF 32-32450.92 (Prosper Elisabeth Zemp), the Federal Office for Forest, Environment and Landscape, the Federal Office of Public Health, the Federal Office of Roads and Transport, the Cantons Basel-Stadt, Basel-Land, Geneva, Zurich, Ticino, Aargau, Luzern, the Swiss Lung League and the Lung League of Ticino, Zurich and Basel Stadt/Basel Landschaft.
SAPALDIA Basel is part of Ethics I and II
Ethics
Ethical approval for the study was given by the Overall Regio-nal Ethics Commission for Clinical Medicine (Swiss Academy of Medical Sciences) and each centres’ regional ethics committee.
Summary
Objectives: The Swiss Cohort Study on Air Pollution and Lung
Diseases in Adults (SAPALDIA) was designed to investigate the health effects from long-term exposure to air pollution.
Methods: The health assessment at recruitment (1991) and at
the first reassessment (2001–3) consisted of an interview about respiratory health, occupational and other exposures, spirome-try, a methacholine bronchial challenge test, end-expiratory car-bon monoxide (CO) measurement and measurement for atopy. A bio bank for DNA and blood markers was established. Heart rate variability was measured using a 24-hour ECG (Holter) in a random sample of participants aged 50 years and older. Con-centrations of nitrogen dioxide (NO2), sulphur dioxide (SO2), ozone (O3) and particulates in ambient air have been monitored in all study areas since 1991. Residential histories collected over the 11 year follow-up period coupled with GIS modelling will provide individual long-term air pollutant exposure estimates.
Results: Of 9 651 participants examined in 1991, 8 715 could be
traced for the cohort study and 283 died. Basic information about health status was obtained for 8 047 individuals (86 % of alive persons), 6 528 individuals (70 %) agreed to the health ex-amination and 5 973 subjects (62 %) completed the entire pro-tocol. Non-participants in the reassessment were on average younger than participants and more likely to have been smok-ers and to have reported respiratory symptoms in the first as-sessment. Average weight had increased by 5.5 kg in 11 years and 28 % of smokers in 1991 had quit by the time of the re-assessment.
Keywords: Cohort study – Longitudinal study – Adults – Chronic disease – Air pollution.
The most powerful approach for studying long-term effects from ambient air pollution on health is the long-term prospective follow-up of well-defined population-based co-horts with well-characterized air pollution exposure infor-mation (European Science Foundation 1998). There are currently only five cohort studies in adults, with published results, that address the long-term impact of air pollution (Abbey et al. 1999; Dockery et al. 1993; Finkelstein et al. 2004; Hoek et al. 2002; Pope et al. 2002; 1995). All studies but one are based in the US and three of them (Dockery et al. 1993; Hoek et al. 2002; Pope et al. 2002), have only pub-lished findings related to mortality. The relation of long-term exposure to air pollution with respiratory and cardio-vascular health and morbidity has yet to be measured in a large prospective cohort study in Europe. The large Euro-pean Community Respiratory Health Survey (ECRHS)
de-signed to measure natural history and risk factors for respi-ratory diseases (particularly asthma and allergy) across Europe has recently included air pollution exposure assess-ment in its protocol (Burney et al. 1994; Hazenkamp-von Arx et al. 2004). However, the Swiss Cohort Study on Air Pollution and Lung Diseases in Adults (SAPALDIA) is the only prospective cohort study of respiratory and cardio-vascular health in adults in Europe with detailed individual residential exposure histories as a key element of the assess-ment of effects from long-term exposure to air pollution. The SAPALDIA cohort is a random population sample of 9 561 adults recruited and examined in 1991 (for detailed description of methods see (Martin et al. 1997)). There were extensive health examinations, a detailed assessment of personal risk factors, assessment of average exposure to the pollutants O3, NO2, SO2and PM10in ambient air and
assess-ment of individual exposure to NO2. Findings from the study
showed effects from passive smoking exposure on respira-tory symptoms (Leuenberger et al. 1994) and from air pol-lutant on lung function and symptoms (Ackermann-Liebrich et al. 1997; Künzli et al. 2000; Schindler et al. 1998; 2001; Zemp et al. 1999) and from occupational exposure and atopy on bronchial responsiveness (Leuenberger et al. 2000; Schwartz et al. 2002). References values from lung function (Brändli et al. 1996; 2000) and the prevalence of atopy and allergic symptoms have been described (Strupler et al. 1997; Wüthrich et al. 1995; 1996; 1999).
Monitoring of air pollutants, meteorology and pollen has been conducted in all study areas since 1991. Regular mailings to the 9 651 original participants has ensured that changes in residential address and deaths (n = 283) amongst participants since 1991 have been updated. Of the surviving 9 368 participants, 93 % (8 715) could be traced between 2001–2003. This paper describes the health examinations, the bio bank, the environmental monitoring, and the assess-ment of air pollution exposure and basic characteristics of the participants in SAPALDIA 2.
Methods
The milestones of the SAPALDIA study (1991–2001)
The eight study areas (Geneva, Basel, Lugano, Aarau, Wald, Payerne, Davos, Montana) were chosen to represent the variety of environmental conditions in respect to geography, climate, degree of urbanisation and air pollution in Switzer-land. From the local registries of inhabitants of these areas random population samples of persons aged 18–60 years, who had been residents in the respective area for at least three years, were then drawn (Martin et al. 1997).
Soz.- Präventivmed. 50 ( 2005) 245 – 263
Health examinations were conducted at the eight local cen-tres over the course of one year in 1991 and repeated in 2002. Detailed description of the 1991 examinations can be found elsewhere (Martin et al. 1997).
Contact with the 9 651 participants of SAPALDIA 1 (in-cluding monitoring of mortality) has been facilitated by regular mailings and updates every 1.5 years through the information collected from participants by mail or from local registries of inhabitants. The residential history data-base was checked at the local registries in all study areas in 1998 and 1999.
Recruitment for the SAPALDIA follow-up (2001–2003)
Extensive efforts were made to contact all original partici-pants of SAPALDIA 1 for the follow-up examination in SAPALDIA 2. A letter of invitation describing the health examinations, was sent to all former participants who could be traced. The letter contained a screening questionnaire (with 13 questions about respiratory symptoms, smoking,
date of birth and address) and a prepaid addressed envelope for the return of the response to the local study centre. Up to three letters were sent and up to 12 telephone calls made (at different times during the day including morning, noon, evening and weekends) in an attempt to contact the non-responders. In non-responding subjects without telephone number, SAPALDIA personnel made home visits. If all attempts to make contact failed; the subject was considered to be untraceable (n = 653, 6.8 %).
The protocols for SAPALDIA and the European Com-munity Respiratory Health Survey (ECRHS) (Burney et al. 1994) are similar (Tab. 1) and participants from the SAPALDIA Basle centre aged 18–44 in 1991 are also par-ticipants in the ECRHS study.
Since ECRHS II was initiated slightly in advance of SAPALDIA 2, examinations at the Basle centre preceded those in other SAPALDIA centres. Examinations in Basle were started in July 2001, and between October 2001 and January 2002 in the other centres (Aarau, Davos, Geneva,
Map of Switzerland and of the eight study areas
Lugano, Montana, Payerne, Wald). Examinations in all cen-tres were completed by the end of February 2003.
Informed consent
Ethical approval for SAPALDIA 2 was given by the central ethics committee of the Swiss Academy of Medical Sciences and the Cantonal Ethics Committees for each of the eight examination areas. The consent information provided to participants described the health examination including the bronchial challenge, the ambulatory electrocardiogram (ECG) and blood collection. Additionally there was infor-mation about data protection and the genetic assessments. Participants were required to give written consent before any part of the health examination was conducted and were provided with written consent information to read and were given the opportunity to ask questions about the examina-tion. Subjects could either give global consent (for all health examinations) or agree to each investigation separately.
Documentation
All study documentation, including questionnaires and pro-tocols, was provided in German, French and Italian because native languages differed between SAPALDIA centres. Documents were usually conceived in German or English and then translated in French and Italian. Translations were cross-checked in simultaneous readings with SAPALDIA
research personnel who were native speakers of the respec-tive languages and fluent in at least one of the other lan-guages. This procedure had already been used in 1991 and at that time back-translations were also used for validation. As the majority of questionnaires were already available in the three languages, back-translations were unnecessary in SAPALDIA 2.
Interview administered main questionnaire
The interview was conducted by a trained fieldworker and answers from the participant were entered directly into an Access database on a personal computer. As in SAPALDIA 1, the interview included questions about his-tory of respirahis-tory symptoms, allergic diseases, general health, living and working environment, smoking habits, exposure to traffic, exposure to environmental tobacco smoke and animals. In SAPALDIA 2 the questionnaire was extended with additional questions about chronic diseases, including heart disease, questions about dietary habits (adapted from the Swiss Health Questionnaire (Bundesamt für Statistik 2001/2004), physical activity (derived from the ECRHS II- and the Swiss Health Questionnaire) and sleepi-ness (derived from the Epworth Sleepisleepi-ness Scale (Johns 1991)). Present and past medication use was recorded in detail; including type, dose, start date of medication use and duration.
Table 1 Comparison of assessments in SAPALDIA and ECRHS
SAPALDIA SAPALDIA ECRHS
Cross-sectional 1991 Follow-up 2001–2003 Follow-up 2001
Questionnaires
PC based interview yes yes yes
Paper questionnaires:
– SF36, quality of life no yes yes
– JuniperAsthma quality of life no yes yes
– Occupational exposure no yes yes
– Women’s questionnaire no yes yes (some centres)
Lung parameter assessment
Spirometry yes yes yes
Bronchochallenge yes yes yes
End-expiratory CO yes yes no
Cardiovascular assessments
Blood pressure no yes no
Ambulatory ECG no yes no
Assessment of allergy
Skin prick test yes no no
Blood markers (IgE) yes yes yes
Assessment of genetic factors
Blood for DNA isolation no yes yes
Assessment of genotypes no yes yes (some centers)
Assessment of other risk factors in blood
Cardiovascular risk factors no yes no
Soz.- Präventivmed. 50 ( 2005) 245 – 263
Additional questionnaires administered included the Qual-ity of life (SF36) questionnaire (Ware 1994), the Juniper Asthma quality of life questionnaire (Juniper et al. 1993) (given to the subjects who had answered “yes” to the tion: “Have you ever had asthma?”) and a women’s ques-tionnaire (with questions about menstruation, menopausal status and intake of hormones) (Tab. 1 and 3a). In addition, a card was handed to all pmenopausal women with the re-quest to send the card back with the date that their next menstrual cycle commenced in order to determine their hormonal status at the time of health examination. A job exposure matrix (Kennedy et al. 2000) was used to assess occupational exposures since SAPALDIA 1. Participants who had worked as cleaners (in a job and at home), nurses, metal workers, solderers, welders and participants who had worked with disinfectants were also asked to complete an occupational questionnaire specific to the occupational acti-vity or exposure. Participants also completed an address/ ZIP code table indicating residential location(s) for the period of 1991–2001.
The computer-based interview took on average 45 minutes per participant. If participants were unable or unwilling to come to the examination centre, one of two shorter ques-tionnaires were administered over the telephone. The short questionnaire contained a selection of 64 questions from the main interview about respiratory symptoms and medica-tion, chronic diseases, current occupamedica-tion, exposure to traf-fic, active and passive smoking and emergency visits at the hospital. The ultra-short questionnaire comprised 32 ques-tions about respiratory symptoms, medication, current occu-pation, exposure to traffic, active and passive smoking. The following definitions based on answers in the main questionnaire are used in Figures 1a and 1b:
Current smoker: Positive answer to the question “Have you
ever smoked for as long as a year?” (“yes” means at least 20 packs of cigarettes or 360 grams of tobacco in a lifetime or at least one cigarette per day or one cigar a week for one year).
Chronic cough: Positive answer to the question “Do you
usually cough during the day, or at night, on most days for as much as three months each years?” and an answer of > 2 to the question “For how many years have you coughed like this?”
Chronic phlegm: Positive answer to the question “Do you
usually bring up phlegm from your chest during the day or at night on most days for as much as three months each years?” and an answer of > 2 to the question “For how many years have you brought up phlegm like this?”
Wheeze: Positive answer to the question “In the last 12
months, have you had wheezing or whistling when you did not have a cold?”
Shortness of breath: Positive answer to the question “Are
you troubled by shortness of breath when hurrying on level ground or walking up a slight hill?”
Chest tightness: Positive answer to the question “In the last
12 months, have you woken up with a feeling of tightness in your chest?”
Blood pressure measurement
Systolic and diastolic blood pressures were measured after the interview and after the participant had sat quietly for at least 10 minutes. Pressures were measured twice with an interval of at least 3 minutes using an automatic OMRON 705 CP (Tokyo, Japan) with the cuff attached to the naked left upper arm.
Collection and fractioning of blood samples
Blood samples were taken from all subjects who had con-sented to the general blood marker analyses and/or the genetic analyses. 45 ml of blood was collected for blood marker analysis into differently coated 9 ml Monovette tubes (SARSTEDT; Nuembrecht, Germany). EDTA-coated tubes were used for collection of blood, plasma and buffy coat, Lithium-Heparin-coated tubes for plasma collection and non-coated tubes for serum collection. With the excep-tion of one EDTA-coated tube, the samples were centri-fuged at room temperature (20 °C, 15 min, 1500 g) using a UNIVERSAL 32 R centrifuge (Hettich AG, Baech, Swit-zerland). Subsequently the fractioned and EDTA-buffered whole blood samples were aliquoted (300 to 500 ml) into 1ml TPP Cryotubes (Trasadingen, Switzerland) and transferred to –80° C immediately. The blood sample collection and frac-tioning procedure was performed within a maximum of four hours. If possible, 40 aliquots were prepared per subject, (corresponding to 3 vials of buffy coat, 3 of EDTA-plasma, 4 of EDTA-buffered whole blood, 10 of Li-He-plasma, and 20 vials of serum). For DNA extraction, 7 ml of whole blood was collected in EDTA-coated Monovette tubes, which were stored without previous centrifugation at – 80 °C.
Constitution of the blood plasma, serum and DNA banks
The samples extracted from blood were stored in eight SANYO freezers (Applewood, ON, Canada) with a storage volume between 519 (U71V) or 728 litres (U50V) that were connected to emergency back-up systems (including an alarm system and/or CO2 backup). After completion of the
data collection phase in spring 2003, all freezers were trans-ported to one location (University Hospital, Geneva) for sample sorting. The blood bank containing about 250 000 blood aliquots was split into two identical banks. For reasons of security and accessibility the two bio banks are now located in two different centres for long-term storage (Uni-versity Hospitals of Geneva and Zurich). During the trans-port, inside freezer temperatures were monitored and did not increase above – 60oC at any time.
The whole blood samples taken for genetic analysis were transferred on dry ice to the laboratory performing the DNA extraction (Departments of Molecular Epidemiology and of Medical Molecular Genetics, University of Zürich). The blood samples were processed manually using the PUREGENETMDNA Purification Kit (GENTRA Systems,
Minneapolis, USA). The observed DNA yields ranged from 7–80 µg of DNA obtained from 1 ml of frozen EDTA-buffered blood.
Quality of genomic DNA was evaluated in terms of DNA degradation visually on 0.8 % agarose gel electrophoresis and in terms of purity by performing standard and allele-specific PCR amplification.
Subsequently, DNA working solutions were generated by diluting the DNA with milli-Q-pure water and concentra-tion was adjusted to 10 ng/µl. Barcode-labelled 2 ml tubes with screw-caps (SARSTEDT; Nuembrecht, Germany) were used to store DNA stock and working solutions. DNA working solutions were kept at –20 °C for long-term and 4 °C for short-term storage. In analogy to the blood specimen bank, the DNA stock solutions were transferred for acces-sibility and security reasons to two locations (Zurich and Geneva).
A computer-based data bank (Excel format) was estab-lished, containing an identification code for each participant, coordinates identifying the location of each type of biologi-cal sample (serum, both type of plasma, buffy coat, whole blood, and DNA), the number of vials present, DNA extrac-tion remarks, concentraextrac-tion and volume of available DNA stock solution, DNA quality characteristics and the location of the diluted DNA working solution.
Weight and height measurements
The participants were asked to remove all heavy clothes such as shoes, jacket, coat etc. For the height assessment, telescopic scales, model 222, from SECA (Hamburg, Ger-many) were used. The scale was permanently fixed unto the wall and the participant was required to make contact to the wall with the backside of his head, the upper back, the rear, the lower legs as well as with his heels during the measurement. An electronic scale (T160-T620-T630) from
TERRAILLON (Bradford, MA, USA) was used for the weight measurements. Weight was displayed digitally in kilograms to one decimal point. The scales were calibrated with standardised weights at regular intervals. The height scales were checked during quality assessment visits.
Carbon monoxide measurement
In order to validate participants answers to smoking habits end-expiratory carbon monoxide (CO) was measured with EC50 Micro-Smokerlyzer, (BEDFONT, Rochester, UK). Participants were asked to first completely exhale, then to inhale fully, to hold their breath for at least 20 seconds and finally exhale completely through the mouthpiece of the measuring device. CO devices were calibrated approxi-mately every six months.
Spirometry
The same spirometers based on an open system using a mass flow anemometer (Sensormedics model 2200, Yorba Linda, USA), meeting American Thoracic Society (ATS) perfor-mance criteria, were used in both SAPALDIA 1 and 2. A quality assessment in 2001 demonstrated that measurement of lung volumes by the eight spirometers were comparable to one another (Kuna-Dibbert et al. 2005). The same spirometry protocol was followed in SAPALDIA 1 and 2 that was identical to the protocol in ECRHS (Künzli et al. 1995). Spirometers were calibrated twice a day using a stan-dardised three litre syringe. Participants performed ma-noeuvres in a sitting position wearing nose clips. At least three and up to maximal eight forced expiratory lung function manoeuvres were performed in order to obtain a minimum of two acceptable results for for both FEV1and
FVC and the forced expiratory flows (FEF25, FEF50, FEF25–75
and FEF75) were recorded from each manoeuvre.
Flow-volume curves and codes indicating compliance with Ameri-can Thoracic Society criteria were displayed on computer screen as each manoeuvre was performed (American Thoracic Society 1995) to assist the technicians in the selec-tion of acceptable manoeuvres. Spirometry technicians were also required to report problems during the test that could affect quality of trials. Expiratory flow measures were taken from the flow-volume curve with the highest sum of FVC and FEV1. As in SAPALDIA 1, all spirometry outputs were
visually screened by respiratory physicians experienced in lung function testing. There were 370 flow-volume curves from 237 participants excluded because of abnormalities that indicated technical problems during the performance of the manoeuvre (Townsend et al. 2004).
Soz.- Präventivmed. 50 ( 2005) 245 – 263
Methacholine bronchial challenge
Non-specific bronchial responsiveness was assessed by bronchial challenge with methacholine chloride in partici-pants able to produce satisfactory spirometry, and who ful-filled health criteria. Participants were excluded if they had had a myocardial infarction in the last 12 months, were tak-ing medication for heart disease, had epilepsy, were preg-nant, were lactating and/or were receiving treatment with any beta blockers including eye drops. The protocol follow-ed in SAPALDIA 2 was identical to that in SAPALDIA 1. Methacholine (PROVOCHOLINE®, Methapharm Inc.,
ON, Canada) was administered by MEFAR aerosol dosime-ters (Anandic Medical Systems, Diessenhofen, CH) starting with inhalation of physiological sodium chloride (NaCl) followed by increasing concentrations of methacholine up to a cumulative dose of 2 mg. The dosimeter was triggered automatically at the beginning of the inhalation and the sub-jects were instructed to hold their breath at full inspiration for four seconds. Between one and two minutes after the end of each inhalation two FEV1manoeuvres were performed
and the manoeuvre with the highest FEV1recorded. The test
was stopped when either the cumulative dose of 2 mg had been reached or FEV1had fallen by 20 % or more compared
to the NaCl baseline value or the participant refused to
con-tinue. A bronchodilator (Salbutamol®, 200 mg) was offered
to participants who experienced a drop in FEV1during the
challenge. Seven new Mefar nebulisers were purchased for SAPALDIA 2. All nebulisers were calibrated in 2001 by the manufacturers in Melbourne Australia. Driving pressures from the Mefar dosimeters were checked periodically at the centres using a manometer. All challenge tests were assessed for compliance with the study protocol.
24 hour Holter electrocardiogram (ECG)
Only participants aged 50 and older were eligible for a 24 hour electrocardiogram (ECG) monitoring with a Holter recorder (Aria, Del Mar Medical Systems, Irvine Califor-nia). Exclusion criteria included having a cardiac pace-maker, having undergone anaesthesia during the previous eight days or having taken anti-arrythmic drugs class I or III or digitalis glycosides within the last 30 days.
The Holter monitor was fitted by placing one of three elec-trodes (Blue Sensor, Medicotest, Stykke, Denmark) 2 cm to the right of processus xiphoideus, another electrode on the left linea medioclavicularis on the lowest rib and the third electrode was located on the left front axillar line on the lowest rib. During the ambulatory ECG monitoring period, participants completed a location and activity diary derived from a diary previously developed for the EXPOLIS study (Jantunen et al. 1998). The SAPALDIA ECG diary
con-tained fields for recording information on the participants whereabouts (indoor, outdoor etc), levels of activity, caf-feine and alcohol use, consumption of tobacco (active and passive) and medication for every 15 minute interval during the monitoring period.
Quality control procedures
Instruction protocols for all methods and parts of the study were prepared in a written form. Fieldworkers participated in a three day training workshop, before the beginning of the study. Each fieldworker was required to test at least 10 volunteers at the centre under supervision before starting to examine participants. Three additional workshops for field-workers were held during the data collection period to assure high data quality. In addition, quality control visits to all eight centres were conducted three times during the ex-amination phase. At each visit at least one full exex-amination was observed and possible improvements were discussed with the fieldworkers. Furthermore, compliance with re-quired standardised operating procedures was checked and oral and written feedback provided. Moreover, differences in the quality between fieldworkers and centres in the con-duct of spirometry were assessed in detail and reported back to the fieldworkers. The quality control visits also offered a platform for feedback from the local teams about the par-ticipation rates and quality of the recorded data received by the central coordinating team. During the data collection period, six SAPALDIA bulletins with information and feed-back were distributed to all centres. The bulletins addressed issues relating to data collection and quality and provided additional information about topics that had been raised during workshops and quality control visits.
Environmental data
In each SAPALDIA region, criteria gases (NO2, SO2, ozone)
and fine particles (PM10, PM2.5) have been monitored at
cen-tral sites. The core of these air pollution measurements have been conducted within the national (NABEL) and cantonal monitoring networks, providing long-term routine data for six of the eight SAPALDIA regions. Measurements initiated by SAPALDIA closed the gaps in the monitoring network (Montana and Wald) and regarding parameters not routi-nely assessed (PM2.5).
Air quality standards for PM10were introduced in
Switzer-land in 1996 making measurement of PM10mandatory.
Mea-surement of PM10by Harvard impactors was introduced in
the SAPALDIA regions already in 1993. The changes in PM10 measuring technologies since then have been taken
into account for calculating PM10time series between 1991
esti-mated as fraction of total suspended particulates (TSP) (Gehrig & Hofer 1999) in Geneva, Lugano, Basel, Payerne and Davos, while in Wald and Montana Harvard impactor data was converted to the reference method Digitel HiVol sampling (Monn & Krütli 1999). PM2.5 has been measured in
all SAPALDIA areas since 1999. Personal, indoor and out-door NO2has been measured by SAPALDIA participants in
1992/93 using palmes tubes (Monn et al. 1998) and indoor and outdoor NO2 again in 2002/03. In addition to air
pol-lutants, meteorological parameters and pollen data have been collected for each SAPALDIA area.
In SAPALDIA 1, exposure assignment relied predomi-nantly on data from a single monitor in each community. Most participants lived within seven kilometers of the local monitoring stations and we had demonstrated that parti-culate matter, one of our primary indicators of ambient air pollution, is homogeneously distributed within such distan-ces and not much affected by local traffic (Röösli et al. 2000; 2001). Moreover, we have found ambient PM2.5from
out-door sources to be correlated with personal exposure to PM2.5 (Oglesby et al. 2000). As indicator of spatially less
homogenous traffic-related pollutants, we chose NO2 as
primary candidate, and conducted complementary neigh-borhood monitoring in SAPALDIA1. The latter showed associations with lung function within areas not observed with PM10(Schindler et al. 1998).
In SAPALDIA 2 the single monitor approach was extended towards individual exposure estimates. The goal is the assign-ment of individual long-term air pollution exposure to each subject, taking into account changes in residential location during the 11 year follow-up period. Approximately 20 % of SAPALDIA 2 participants moved from their original study area in SAPALDIA 1. Therefore, estimates of ambient con-centrations of air pollutants from other areas need to be in-corporated into exposure estimates. Exposure estimates for SAPALDIA 2 participants will be derived from NO2, PM10
and PM2.5 maps resulting from emission-based models using
Geographical information system technology (GIS) which have been validated by monitoring data from fixed sites. The model for NO2will be further validated and, if necessary,
adjusted using outdoor NO2palm tubes measurements made
by sub-samples of SAPALDIA 1 and SAPALDIA 2 partici-pants at their homes and GIS-data on traffic-related param-eters such as distance to street. The resulting models of ambient pollutant levels over the follow-up period will then be linked to the residential locations of SAPALDIA parti-cipants thereby providing individual exposure estimates.
Results
Participation in examinations
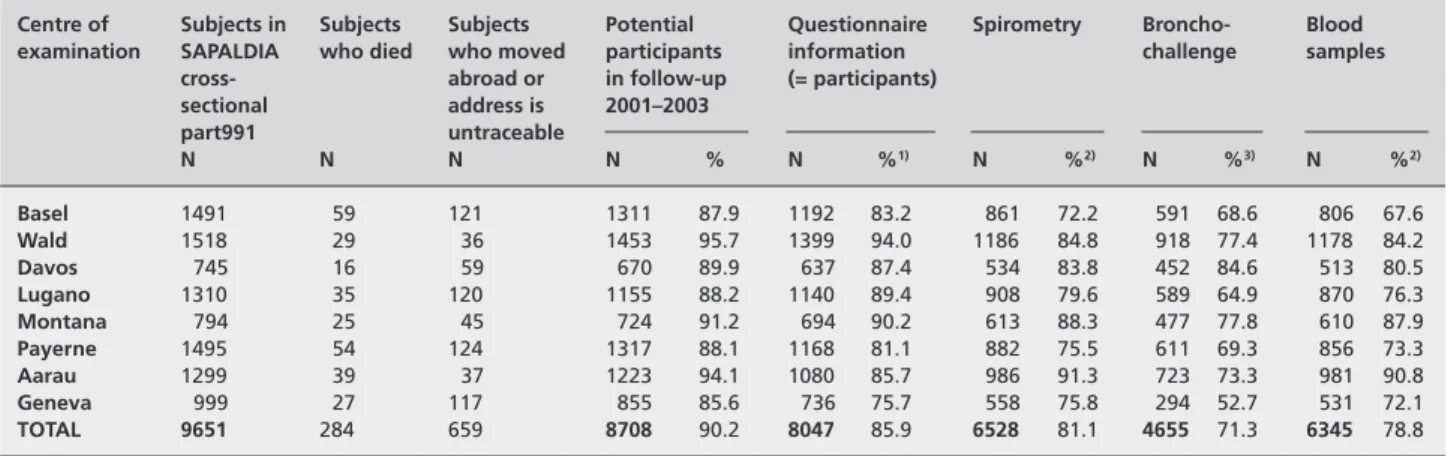
In 1991, 9 651 subjects participated in SAPALDIA 1. By 2001, 283 (2.9 %) participants had died (194 men, 89 women), 653 (6.8 %) had moved abroad or were not trace-able by March 2003. Therefore, 8 715 subjects (93 % of the survivors of the original cohort) could be contacted (Tab. 2). Of these 8 715 subjects, 8 047 (92 % or 86 % of survivors) completed at least one questionnaire (screening question-naire, main interview questionnaire or short versions of the main interview questionnaire). Participants who provided more information than the screening questionnaire were classified as responders and as having participated in SAPALDIA 2 (N=7 680=88 % of traceable and 82 % of living participants in 2001) (Tab. 3a).
There were 6 528 SAPALDIA 2 participants who performed spirometry and of these 6 222 provided spirometry data that met quality criteria. For the methacholine challenge test, 167 participants (2.6 %) had to be excluded on the basis of an FEV1 less than 70 % of predicted or less than 1.5L. Other participants were excluded on the basis of having had a myo-cardial infarction within the last three months, receiving medication for heart disease, pregnancy, lactation, treat-ment with beta blockers (13.3 %), no consent for testing (7.3 %), and other reasons which included doubts about health status of the participant, unsatisfactory manoeuvres, technical problems and loss of data (8.2 %). Of the 4 655 par-ticipants who had a bronchial challenge; data from 4211 (90.5 %) participants met quality criteria.
We collected blood samples of 6 327 participants who agreed to blood marker analysis and extracted DNA from blood of 6 215 participants who agreed to genetic testing. Of the random sample of older participants invited to participate in the measurement of ECG; 1 860 provided an ECG for a continuous period of more than 20 hours. Table 3 a and b give an overview on participation in examinations and the numbers of questionnaires of different types. There were 6 207 subjects, representing 66 % of the survivors of the original cohort, who completed the entire protocol (interview, spirometry and blood sample); and valid data is available for 5 973 (62 %).
Description of participants in SAPALDIA 1 and 2
To test the hypothesis that participation was associated with health-related behaviours (e. g. smoking) and health status (e. g. lung function and symptoms), we compared parti-cipants in both SAPALDIA 1 and 2 to partiparti-cipants who only participated in SAPALDIA 1 using data collected at SAPALDIA 1. Figures 1a and 1 b show the prevalence of
Soz.- Präventivmed. 50 ( 2005) 245 – 263
never and current smokers and selected respiratory symp-toms in participants in SAPALDIA 1 and SAPALDIA 2. An adjusted means procedure was utilised to show the pre-valence in SAPALDIA 2 adjusted for smoking and symptom characteristics of all participants in SAPALDIA 1 (STATA Corporation, Texas 77845, Special Edition release 8.2). Overall, participants in both SAPALDIA 1 and 2 had slightly less symptoms in 1991 and were more likely to be non-smokers than those who did not participate in the follow-up. As expected there was a small increase in prevalence of some respiratory symptoms, specially wheeze and classic phlegm, and a considerable proportion (28 %) of smokers had quit smoking.
Tables A1 and A2 in the appendix show the distribution of BMI by age groups and sex. There was a considerable increase of weight in this population between assessments (the mean weight increase was 5.5 kg/person). The mean
Table 2 SAPALDIA participants in 1991 and traceable and untraceable subjects in 2001–2003, Switzerland
Centre of Subjects in Subjects Subjects Potential Questionnaire Spirometry Broncho- Blood examination SAPALDIA who died who moved participants information challenge samples
cross- abroad or in follow-up (= participants)
sectional address is 2001–2003 part991 untraceable N N N N % N %1) N %2) N %3) N %2) Basel 1491 59 121 1311 87.9 1192 83.2 861 72.2 591 68.6 806 67.6 Wald 1518 29 36 1453 95.7 1399 94.0 1186 84.8 918 77.4 1178 84.2 Davos 745 16 59 670 89.9 637 87.4 534 83.8 452 84.6 513 80.5 Lugano 1310 35 120 1155 88.2 1140 89.4 908 79.6 589 64.9 870 76.3 Montana 794 25 45 724 91.2 694 90.2 613 88.3 477 77.8 610 87.9 Payerne 1495 54 124 1317 88.1 1168 81.1 882 75.5 611 69.3 856 73.3 Aarau 1299 39 37 1223 94.1 1080 85.7 986 91.3 723 73.3 981 90.8 Geneva 999 27 117 855 85.6 736 75.7 558 75.8 294 52.7 531 72.1 TOTAL 9651 284 659 8708 90.2 8047 85.9 6528 81.1 4655 71.3 6345 78.8
1)Percentage of surviving subjects
2)Percentage of participants
3)Percentage of spirometry
Table 3a Questionnaires submitted to the 2001–2003 follow-up of
SAPALDIA, Switzerland Nb. of subjects Screening questionnaire 367 Ultrashort questionnaire 193 Short questionnaire 907 Interview 6573
Spirometry or blood with only a
screening questionnaire 7
Total 8047
Self-administered questionnaires:
Women’s questionnaire 3153
Menstruation Card 1021
Asthma quality of life 298
SF 36 5703
Epworth sleepiness scale 6092
Occupation list 6045
Medication list 3404
Cardio time activity diary and holter 1807
Residence list 5713
Table 3b Completeness of tests
total Given blood ECG Blood & ECG
number of participants
Interview1) 7673 6345 1813 1763
Interview + spirometry2) 6218 59754) 1693 1649
Interview + spirometry 4113 3998 1054 1035
+ methacholine challenge3)
1) Interview includes subjects who answered either the long, short or ultra-short interview questionnaires and excludes subjects who only answered
the screening questionnaire
2)Spirometry that met good quality criteria
3)Methacholine challenge that met good quality criteria
weight gain was highest in younger men and decreased in both sexes after 55. The Tables in the Appendix also show the distribution of lung function (measured by forced expiratory volume in one second and forced vital capacity), the preva-lence of the selected respiratory symptoms as well as the prevalence of current smoking and amounts of cigarettes smoked per day.
Development of air pollutants between SAPALDIA 1 and 2
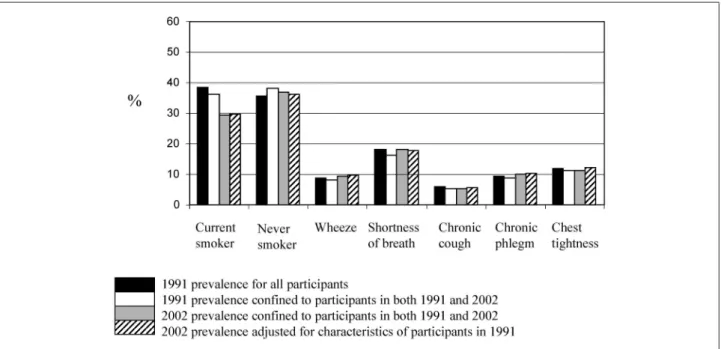
Ambient concentrations of NO2and PM10have decreased in
most SAPALDIA areas since 1991 (Fig. 2a and 2b). In most areas the strong decrease of the early 1990s was partially lev-elled out by increasing levels due to meteorological factors in the years just before SAPALDIA 2, particularly for PM10.
The strongest absolute decline of NO2was observed in the Figure 1a Participation in SAPALDIA in men by smoking status and respiratory symptoms (for definitions, see Methods section), Switzerland, 1991
and 2002
Figure 1b Participation in SAPALDIA in women by smoking status and respiratory symptoms (for definitions, see Methods section), Switzerland, 1991
Soz.- Präventivmed. 50 ( 2005) 245 – 263
Figure 2a 12-year course of NO2 [µg/m3] in the SAPALDIA Regions, Switzerland
Figure 2b 12-year course of PM10 [µg/m3] in the SAPALDIA Regions, Switzerland
Method: Chemilumineszenz
Stations: Geneva: St. Clothilde; Lugano: Lugano NABEL; Aarau: Aarau Luftelektrische Station; Basel: Basel-Binningen NABEL; Payerne: Payerne
NABEL; Wald (Zurich): Wald-Spital; Davos: Davos-Matta; Montana: 1990–1998 Montana-Clinic, since 2002 Montana-Village.
Methods: Digitel HiVol sampling. Data before 1997 converted from TSP (Geneva, Lugano, Basel, Payerne, Davos) and Harvard-data (Wald, Montana) Stations: Geneva: St. Clothilde; Lugano: Lugano NABEL; Aarau: Aarau Luftelektrische Station; Basel: Basel-Binningen NABEL; Payerne: Payerne
two areas with the highest 1991 baseline levels, Geneva and Lugano, while the alpine area Montana exhibited on a low level a slight increase. The absolute and relative decline of PM10in most areas was less pronounced compared to NO2.
Differences between the areas remain, especially for NO2,
though the air pollution exposure contrast between areas has been reduced since SAPALDIA 1.
Discussion
Despite a demanding study protocol, a high participation rate was achieved in the SAPALDIA follow-up. Comparison of characteristics at SAPALDIA 1 showed some differences between SAPALDIA 2 participants and non-participants, but most differences were small and are unlikely to bias the main analyses of the study.
The most striking feature was the high proportion of smokers in 1991 who had quit by 2002. In view of the lower participation of smokers in 2001 this raises the question of selected recruitment; those who gave up might have been more moti-vated to participate in a health examination. The Swiss natio-nal Health Survey (Bundesamt für Statistik 2001/2004) shows an increase in the proportion of former smokers with age (18% in men aged 35–44 to 42% in the 64–75 age group, with a stable proportion in each age group between 1992 and 2002). The SAPALDIA cohort gained weight in the past 11 years. The average increase in body mass index (BMI) in young men was 3.7 kg/m2, on average subjects weighed 5.5 kg
[SE 0.08] more than in 2002 compared to 1991. The distrib-ution of BMI in the SAPALDIA population compares favourably to the MONICA Augsburg population (Gasse et al. 2002) and the Chianti population (Bartali et al. 2002), within both sexes and across all age groups, although women in Innsbruck seem to be slimmer (Ulmer et al. 2001). The BMI reported by Schilling (Schilling et al. 2001) for Swiss employees seems comparable to the distribution for women in our study, but as their results relate to the years 1996–98 one might speculate that the distribution of BMI in their population might also have been higher in 2002.
As for the amount of cigarettes smoked, an interesting com-parison with the Innsbruck Women’s Health Study (Ulmer et al. 2001) is possible. While the proportion of smokers is con-siderably higher in Innsbruck (40% in the youngest age group and 35% in women aged 40–59) the mean number of ciga-rettes smoked per day is higher in the Swiss female population. Since these results from SAPALDIA 2 are consistent with data from other Swiss surveys and prevalence estimates for symptoms from SAPALDIA 2 did not change much after ad-justment for differential non-participation we conclude that the SAPALDIA population sample reflects the distribution of
risk factors for non communicable diseases in an average Swiss population.
SAPALDIA was designed to investigate the effects of air pollutants on respiratory health (including lung function, development of symptoms and diseases) in a random sample of the adult population of Switzerland. Given the high par-ticipation rate in the SAPALDIA follow-up we have suffi-cient power to test the association of respiratory, allergic and cardiovascular outcomes with air pollution parameters over the course of 11 years. In SAPALDIA 2, the urban centres Basel and Geneva had lower participation rates. We there-fore expect that the trend towards healthier more educated participants is amplified in these cities, which might result in an under-estimation of the effects of ambient air pollution, since they might live in less polluted places. However since we are able to look at differences within individuals as well as by area sampling effects by area become less important. Throughout the 11 year follow-up period air quality has been continuously monitored and a steady decline in most pollutant levels has been observed. The individual long term exposure assignment (based on personal residential history and GIS modelling of air pollutant concentrations) will increase power to detect the effects of ambient air pollution at different levels of cumulative exposure (Künzli & Tager 2000). These improvements in individual exposure assign-ment should counterbalance the relative loss in power due to the steady decrease in pollution levels which ultimately reduces the exposure contrast in the SAPALDIA study. The DNA collected in the follow-up will enable us to address emerging questions about the interaction of environmental and genetic factors in important diseases and might help to detect especially sensitive subgroups.
Acknowledgements
The study could not have been done without the help of the study participants, technical and administrative support and the medical teams and field workers at the local study sites Local fieldworkers:
Aarau: M. Broglie, M. Bünter, G. Drita, Basel: R. Armbruster, T. Damm, M. Gut, L. Maier, A. Vögelin, L. Walter, Davos: D. Jud: Geneva: M. Ares, M. Bennour, E. Namer, Lugano: B. Baum-berger, S. Boccia Soldati, E. Gehrig-Van Essen, S. Ronchetto, Montana: C. Bonvin Payerne: S. Blanc, A.V. Ebinger, ML Frag-nière, J. Jordan, Wald: N. Kourkoulos, U. Schafroth.
Software technicians
S. Baur, P. Frankenbach, D. Burkhard
Genetic laboratory technician
E. Glaus
Administrative assistants
Soz.- Präventivmed. 50 ( 2005) 245 – 263 Zusammenfassung
Die Schweizer SAPALDIA-Kohortenstudie (SAPALDIA 2) 1991– 2003: Methoden und Teilnehmendencharakteristika
Fragestellung: Die Schweizer Kohortenstudie
Luftverschmut-zung und Atemwegserkrankungen bei Erwachsenen (SAPAL-DIA) untersucht die gesundheitlichen Auswirkungen der Lang-zeitbelastung durch Luftschadstoffe in der Bevölkerung.
Methoden: 1991 und 2002 wurden ein Interview zur
respirato-rischen Gesundheit und deren Risikofaktoren, eine Spirometrie, ein bronchialer Reagibilitätstest mit Methacholin, eine end-expiratorische Kohlenmonoxidmessung und Tests zur allergi-schen Sensibilisierung durchgeführt. Für SAPALDIA 2 wurde eine Biobank mit Blut-, Serum-, Plasma- und DNA-Proben ein-gerichtet. Eine Stichprobe der über 50-jährigen Teilnehmenden erhielt ein 24-Stunden EKG (Holter). Luftschadstoffkonzentra-tionen von Stickstoffdioxid (NO2), Schwefeldioxid (SO2), Ozon (O3) und Schwebstaub (PM10) wurden in allen acht Studien-gebieten seit 1991 gemessen. Die seit SAPALDIA 1 erfassten Adressgeschichten und auf GIS-Technologie beruhenden Schad-stoffverteilungsdaten für NO2und PM10werden die Schätzung der individuellen Langzeitbelastung jedes SAPALDIA-Teilneh-menden ermöglichen.
Ergebnisse: Von der ursprünglichen Kohorte von 9 651
Teil-nehmern in 1991 waren 283 verstorben und Adressen konnten von 8715 aufgefunden werden. Basisinformationen zum Ge-sundheitszustand von 8 047 Personen (86 % aller lebenden Personen) wurden erfasst, 6 528 (70 %) nahmen an der Un-tersuchung teil und für 5 973 (62 %) liegen vollständige SAPALDIA2-Untersuchungen vor. Nichtteilnehmende waren im Durchschnitt jünger, weniger gut ausgebildet, eher Raucher und hatten eher respiratorische Symptome. Die untersuchten Perso-nen haben in den letzten 11 Jahren durchschnittlich 5,5 kg Kör-pergewicht zugelegt, 28 % der RaucherInnen haben aufgehört zu rauchen.
Résumé
Etude de cohorte SAPALDIA (Etude Suisse sur la pollution atmosphérique et les maladies respiratoires chez l’adulte): méthodes et caractéristiques des participants
Objectifs: L’étude SAPALDIA a pour objectif de mesurer les
effets sur la santé d’une exposition à long terme aux polluants atmosphériques dans la population adulte.
Méthodes: Les participants ont été interrogés en 1991 et en
2002 sur leur état de santé respiratoire et ses facteurs de risque. Ils ont passé les examens suivants: spirométrie, test de la réactivité bronchique et de l’atopie, mesure du CO en fin d’expiration. Une banque biologique a été créée. Un ECG (Holter) a été pratiqué auprès d’un échantillon de participants âgés de plus de 50 ans. Les concentrations des polluants at-mosphériques (dioxyde d’azote (NO2), dioxyde de soufre (SO2), ozone, particules fines (PM10)) ont été mesurées dans huit ré-gions de Suisse depuis 1991. L’exposition individuelle sur 11 ans sera déterminée à partir des adresses, de la distribution de NO2 et PM10et les modèles GIS.
Résultats: Sur les 9 651 participants examinés en 1991, 283 sont
décédés, 87 15 ont été localisés, 8 047 ont donné des infor-mations sur leur état de santé (86 % des personnes en vie), 6 528 participants (70 %) ont accepté d’effectuer l’examen de santé et 5 973 (62 %) ont réalisé entièrement le protocole. Les non participants étaient en moyenne plus jeunes, moins éduqués, plus fréquemment fumeurs et souffraient plus fré-quemment de symptômes respiratoires. Les personnes exami-nées ont pris en moyenne 5,5 kg de poids en 11 ans. 28 % des fumeurs ont cessé de fumer.
References
Abbey DE, Nishino N, McDonnell WF, et al. (1999). Long-term inhalable particles and other air pollutants related to mortality in nonsmokers. Am J Respir Crit Care Med 159: 373–82. Ackermann-Liebrich U, Leuenberger P, Schwartz J, et al. (1997). Lung function and long term exposure to air pollutants in Switzerland: Study on Air Pollution and Lung Diseases in Adults (SAPALDIA) Team. Am J Respir Crit Care Med 155: 122–9.
American Thoracic Society (1995). Standardisa-tion of spirometry 1994 update. Am J Resp Crit Care Med 152: 1107–36.
Bartali B, Benvenuti E, Corsi A-M, et al. (2002). Changes in anthropometric measures in men and women across the life-span: findings from the InCHIANTI study. Soz Praventiv Med 47: 336–48.
Brändli O, Schindler C, Künzli N, Keller R, Perruchoud AP (1996). Lung function in healthy never smoking adults: reference values and lower limits of normal of a Swiss population. Thorax 51: 277–83.
Brändli O, Schindler C, Leuenberger PH, et al. (2000). Re-estimated equations for 5th percen-tiles of lung function variables. Thorax 55: 173–4. Bundesamt für Statistik (2001/2004). Schweize-rische Gesundheitsbefragung 1992/1997/2002. Neuchâtel: Bundesamt für Statistik. Burney PG, Luczynska C, Chinn S, Jarvis D (1994). The European Community Respiratory Health Survey. Eur Respir J 7: 954–60. Dockery DW, Pope CA, Xu X, et al. (1993). An association between air pollution and mortality in six U.S. cities. N Engl J Med 329: 1753–9. European Science Foundation (1998). Scientists’ recommendations: environment and health research for Europe. Strasbourg: ESF. Finkelstein MM, Jerrett M, Sears MR (2004). Traffic air pollution and mortality rate advance-ment periods. Am J Epidemiol 160: 173–7. Gasse C, Hense HW, Stieber J, et al. (2002). Factors associated with differences in antihyper-tensive drug treatment: results from the MONICA Augsburg Population Surveys 1989/90 and 1994/95. Soz Praventiv Med 47: 128–42. Gehrig R, Hofer P (1999). Vergleich von TSP-, PM10- und PM2.5-Schwebestaubmessungen im NABEL 1997 und 1998. Dübendorf: EMPA. Hazenkamp-von Arx M, Götschi T, Ackermann-Liebrich U, et al. (2004). PM2.5 and NO2 assess-ment in 21 European study centres of ECRHS II: annual means and seasonal differences. Atmos Environ 2004 38: 1943–53.
Hoek G, Brunekreef B, Goldbohm S, Fischer P, van den Brandt PA (2002). Association between mortality and indicators of traffic-related air pollution in the Netherlands: a cohort study. Lancet 360: 1203–9.
Jantunen M, Hänninen O, Katsouyanni K, et al. (1998). Air pollution exposure in European cities: the EXPOLIS stud. J Exp Analys Environ Epidemiol 8: 495–518.
Johns MW (1991). A new method for measuring daytime sleepiness: the Epworth sleepiness scale. Sleep 14: 540–5.
Juniper EF, Guyatt GH, Ferrie PJ, Griffith LE (1993). Measuring quality of life in asthma. Am Rev Respir Dis 147: 832–8.
Kennedy SM, Le Moual N, Choudat D, Kauff-mann F (2000). Development of an asthma specific job exposure matrix and its application in the epidemiological study of genetics and en-vironment in asthma (EGEA). Occup Environ Med 57: 635–41.
Künzli N, Ackermann U, Leuenberger P, et al. (1995). Between area variation of time spent out-doors, a theoretical determinant of ambient air pollution exposure. Epidemiology 6: S45. Künzli N, Ackermann-Liebrich U, Brändli O, Tschopp JM, Schindler C, Leuenberger P (2000). Clinically “small” effects of air pollution on FVC have a large public health impact: Swiss Study on Air Pollution and Lung Disease in Adults (SAPALDIA). Eur Respir J 15: 131–6. Künzli N, Tager IB (2000). Long-term health effects of particulate and other ambient air pollu-tion: research can progress faster – if we want it to! Env Health Perspect 108: 915–8.
Kuna-Dibbert B, Künzli N, Keidel D, et al. (2005). Longitudinal validity of spirometers: a challenge in lung function follow-up Studies. (Under review).
Leuenberger P, Schindler C, Schwartz J, et al. (2000). Occupational exposure to inhalative irri-tants and methacholine responsiveness. Scand J Work Environ Health 26: 146–52.
Leuenberger P, Schwartz J, Ackermann-Liebrich U, et al. (1994). Passive smoking exposure in adults and chronic respiratory symptoms (SAPALDIA Study). Am J Respir Crit Care Med 150: 1222–8.
Martin BW, Ackermann-Liebrich U, Leuenberger P, et al. (1997). SAPALDIA: methods and par-ticipation in the cross-sectional part of the Swiss Study on Air Pollution and Lung Diseases in Adults. Soz Praventiv Med 42: 67–84. Monn C, Brändli O, Schindler C, Ackermann-Liebrich U, Leuenberger P (1998). Personal exposure to nitrogen dioxide in Switzerland: Swiss Study on Air Pollution and Lung Diseases in Adults. Sci Total Environ 215: 243–51.
Monn C, Krütli P (1999). PM10 Vergleichungs-messungen zwischen dem Harvard low-flow-rate-sharp-cut-Impaktor und dem Digitel DHA 80”. Zürich: Institut für Hygiene und Arbeitsphysio-logie ETH. (Bericht; UH99-10).
Oglesby L, Künzli N, Röösli M, et al. (2000). Validity of ambient levels of fine particles as surrogate for personal exposure to outdoor air pollution: results of the European EXPOLI-SEAS Study (Swiss Center Basel). J Air Waste Manag Assoc 50: 1251–61.
Pope CA, Burnett RT, Thun MJ, et al. (2002). Lung cancer, cardiopulmonary mortality, and long-term exposure to fine particulate air pollution. JAMA 287: 1132–41.
Pope CA, Thun MJ, Namboodiri MM, et al. (1995). Particulate air pollution as a predictor of mortality in a prospective study of U.S. adults. Am J Respir Crit Care Med 151: 669–74. Röösli M, Braun-Fahrländer C, Künzli N, et al. (2000). Spatial variability of different fractions of particulate matter within an urban environment and between urban and rural sites. J Air Waste Manag Assoc 50: 1115–24.
Röösli M, Theis G, Künzli N, et al. (2001). Temporel and spatial variation of the chemical composition of PM10 at urban and rural sites in the Basel area, Switzerland. Atmos Environ 35: 3701–13.
Schilling J, Lee C-Y, Faisst K, et al. (2001). Methods of the National Check Bus Project. Soz Praventiv Med 46: 195–206.
Schindler C, Ackermann-Liebrich U, Leuen-berger P, et al. (1998). Associations between lung function and estimated average exposure to NO2 in eight areas of Switzerland: Swiss Study of Air Pollution and Lung Diseases in Adults. Epidemiology 9: 405–11.
Schindler C, Künzli N, Bongard JP, et al. (2001). Short-term variation in air pollution and in average lung function among never-smokers: the Swiss Study on Air Pollution and Lung Diseases in Adults (SAPALDIA). Am J Respir Crit Care Med 163: 356–61.
Schwartz J, Schindler C, Zemp E, et al. (2002) Predictors of methacholine responsiveness in a general population. Chest 122: 812–20. Strupler W, Wüthrich B, Schindler C, et al. (1997). Prävalenz der Hymenopterengiftallergien in der Schweiz: eine epidemiologische und serologische Studie der SAPALDIA-Stichprobe. Allergo J 6 (suppl 1): 7–11.
Townsend MC, Hankinson JL, Lindesmith LA, Slivka WA, Stiver G, Ayres GT (2004). Is my lung function really that good? Chest 125: 1902–9. Ulmer H, Deibl M, Jakel H, Pfeiffer KP (2001). The Innsbruck Women’s Health Study 1999: health status and behaviour. Soz Praventiv Med 46: 259–67.
Soz.- Präventivmed. 50 ( 2005) 245 – 263
Ware JE Jr (1994). Monitoring health care from the patient’s point of view. Hosp Pract (Off Ed) 29: 12, 17.
Wüthrich B, Schindler C, Leuenberger P, et al. (1999). Atopische Sensibilisierung, Luftver-schmutzung und respiratorische Erkrankungen in der Schweiz. Allergologie 5: 267–74. Wüthrich B, Schindler C, Leuenberger P, Acker-mann-Liebrich U (1995). Prevalence of atopy and pollinosis in the adult population of Switzerland (SAPALDIA study). Int Arch Allergy Immunol 106: 149–56.
Wüthrich B, Schindler C, Medici TC, Zellweger JP, Leuenberger P (1996). IgE levels, atopy mar-kers and hay fever in relation to age, sex and smoking status in a normal adult Swiss popula-tion: SAPALDIA (Swiss Study on Air Pollution and Lung Diseases in Adults) Team. Int Arch Allergy Immunol 111: 396–402.
Zemp E, Elsasser S, Schindler C, et al. (1999). Long-term ambient air pollution and respiratory symptoms in adults (SAPALDIA study). Am J Respir Crit Care Med 159: 1257–66.
Address for correspondence
Prof. Dr. med. Ursula Ackermann-Liebrich Institut für Sozial-und Präventivmedizin Steinengraben 49 CH-4051 Basel Tel.: +41-61 267 60 66 Fax: +41-61 267 61 90 e-mail: ursula.ackermann-liebrich@unibas.ch
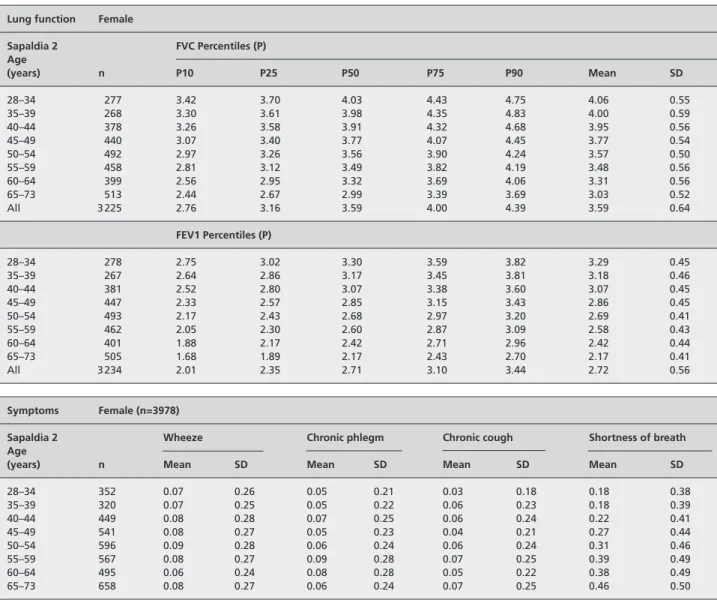
Table A1 Lung function, respiratory symptoms, body mass index and smoking in women of the SAPALDIA cohort, Switzerland
Lung function Female
Sapaldia 2 FVC Percentiles (P) Age (years) n P10 P25 P50 P75 P90 Mean SD 28–34 277 3.42 3.70 4.03 4.43 4.75 4.06 0.55 35–39 268 3.30 3.61 3.98 4.35 4.83 4.00 0.59 40–44 378 3.26 3.58 3.91 4.32 4.68 3.95 0.56 45–49 440 3.07 3.40 3.77 4.07 4.45 3.77 0.54 50–54 492 2.97 3.26 3.56 3.90 4.24 3.57 0.50 55–59 458 2.81 3.12 3.49 3.82 4.19 3.48 0.56 60–64 399 2.56 2.95 3.32 3.69 4.06 3.31 0.56 65–73 513 2.44 2.67 2.99 3.39 3.69 3.03 0.52 All 3 225 2.76 3.16 3.59 4.00 4.39 3.59 0.64 FEV1 Percentiles (P) 28–34 278 2.75 3.02 3.30 3.59 3.82 3.29 0.45 35–39 267 2.64 2.86 3.17 3.45 3.81 3.18 0.46 40–44 381 2.52 2.80 3.07 3.38 3.60 3.07 0.45 45–49 447 2.33 2.57 2.85 3.15 3.43 2.86 0.45 50–54 493 2.17 2.43 2.68 2.97 3.20 2.69 0.41 55–59 462 2.05 2.30 2.60 2.87 3.09 2.58 0.43 60–64 401 1.88 2.17 2.42 2.71 2.96 2.42 0.44 65–73 505 1.68 1.89 2.17 2.43 2.70 2.17 0.41 All 3 234 2.01 2.35 2.71 3.10 3.44 2.72 0.56 Symptoms Female (n=3978)
Sapaldia 2 Wheeze Chronic phlegm Chronic cough Shortness of breath
Age
(years) n Mean SD Mean SD Mean SD Mean SD
28–34 352 0.07 0.26 0.05 0.21 0.03 0.18 0.18 0.38 35–39 320 0.07 0.25 0.05 0.22 0.06 0.23 0.18 0.39 40–44 449 0.08 0.28 0.07 0.25 0.06 0.24 0.22 0.41 45–49 541 0.08 0.27 0.05 0.23 0.04 0.21 0.27 0.44 50–54 596 0.09 0.28 0.06 0.24 0.06 0.24 0.31 0.46 55–59 567 0.08 0.27 0.09 0.28 0.07 0.25 0.39 0.49 60–64 495 0.06 0.24 0.08 0.28 0.05 0.22 0.38 0.49 65–73 658 0.08 0.27 0.06 0.24 0.07 0.25 0.46 0.50
Soz.- Präventivmed. 50 ( 2005) 245 – 263 Table A1 (continued)
BMI Female
Sapaldia 2 Percentiles (P) change in bmi between
Age Sapaldia 1 and 2
(years) n P10 P25 P50 P75 P90 Mean SD Mean SD 28–34 284 19.22 20.50 22.09 24.91 28.83 23.34 4.33 1.85 2.57 35–39 277 19.24 20.37 22.16 25.21 28.68 23.26 4.23 2.00 2.25 40–44 391 19.43 20.79 23.03 25.96 29.00 23.99 4.88 2.17 2.70 45–49 455 19.81 21.21 23.63 26.75 30.38 24.54 4.65 2.16 2.24 50–54 514 20.32 21.80 24.48 28.01 31.79 25.41 4.92 2.31 2.45 55–59 485 20.24 21.98 24.82 28.50 32.67 25.74 4.88 2.15 2.14 60–64 426 21.38 23.07 25.67 29.10 32.99 26.35 4.54 1.91 2.33 65–73 560 21.50 23.60 26.39 30.11 33.52 27.11 4.90 1.79 2.25 All 3 392 19.95 21.64 24.20 27.83 31.69 25.22 4.89 2.05 2.36 Smoking Female
Sapaldia 2 Cigarettes per day in current smokers
Age
(years) % current Percentiles (P)
n smokers 95 % CI n P10 P25 P50 P75 P90 mean SD 28–34 351 25.4 20.9–30.2 89 1 4 10 15 20 10.3 7.7 35–39 319 32.6 27.5–38.0 103 3 7 15 20 20 13.5 9.3 40–44 446 28.5 24.3–32.9 127 2 6 15 20 25 14.6 9.7 45–49 537 31.1 27.2–35.2 167 3 6 15 20 30 14.9 10.3 50–54 591 26.9 23.4–30.7 159 3 10 15 20 30 16.0 10.2 55–59 561 24.1 20.6–27.8 135 2 6 15 20 20 13.7 8.8 60–64 491 17.5 14.2–21.2 85 2 4 10 20 25 12.6 9.6 65–73 652 9.5 7.3–12.0 62 2 5 14.5 20 30 14.9 11.1 All 3 948 23.5 22.2–24.9 927 2 6 15 20 25 14.0 9.7
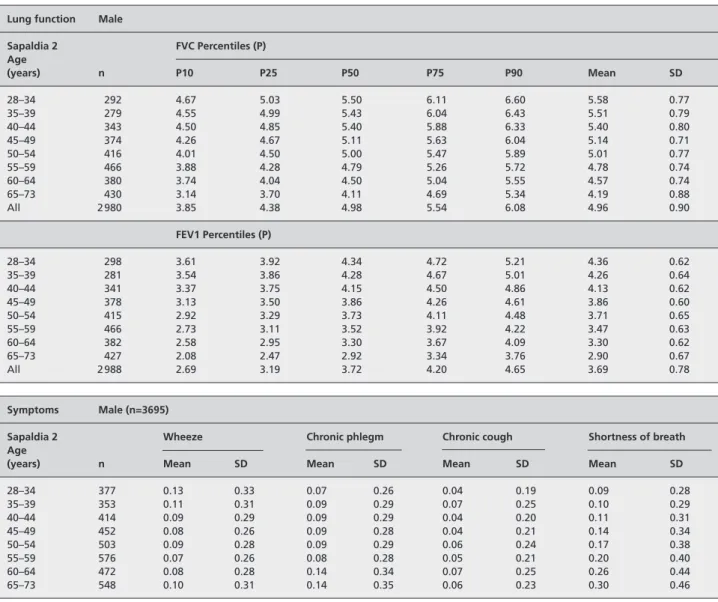
Table A2 Lung function, respiratory symptoms, body mass index and smoking in men of the SAPALDIA cohort, Switzerland
Lung function Male
Sapaldia 2 FVC Percentiles (P) Age (years) n P10 P25 P50 P75 P90 Mean SD 28–34 292 4.67 5.03 5.50 6.11 6.60 5.58 0.77 35–39 279 4.55 4.99 5.43 6.04 6.43 5.51 0.79 40–44 343 4.50 4.85 5.40 5.88 6.33 5.40 0.80 45–49 374 4.26 4.67 5.11 5.63 6.04 5.14 0.71 50–54 416 4.01 4.50 5.00 5.47 5.89 5.01 0.77 55–59 466 3.88 4.28 4.79 5.26 5.72 4.78 0.74 60–64 380 3.74 4.04 4.50 5.04 5.55 4.57 0.74 65–73 430 3.14 3.70 4.11 4.69 5.34 4.19 0.88 All 2 980 3.85 4.38 4.98 5.54 6.08 4.96 0.90 FEV1 Percentiles (P) 28–34 298 3.61 3.92 4.34 4.72 5.21 4.36 0.62 35–39 281 3.54 3.86 4.28 4.67 5.01 4.26 0.64 40–44 341 3.37 3.75 4.15 4.50 4.86 4.13 0.62 45–49 378 3.13 3.50 3.86 4.26 4.61 3.86 0.60 50–54 415 2.92 3.29 3.73 4.11 4.48 3.71 0.65 55–59 466 2.73 3.11 3.52 3.92 4.22 3.47 0.63 60–64 382 2.58 2.95 3.30 3.67 4.09 3.30 0.62 65–73 427 2.08 2.47 2.92 3.34 3.76 2.90 0.67 All 2 988 2.69 3.19 3.72 4.20 4.65 3.69 0.78 Symptoms Male (n=3695)
Sapaldia 2 Wheeze Chronic phlegm Chronic cough Shortness of breath
Age
(years) n Mean SD Mean SD Mean SD Mean SD
28–34 377 0.13 0.33 0.07 0.26 0.04 0.19 0.09 0.28 35–39 353 0.11 0.31 0.09 0.29 0.07 0.25 0.10 0.29 40–44 414 0.09 0.29 0.09 0.29 0.04 0.20 0.11 0.31 45–49 452 0.08 0.26 0.09 0.28 0.04 0.21 0.14 0.34 50–54 503 0.09 0.28 0.09 0.29 0.06 0.24 0.17 0.38 55–59 576 0.07 0.26 0.08 0.28 0.05 0.21 0.20 0.40 60–64 472 0.08 0.28 0.14 0.34 0.07 0.25 0.26 0.44 65–73 548 0.10 0.31 0.14 0.35 0.06 0.23 0.30 0.46
Soz.- Präventivmed. 50 ( 2005) 245 – 263 Table A2 (continued)
BMI Male
Sapaldia 2 Percentiles (P) change in bmi between
Age Sapaldia 1 and 2
(years) n P10 P25 P50 P75 P90 Mean SD Mean SD 28–34 311 21.31 22.82 24.61 26.70 29.09 25.08 3.42 2.79 2.32 35–39 294 21.50 23.16 25.33 27.47 29.48 25.58 3.69 2.17 2.08 40–44 362 21.89 23.74 25.45 27.77 30.68 25.97 3.75 2.07 1.98 45–49 396 21.80 23.66 25.58 28.10 31.28 26.15 3.76 1.77 1.96 50–54 441 22.63 24.09 26.22 28.74 31.80 26.86 4.05 1.80 2.03 55–59 516 23.25 24.97 26.91 29.41 32.70 27.44 3.70 1.82 1.88 60–64 415 22.79 24.73 26.73 29.05 31.90 27.10 3.53 1.31 1.92 65–73 470 23.17 25.01 27.35 29.72 32.31 27.56 3.75 1.29 2.01 All 3 205 22.26 24.03 26.13 28.67 31.59 26.61 3.81 1.82 2.05 Smoking Male
Sapaldia 2 Cigarettes per day in current smokers
Age
(years) % current Percentiles (P)
n smokers 95 % CI n P10 P25 P50 P75 P90 mean SD 28–34 372 29.6 25.0–34.4 110 1.5 7 15 20 30 16.6 13.1 35–39 346 34.0 29.1–39.2 118 1 6 20 20 30 16.1 11.6 40–44 350 34.6 30.0–39.4 143 1 7 20 30 35 18.6 13.9 45–49 413 36.0 31.6–40.7 160 <1 6.5 20 27.5 40 19.6 15.5 50–54 447 30.5 26.4–34.7 152 <1 3.5 20 22.5 30 16.2 13.0 55–59 499 27.4 23.7–31.2 157 <1 <1 12 20 30 14.1 13.7 60–64 574 26.3 22.3–30.6 123 <1 <1 12 20 30 13.6 12.8 65–73 467 20.3 17.0–24.0 110 <1 <1 8 20 20 10.4 10.2 All 3 663 29.3 27.9–30.9 1073 <1 4 15 20 30 15.9 13.4

![Figure 2a 12-year course of NO2 [µg/m 3 ] in the SAPALDIA Regions, Switzerland](https://thumb-eu.123doks.com/thumbv2/123doknet/14848091.628357/11.892.99.817.107.520/figure-year-course-no-µg-sapaldia-regions-switzerland.webp)