Selim Orgiil
George A. Croffi
E. Michael Van Buskirk
Variability of contour line alignment
on sequential images
with the Heidelberg Retina Tomograph
Received: 14 June 1996
Revised version received: 1 October 1996 Accepted: 14 October 1996
S. Orgtil • G.A. Croffi E.M. Van Buskirk Devers Eye Institute,
R.S. Dow Neurological Science Institute, Legacy Portland Hospitals,
Portland, Oregon, USA S. Orgtil (~)
University Eye Clinic Basel, Mittlere Strage 91, RO. Box, CH-4012 Basel, Switzerland Tel. +41-61-3217777; fax: +41-61-3 21 77 63;
e-mail: ORGUEL @ ubaclu.unibas.ch
Abstract
• Background: The in- fluence of the contour line align- ment software algorithm on the variability of the Heidelberg Retina Tomograph (HRT) parameters re- mains unclear. • Methods: Nine discrete topographic images were acquired with the HRT from the right eye in six healthy, emmetropic subjects. The variability of topo- metric data obtained from the same topographic image, analyzed within different samples of images, was evaluated. A total of four mean to- pographic images was computed for each subject from: all nine discrete images (A), the first six of those images (B), the last six of those nine images (C), and the first three combined with the last three images (D). A contour line was computed on the mean topographic image generated from the nine discrete to- pographic images (A). This contour line was then applied to the three other mean topographic images (B, C, and D), using the contour line alignment in the HRT software. Subsequently, the contour line on the mean topographic images was applied to each of the discrete members of the particular images subsets used to compute the mean topographic image, and the topo- metric data for these discrete topographic images was com- puted successively for each subset. Prior to processing each subset, the contour line on the discrete topo-graphic images was deleted. This strategy provided a total of three analyses on each discrete topo- graphic image: as a member of the nine images (mean topographic im- age A), and as a member of two subsets of images (mean topograph- ic image B, C, and/or D). The co- efficient of variation (100 × SD/ mean) of the topographic parame- ters within those three analyses was calculated for each discrete topo- graphic image in each subject ("in- traimage" coefficient of variation). In addition, a coefficient of varia- tion between the nine discrete topo- graphic images ("interimage" coef- ficient of variation) was calculated. • Results: The "intraimage" and "interimage" variability for the var- ious topographic parameters ranged between 0.03% and 3.10% and be- tween 0.03% and 24.07% respec- tively. The "intraimage" coeffi- cients of variation and "interimage" coefficients of variation correlated significant (r2=0.77; P<0.0001). • Conclusion: A high "intraimage" variability, i.e. a high variability in contour line alignment between se- quential images, might be an im- portant source of test re-test vari- ability between sequential images.
Introduction
Glaucomatous morphological changes of the optic nerve may precede measurable visual field defects by several years [10]. Therefore, reliable evaluation of the optic nerve head topography could prove important in the as- sessment and the m a n a g e m e n t of g l a u c o m a patients, es- pecially in early stages of the disease. Scanning-laser o p h t h a l m o s c o p y is a recently developed method to im- age and quantify the topographic structure of the retina and the optic nerve [1-9, 11]. The Heidelberg Retina Tomograph (HRT) is a scanning-laser o p h t h a l m o s c o p e that utilizes confocal optics to produce three-dimension- al topographic images. Topometric data can be comput- ed on these images.
The test re-test behavior o f the scanning-laser oph- thalmoscope has been evaluated thoroughly [1, 2, 4 - 9 , 11 ]. The influence of the contour line alignment software algorithm on the variability of the H R T parameters, however, remains unclear. The H R T stores a defined contour line for repeated analysis of the images or align- ment on sequential images, allowing those images to be analyzed with respect to the same region of interest. The software of the H R T allows generation of a mean topo- graphic image from a set of discrete topographic images by determining the average height measurement at each
image location (pixel). Once a region of interest has been defined by a contour line on a mean topographic image, this contour line can be transferred ("imported") onto the discrete topographic images included to compute the mean topographic image. Consequently, topometric data can be computed for each discrete topographic image, and the mean values of topometric data in sequential samples of topographic images can be c o m p a r e d statisti- cally. Ideally, during this process, the alignment of the contour line on discrete topographic images would be independent of the other discrete topographic images in- cluded to compute the mean topographic image. The purpose of this study was to determine the variability of the alignment of the contour line, i.e. the variability of topometric data obtained from the same topographic im- age, analyzed within different samples of images.
Subjects and methods
The variability of topometric data obtained from the same topo- graphic image, analyzed within different samples of images, was evaluated among six healthy, 28- to 41 year-old human subjects (four women and two men). The configuration of the optic disc was relatively uniform among the six volunteers with mainly small temporal fiat cups. The Heidelberg software, version 1.11 (Heidel- berg Engineering, Heidelberg, Germany) was used for the present
Table 1 Topographic parame- ters provided by the Heidel- berg Retina Tomograph
Area
Effective area Area below reference Mean radius
Mean height of contour Height variation contour Volume below reference Volume above reference Volume below surface Volume above surface Mean depth in contour
Effective mean depth Maximum depth in contour
Third moment in contour
Total area within the contour line
Total area of those parts within the contour line which are located below the curved surface Total area of those parts within the contour line which are located below the reference plane Mean radius of the contour line
Mean coordinate of the corrected (for crossing vessels) contour line on the axis toward the vitreous
Difference in height between the most elevated
and the most depressed point of the corrected contour line Total volume of those parts within the contour line which are located below the reference plane Total volume of those parts within the contour line which are located above the reference plane Total volume of those parts within the contour line which are located below the curved surface Total volume of those parts within the contour line which are located above the curved surface
Mean depth relative to the curved surface of the whole structure within the contour line (parts located above the curved
surface contribute with a negative value)
Mean depth relative to the curved surface of all parts
within the contour line which are located below the curved surface Mean depth relative to the curved surface
of the 5% picture elements with the highest depth values within the contour line
inter- image CoVar
Compute mean topographic image A
_ L
1 2 3 4 5 6 7 8 9
V A
i
transfer contour line Compute mean topographic image B
IIi
2
3
4
5
6
*
B
II
I
transfer contour line
Compute mean topographic image C
4 1 5 6 7 8 9
transfer contour line Compute mean topographic image D
2 1
3
7
8
9
transfer contour line
intraimage CoVar
transfer contour line
Fig. 1 Description of the experimental procedure in one subject. Nine discrete topographic images were acquired. A total of four mean topographic images were computed from: A all nine discrete images; B the first six of those nine images; C, the last six of those nine images; and D the first three combined with the last three images. A contour line was computed on the mean topographic image generated from the nine discrete topographic images (A). This contour line was then applied to the three other mean topo- graphic images (B-D), using the contour line alignment algorithm in HRT software. Subsequently, the contour line on the mean topo- graphic images was applied to each of the discrete members of the particular image subsets used to compute the mean topographic image, and the topometric data for these discrete topographic im- ages were computed successively for each subset. Prior to process- ing each subset, the contour line on the discrete topographic im- ages was deleted. Consequently, for each one of the nine discrete topographic images, a total of three analyses were obtained: as a member of the nine images (mean topographic image A), and as a member of two subsets of images (mean topographic image B, C, and/or D). The coefficient of variation (CoVar= 1 0 0 × S D / m e a n ) of the topographic parameters within those three analyses was calculated for each discrete topographic image ("intraimage" co- efficient of variation). These values were averaged to obtain an average "intraimage" coefficients of variation (average "intraim- age" CoVar) for each subject and for each topographic parameter. In addition, an "interimage" coefficient of variation ("interimage" CoVar) between the nine discrete topographic images of the data set A was calculated
analysis. After informed consent had been obtained, nine discrete topographic images, numbered sequentially from 1 to 9, were ac- quired with the HRT from the right eye of six healthy, emmetropic subjects in direct sequence, the subjects leaning back in their chair between images. During the imaging, the subjects fixated on a distant target with the left eye. The same scan focus and scan depth was used for all sequential images in a given subject [4]. A i 0 × 10 ° field size was used for the recordings, and all images were ob- tained through an undilated pupil.
For each one of the nine discrete images recorded in each subject, a total of three analyses were obtained. To this end, a total of four mean topographic images were computed for each subject: all nine discrete images (mean topographic image A, images 1-9), the first six of those nine images (mean topographic image B, images 1-6), the last six of those nine images (mean topographic image C, images 4-9), and the first three combined with the last three images (mean topographic image D, images 1-3, 7-9). Each discrete image was part of the mean topographic image containing all nine images and of two additional subgroups containing six images. The experimental procedure is illustrated in Fig. 1. On the mean topographic image including all nine images (A), the region of interest was defined by a contour line to best approximate the margin of the optic disc (inner edge of Elschnig's scleral ring) [9]. This contour line was then applied to the three other mean topo- graphic images (B, C, and D), using the contour line alignment algorithm in the HRT software. Subsequently, the contour line on the mean topographic images was applied to each of the discrete members of the particular image subsets used to compute the mean topographic image, and the topometric data for these dis-
crete topographic images were computed successively for each subset. Prior to processing each subset, the contour line on the discrete topographic images was detected. The same procedure was applied to the nine discrete topographic images for each of the six subjects.
All stereometric measurements with the HRT are made within a region of interest which is enclosed by the contour line. For the evaluation of volumetric parameters, the upper limitation towards the vitreous is provided either by a curved surface which follows the height variation along the contour line [9], or by a planar surface referred to as the reference plane. For parameters defined by the planar reference plane, earlier versions of the HRT software used a plane 320 um below the mean retinal height. The software version 1.11 provides a reference plane 50 gm below the mean height of the contour line beween - 4 and - 10 deg. For the current investigation, this new reference plane was used. The parameters provided by the HRT are described in Table 1.
The design described above provided a total of three analyses on each discrete topographic image: as a member of the nine im- ages (the mean topographic image A), and as a member of two subsets of images (the mean toporaphic image B, C, and/or D). The coefficient of variation (100×SD/mean) among the three analyses on one given discrete topographic image ("intraimage" coefficient of variation) was calculated for each topographic parameter. "Intraimage" coefficients of variation were obtained in all nine images for each topographic parameter for each subject. Average values of these nine "intraimage" coefficients of variation were determined for each subject and for each topographic parameter. Finally, the "intraimage" coefficients of variation ob- tained in all six subjects were average to obtain a mean "intraim- age" coefficient of variation for each topographic parameter. An "interimage" coefficient of variation was calculated with the data from the set with all nine discrete topographic images for each subjects and for each topographic parameter. The "interimage" coefficients of variation obtained in all six subjects were averaged to obtain a mean "interimage" coefficient of variation for each topographic parameter.
Results
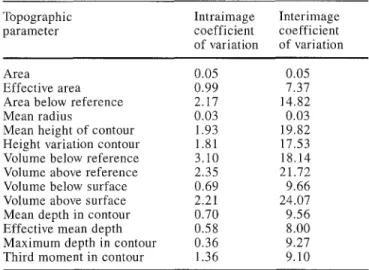
A m o n g the mean topographic images A (each mean to- pographic image A was c o m p u t e d with all nine discrete topographic images acquired on one subject), the mean (_+ SD) standard deviation of the height measurements at a pixel was 31.21 _+4.13 gm. The mean "intraimage" co- efficients of variation and mean "interimage" coeffi- cients of variation obtained for the six subjects are listed in Table 2 for all the topographic parameters. The mean "intraimage" coefficient of variation values ranged be- tween 0.03% and 3.10%. The mean "interimage" coeffi- cient of variation values ranged between 0.03% and 24.07%. A linear correlation between "intraimage" coef- ficients of variation and "interimage" coefficients of variation was statistically highly significant (Pearson's linear correlation factor r2=0.77; P < 0 . 0 0 0 1 ) with a slope of the correlation line of 0.11. A residual analysis showed no outliers and the residuals were normally dis- tributed (Shapiro Wilk's W = 0 . 9 3 ; P = 0 . 2 7 ) . This linear correlations suggests that the interimage variability is approximately ten times higher than the intraimage vari- ability.
Table 2 Average coefficients of variation (100XSD/mean) of to- pometric data within images and between images obtained in nor- mal, emmetrope eyes with the Heidelberg Retina Tomograph Topographic Intraimage Interimage parameter coefficient coefficient of variation of variation
Area 0.05 0.05
Effective area 0.99 7.37
Area below reference 2.17 14.82
Mean radius 0.03 0.03
Mean height of contour 1.93 19.82 Height variation contour 1.81 17.53 Volume below reference 3.10 18.14 Volume above reference 2.35 21.72 Volume below surface 0.69 9.66 Volume above surface 2.21 24.07 Mean depth in contour 0.70 9.56 Effective mean depth 0.58 8.00 Maximum depth in contour 0.36 9.27 Third moment in contour 1.36 9.10
Discussion
In the present study, the variability of topometric data obtained with the H R T from the same topographic im- age, analyzed within different samples of images, has been investigated. The present data indicate that topo- graphic parameters of discrete topographic images are altered by the topographic images included in the analzyed sample, although this alteration seems to be minor compared to the overall variability.
The sources of variability with the H R T are not clear. The cardiac cycle has recently been shown to represent an important source of variability for topographic mea- surements with the H R T [1]. A further important factor which influences the variability of topometric data ob- tained in a sample of topographic images is the misalign- ment between the laser scanner and the patient [8]. The reproducibility of height measurements (standard devia- tion) at a pixel has been reported as 30.1 gm in normal eyes with the H R T [6]. This image acquisition variability plays an important role in subsequent topographic mea- surement variability. Topographic parameters of the op- tic nerve and peripapillary region obtained from sequen- tial images show coefficients of variation ranging be- tween 4.1% and 30.6% in healthy human eyes [7, 9]. The values of "interimage" coefficients of variation observed in the present study compare well with the range of coef- ficients of variation of topographic parameters reported in the literature. The present data show that image acqui- sition variability might be of greater i m p o r t a n c e for the computation of topometric data than the consequences of the variability of the alignment of the contour line. The values in Table 2 suggest that the image acquisition variability is approximately ten times higher than the variability of topometric data obtained from the same
topographic image, analyzed within different samples of images.
I f a contour line, drawn on a m e a n topographic image, is transferred onto the discrete topographic images, the t o p o m e t r i c data c o m p u t e d on those images are obviously affected by the discrete topograhic images included to c o m p u t e the m e a n topographic image. The observed variability of t o p o m e t r i c data on a given topographic image is most probably a consequence of the variability of the alignment of the contour line. Such a variability depends on the images included in the analyzed sample, and might be due to two factors. One factor might be that slight shifts are necessary to align a contour line on a subsequent image. The coordinates of the contour line on the new i m a g e can not be fractions of a pixel. Therefore, an additional shift is necessary for the alignment of the contour line to obtain whole numbers of pixels. Such adjustments induce a slight error during the transfer of the contour line on a new image. B e c a u s e the original contour line was transferred to another m e a n topograph- ic image, prior to alignment on the discrete topographic images, this effect might have been amplified. A n o t h e r factor might be that each discrete topograhic i m a g e in- fluences the height at each i m a g e location in a m e a n topographic image. Therefore, the height along the con- tour of the optic nerve will slightly vary with the differ- ent discrete topographic images included to c o m p u t e the m e a n image. Consequently, the coordinates of the origi- nal contour line will be affected by the transfer on a m e a n topographic i m a g e c o m p u t e d f r o m a subset of dis- crete topographic images. During the subsequent trans- fer onto the discrete topographic images, a slightly dif- ferent contour line will be created for each analyzed sub- set.
The " i n t r a i m a g e " coefficients of variation and the " i n t e r i m a g e " coefficients of variation correlate linearly. Possibly, a high test-retest variability of topographic m e a s u r e m e n t s potentiates the factors responsible for "in- t r a i m a g e " variability. In addition, a high " i n t r a i m a g e " variability, i.e. a high variability in contour line align- ment between sequential images, might cause a high test- retest variability between sequential images. Further- more, it is striking that the " i n t r a i m a g e " coefficients of variation for the three p a r a m e t e r s defined by the planar reference plane range a m o n g the four highest highest values. It can be h y p o t h e s i z e d that the setting of the ref- erence plane, as defined for the H R T software version 1.11, is very sensitive to small shifts during contour line alignment between images. Such an effect might also influence the " i n t e r i m a g e " variability. Indeed, the "in- t e r i m a g e " variability of A r e a below reference and Vol- ume below reference are notably higher than that for cor- responding parameters c o m p u t e d by means of the curved surface. The reason why the variability of Volume above surface is m u c h higher than that of other p a r a m e t e r s de- fined by the curved surface might be that this p a r a m e t e r represents the smallest t o p o m e t r i c value. Indeed, coeffi- cients of variation for small means, in c o m p a r i s o n to the resolution of the m e a s u r e m e n t technique, tend to be higher.
The present data suggest that a high "intraimage" varia- bility, i.e. a high variability in contour line alignment between sequential images, might be an important source of test-retest variability between sequential images. Acknowledgements This study was supported in part by the Schweizerische Stiftung for medizinisch-biologische Stipendien and by National Institutes of Health grant EYO5231.
References
1. Chauhan BC, McCormick TA (1995) Effect of the cardiac cycle on topo- graphic measurements using confocat scanning laser tomography. Graefe's Arch Clin Exp Ophthalmol 233: 568- 572
2. Chauhan BC, LeBlanc RP, Mc- Cormick TA, Rogers JB (1994) Test- retest variability of topographic mea- surements with confocal scanning laser tomography in patients with glaucoma and control subjects. Am J Ophthalmol 118:9-15
3. Dreher AW, Weinreb RN (1991) Accu- racy of topographic measurements in a model eye with the laser tomograph- ic scanner. Invest Ophthalmol Vis Sci 32:2992-2996
4. Hosking SL, Flanagan JG (1996) Prospective study design for the Heidelberg Retina Tomograph: the ef- fect of change in focus setting. Grae- fe's Arch Clin Exp Ophthalmol 234:306-310
5. Kruse FE, Burk RO, Volcker HE, Zin- set G, Harbarth U (1989) Reproduci- bility of topographic measurements of the optic nerve head with laser tomo- graphic scanning. Ophthalmology 96:1320-1324
6. Lusky M, Bosem ME, Weinreb RN (1993) Reproducibility of optic nerve head topography measurements in eyes with undilated pupils. J Glauco- ma 2:104-109
7. Mikelberg FS, Wijsman K, Schulzer M (1993) Reproducibility of topo- graphic parameters obtained with the Heidelberg Retina Tomograph. J Glaucoma 2:101-103
8. Orgfil S, Cioffi GA, Bacon DR, Van Buskirk EM (1996) Sources of vari- ability of topometric data with a scan- ning laser ophthalmoscope. Arch Ophthalmol 114:161-164
9. Rohrschneider K, Burk ROW, V61ker HE (1993) Reproducibility of topo- metric data acquisition in normal and glaucomatous optic nerve heads with the laser tomographic scanner. Grae- fe's Arch Clin Exp Ophthalmol 23:457-564
10. Sommer A, Pollack I, Maumenee AE (1979) Optic disc parameters and on- set of glaucomatous field loss. 1. Methods and progressive changes in disc morphology. Arch Ophthalmol 97:1444-1448
11. Weinreb RN, Lusky M, Bartsch DU, Morsman D (1993) Effect of repeti- tive imaging on topographic measure- ment of the optic nerve head. Arch Ophthalmol 111:636-638