HAL Id: hal-00296111
https://hal.archives-ouvertes.fr/hal-00296111
Submitted on 16 Jan 2007
HAL is a multi-disciplinary open access
archive for the deposit and dissemination of
sci-entific research documents, whether they are
pub-lished or not. The documents may come from
teaching and research institutions in France or
abroad, or from public or private research centers.
L’archive ouverte pluridisciplinaire HAL, est
destinée au dépôt et à la diffusion de documents
scientifiques de niveau recherche, publiés ou non,
émanant des établissements d’enseignement et de
recherche français ou étrangers, des laboratoires
publics ou privés.
efficiencies in the lower free troposphere of Central
Europe
P. Zanis, A. Ganser, C. Zellweger, S. Henne, M. Steinbacher, J. Staehelin
To cite this version:
P. Zanis, A. Ganser, C. Zellweger, S. Henne, M. Steinbacher, et al.. Seasonal variability of measured
ozone production efficiencies in the lower free troposphere of Central Europe. Atmospheric Chemistry
and Physics, European Geosciences Union, 2007, 7 (1), pp.223-236. �hal-00296111�
www.atmos-chem-phys.net/7/223/2007/ © Author(s) 2007. This work is licensed under a Creative Commons License.
Chemistry
and Physics
Seasonal variability of measured ozone production efficiencies in the
lower free troposphere of Central Europe
P. Zanis1,2, A. Ganser3, C. Zellweger4, S. Henne4, M. Steinbacher4, and J. Staehelin3
1Research Centre for Atmospheric Physics and Climatology, Academy of Athens, Athens, Greece
2Department of Meteorology and Climatology, School of Geology, Aristotle University of Thessaloniki, Greece 3Institute for Atmospheric and Climate Science, ETH Zurich, Switzerland
4Swiss Federal Institute for Materials Science and Technology (Empa), Laboratory for Air Pollution/Environmental
Technology, 8600 D¨ubendorf, Switzerland
Received: 9 June 2006 – Published in Atmos. Chem. Phys. Discuss.: 26 September 2006 Revised: 19 December 2006 – Accepted: 20 December 2006 – Published: 16 January 2007
Abstract. In this study we present the seasonal variabil-ity of ozone production efficiencies (EN), defined as the
net number of ozone molecules produced per molecule of nitrogen oxides (nitrogen oxide (NO) + nitrogen diox-ide (NO2)=NOx) oxidized to NOz (total reactive nitro-gen (NOy)–NOx) determined from field measurements of a
seven-year period (1998–2004) at the Swiss high-alpine re-search station Jungfraujoch (JFJ), 3580 m a.s.l. This dataset is a unique long-term data series of nitrogen levels in the free troposphere over Central Europe and hence it offers an ex-cellent opportunity to perform such an analysis and provide further evidence to the photochemical origin of the ozone spring maximum at locations of the northern hemisphere dis-tant from nearby pollution sources. Experimentally derived daily EN values have been selected for 571 days out of the
2557 days from 1998 to 2004, from which an average ozone production efficiency of 18.8±1.3 molecules of O3produced
per molecule of NOx oxidized was calculated. This value
indicates the great potential and importance of photochem-ical ozone production in the free troposphere. The monthly means of experimentally derived daily ENvalues show a
sea-sonal variation with lower values from May to August, which can be probably attributed to more efficient vertical transport of polluted air masses from the atmospheric boundary layer up to JFJ. In agreement, theoretically derived monthly EN
values show similar seasonal variation. The ratio NOy/CO,
a parameter to assess the aging process that has occurred in an air parcel, was used as a criterion to disaggregate the 571 selected days between undisturbed and disturbed free tropo-spheric (FT). The monthly means of experimentally derived
EN values for the undisturbed FT conditions show a distinct
seasonal cycle with higher values in the cold season from
Correspondence to: P. Zanis
(pzanis@geol.uoa.gr)
November to April. The ENvalues for undisturbed FT
con-ditions are particularly higher than the respective monthly
ENvalues for disturbed FT conditions from February to
Oc-tober. It should be noted that the monthly EN values of
March (EN=35.8) and April (EN=34.9) are among the
high-est values throughout the year for undisturbed FT conditions at JFJ. These results highlight the key and possibly the domi-nant role for photochemistry in the observed build-up of tro-pospheric ozone in the winter-spring transition period.
1 Introduction
Over the last couple of decades it has become apparent that the measured annual cycle of ozone in certain loca-tions of the northern hemisphere, distant from nearby pol-lution sources, shows a distinct maximum during spring. The magnitude of this maximum also seems to have in-creased with time (Monks, 2000). There has been much de-bate as to the origins of this phenomenon and on the rela-tive contribution from photochemistry and stratospheric in-trusions (Davies and Schuepbach, 1994; Stohl et al., 2003 and references therein). Nowadays, there is broad agree-ment that photochemistry is the major contributor to the ob-served background ozone levels in the troposphere (Penkett, 1988; Crutzen et al., 1999; Lelieveld and Dentener, 2000). According to the existing photochemical theory the relative importance of ozone production and loss processes in the remote troposphere is highly sensitive to competition be-tween reaction of peroxy radicals with NO and cross- or self-reactions of the peroxy radicals, hence the local NOx and
peroxy radical concentrations (e.g. Crutzen, 1988). At very low NOxconcentrations (“clean” atmosphere) the conditions
near-ultraviolet light and due to reactions of O3, with HO2
and OH, whereas when NOxis larger than around 50 pptv the
tendency is to have net ozone production as oxidation of NO to NO2by peroxy radicals dominates over the ozone loss
pro-cesses (Crutzen, 1988; Penkett, 1988). This theory has been subject to intense investigation due to the observed ozone in-crease in the troposphere of the Northern Hemisphere over the last century as a result of increased anthropogenic emis-sions of ozone precursors (Volz-Thomas and Kley, 1988; Staehelin et al., 1994). In contrast, there is still no over-arching consensus as to the mechanisms that lead to the for-mation of the spring ozone maximum, although a number of chemical theories were developed to explain the observed spring ozone maximum in the free troposphere (FT) of the Northern mid-latitudes (Penkett and Brice, 1986; Liu et al., 1987; Yienger et al., 1999; Monks, 2000).
Ozone in the remote free troposphere has a longer lifetime, which enables transport from regional to hemispheric scale and hence proportionally greater influence on climate than ozone near the surface (Lacis et al., 1990). Therefore, mea-surements in the free troposphere of the relevant trace gases such as NOx, NOy, CO, CH4, VOCs and H2O that control
the ozone abundances are essential for our understanding. It should be noted that such measurements are sparse compared to boundary layer data (Zellweger et al., 2003). Nitrogen ox-ides (NOx=NO+NO2) are the limiting precursors for O3
pro-duction throughout most of the troposphere, and also directly influence the abundance of the hydroxyl radical concentra-tion in the troposphere (e.g. Crutzen, 1988). Emissions of reactive nitrogen species occur primarily as NO, followed by oxidation to NO2. Reactive nitrogen (NOy) is defined as the
sum of NOx and its atmospheric oxidation products (NOz)
including N-containing particulates. The lifetime of NOx
before photochemical conversion to NOz is less than a day
in summer at mid-latitudes (Logan, 1983). NOz comprises
mostly peroxyacetylnitrate (PAN) and nitric acid (HNO3),
along with HNO4, N2O5, NO3and other PAN homologues
(PANs) and organic nitrates (Emmons et al., 1997). The rel-ative abundance of the components of NOy varies
signifi-cantly. For instance, NO2is often dominant close to sources,
while PAN tends to be the most abundant constituent in re-gionally polluted air masses where there is more active or-ganic photochemistry and inoror-ganic nitrates are most abun-dant in more remote areas of the troposphere (Zellweger et al., 2003).
A common index to estimate the ozone production in pol-luted areas as well as the clean free troposphere, is the ra-tio 1O3/1NOz, where NOz=(NOy–NOx) is the sum of NOx
oxidation products. This index, known as the ozone produc-tion efficiency (EN), describes the number of O3molecules
chemically produced per molecule of NOxoxidized to NOz
(Liu et al., 1987) and has been estimated from 1O3/1(NOz)
ratios (Sillman et al., 1990; Trainer et al., 1993; Olszyna et al., 1994; Carpenter et al., 2000; Rickard et al., 2002, and references therein). Values of ENcan be estimated from the
slope of O3versus NOz plots, whilst the ordinate intercepts
of such plots have been interpreted as the “background” level of ozone. Estimates of the amount of ozone formed in a par-ticular region can then be deduced from ENand known NOx
emissions (Liu et al., 1987). ENdepends on the NMHC/NOx
ratio as well as UV radiation, water vapour, and the ozone concentration itself. However, at NOxvalues less than a few
parts per billion by volume, O3formation is NOxlimited (Liu
et al., 1987) and therefore independent of hydrocarbon con-centrations. The ozone production efficiency decreases when NOx mixing ratios reach higher values than approximately
500 pptv (Liu et al., 1987).
Generally, 1O3/1NOzprovides an upper limit for EN
be-cause HNO3 (one of the major contributors to NOz) is wet
and dry deposited more rapidly than O3, while another
lim-itation is the mixing of different air masses before arriving at the measuring site (Nunnermacker et al., 1998). Several factors can reduce the calculated EN value for FT air. For
example, mixing with boundary layer air will decrease O3
and increase NOx and NOy mixing ratios, which results in
lower EN values. PAN formation may also reduce EN
val-ues. Simulations of an air mass that was initialized with a mix of boundary layer and FT air at the altitude of the JFJ un-der summer time conditions, showed that NOxre-formation
from PAN is the main source of NOxin the FT, even if an
air mass remains at constant altitude (Henne et al., 2005b). Hence EN values at JFJ during summer time can be clearly
affected by PAN formation. However, PAN decomposition is temperature dependent and hence seasonally dependent. For example during FREETEX ’98 in early spring, it was shown that PAN decomposition did not contribute to NOxat JFJ, as
well as that PAN formation has minimal effect on EN
val-ues at JFJ (Carpenter et al., 2000). Instead, oxidation of NOx
to PNA (HO2NO2) may result in reducing the derived EN
values during spring at JFJ (Carpenter et al., 2000). PNA formation usually is not an important process in the surface layer because it rapidly thermally decomposes. However, the lifetime of PNA at −10◦C is sufficient to allow the build-up of its daytime concentration to tens of parts per trillion by volume. During summer JFJ conditions, PNA does not play a significant role, since temperatures are about 0◦C (Henne et al., 2005b). Furthermore, HNO3 scavenging is slow in
the upper troposphere, so that 1O3/1NOzshould provide a
rather good estimate of the true ozone production potential in the FT.
EN has been extensively investigated in recent years by
researchers in the United States and Canada, but fewer ies have been carried out in Europe. Furthermore, few stud-ies exist referring to EN determinations in the FT, which are
mainly based on aircraft measurements in air masses trans-ported downwind of pollution sources, and even fewer on the seasonal variability of EN. An overview of previous EN
determinations can be found in Rickard et al. (2002). As far as it concerns previous published work on the season-ality of EN, there is sparseness of detailed studies. Based
on box model calculations for sea level mid-latitudes Liu et al. (1987) found similar EN values for summer and winter
above approximately 100 pptv of NOx. Hirsch et al. (1996)
showed from 4-year measurements at a rural and forested site at Harvard Forest, Massachusetts, that EN increases from 4
in May to 8 in June-July and gradually decreases back to 4 by early October, attributing this seasonal trend to onset of bio-genic emission of isoprene. The variation of ENwith NOxas
measured during three intensive field campaigns at two Euro-pean coastal sites (Mace Head, Ireland and Weybourne, UK) suggests that ozone production efficiency is relatively insen-sitive to both geographical location and season (Rickard et al., 2002).
In this study we present the seasonal variability of ozone productions efficiencies (EN), which have been calculated
from observed 1O3/1NOz ratios for disturbed and
undis-turbed FT conditions based on continuous measurements of NO, NO2, NOy, O3and CO carried out regularly for a
seven-year period (1998–2004) at the Swiss high-alpine research station Jungfraujoch (JFJ), 3580 m a.s.l.
2 Data and methods
2.1 Site description and characteristics
The Jungfraujoch (JFJ) Observatory (7.98 E/46.55 N) is lo-cated in the Swiss Alps, on a ridge extending from south-west to north-east, at an elevation of 3580 m a.s.l. To the north, the slope drops steeply down to 2000 m in a hori-zontal distance of 2–3 km. The great Aletsch glacier with a length of 22 km lies to the south of this rocky ridge. JFJ is located, in winter and often in spring and autumn, in the lower FT, whereas there is clear influence from the plane-tary boundary layer (PBL) at least during daytime in summer when convective activity is enhanced (Baltensperger et al., 1997; Lugauer et al., 1998; DeWekker et al., 2004). Henne et al. (2005a) quantified the amount of ABL air in the lee of the Alps to be about 25% at 3500 m MSL for fair weather days during the warm season which can be seen as an upper limit for JFJ, being located in the center of the Alps. Hence, chemical and meteorological criteria are essential to distin-guish between free tropospheric conditions and air masses disturbed by pollution sources (Br¨onnimann, 1999; Lugauer et al., 2000; Nyeki et al., 2000; Zellweger et al., 2000, 2003; Carpenter et al., 2000; Forrer et al., 2000; Schuepbach et al., 2001; DeWekker et al., 2004; Henne et al., 2004).
2.2 Data and filtering
Because the instrumental details have already been described elsewhere (Zellweger et al., 2000) only a brief summary of experimental aspects is presented here. Total NOy
mea-surements commenced in March 1997 at the JFJ, while the measurements of NO and NO2 started in June 1991. NO,
NOx and NOy were measured with a commercially
avail-able instrument (CraNOx, Ecophysics) using two chemilu-minescence detectors (CLD 770 AL pptv) with temperature-controlled reaction chambers. NOx was measured as NO
after photolytic conversion (PLC 760). NOy species were
converted on a heated gold catalyst (300◦C) with 2% CO (99.997%, Messer-Griesheim GmbH) as a reducing agent. The instrumental detection limit for NO, NO2and NOywas
50 pptv for 2 min and 20 pptv for 30 min average values, re-spectively. Overall uncertainties in the measurements were estimated to be ±5% for NO, ±10% for NO2 and ±9%
for NOy at ambient levels of 500 pptv (1σ ). During the
FREETEX 1998 field campaign NOx and NOy were
mea-sured independently by University of East Anglia (UEA) using a custom-built Cranox system and the agreement be-tween the UEA and EMPA NOxand NOy data was within
about 10% (Carpenter et al., 2000; Zellweger et al., 2000). Both CO and O3were continuously monitored with
commer-cially available instruments by the Swiss National Air Pol-lution Monitoring Network (NABEL) (APMA-360, Horiba, for CO; Thermo Environmental Instruments, Model 49C, for O3). The detection limit was 30 ppbv for CO and 0.5 ppbv for
O3 (30 min average). More detailed information including
measurement uncertainties and the calibration procedure can be found in Zellweger et al. (2000). Finally the meteorolog-ical measurements including wind speed and direction, rela-tive humidity, temperature, global radiation and atmospheric pressure at JFJ were provided by MeteoSwiss, Z¨urich.
The use of filters at the JFJ (and other measurement sites) is crucial for the interpretation of data from such measure-ment sites. Carpenter et al. (2000) and Zanis et al. (2000a) used filters based on chemical parameters to select clean free tropospheric days during the FREETEX ’98 campaign, while Schuepbach et al. (2001) performed a filtering anal-ysis for the long-term ozone record at JFJ using the wind sector and speed in association with a night-time window as filters. There are also a number of studies in which filters based mainly on meteorological parameters were used to dis-criminate between undisturbed (i.e. clean) and disturbed (i.e. influenced by regional pollution sources) free tropospheric conditions at the JFJ (Lugauer et al., 1998, 2000; Forrer et al., 2000; Zellweger et al., 2003; Henne et al., 2005a; Henne et al., 2005b). Zellweger et al. (2003) suggested that an alter-native parameter to assess the aging process that has occurred in an air parcel is the NOy/CO ratio, which accounts for both
deposition and dilution effects. The relationship between CO and NOywas previously used to assess anthropogenic input
to air masses by Parrish et al. (1991). Close to anthropogenic sources, the NOy/CO ratio averages ∼0.1, whereas values
of ∼0.005 are observed in the upper troposphere (Jaegl´e et al., 1998). This is in line with recent findings of Stohl et al. (2002) where the original emission ratio between NOy
and CO was assumed to be 0.16. This ratio dropped to val-ues below 0.01 for air masses older than four days in the continental outflow region of North America. However, it
should be noted that the NOy/CO ratio also shows a seasonal
variation, with lower values during the winter months due to a longer lifetime of CO.
Zellweger et al. (2003) showed from NOy and CO
mea-surements at JFJ from April 1997 to March 1999 that undis-turbed FT conditions are always accompanied by the low-est NOy/CO ratios, indicating advanced aging of these air
masses. The NOy/CO filter works well for excluding days
affected by thermally induced transport up to JFJ, because the vertical gradient of NOy is usually much more
pro-nounced compared to CO in a continental location. Other upslope transport processes which can influence the JFJ site include Foehn (both north and south), and synoptical lift-ing. These processes are often associated with precipitation, which potentially scavenges some NOyspecies (HNO3,
par-ticulate nitrate). This scavenging will lower the NOy/CO
ra-tio, and it could then be misinterpreted as free tropospheric air masses. However, due to its location in a continental area, the pronounced vertical gradients of NOy species
fa-vor higher NOy/CO ratios even during periods with potential
precipitation scavenging. For example, south Foehn events during spring and autumn were always associated with high NOy/CO ratios (Zellweger et al., 2003), despite precipitation
loss of NOy. Furthermore, cloud processing itself without the
presence of precipitation should not influence the NOy/CO
ratio as it will maybe reduce the HNO3, but not the total
ni-trate content. Particulate nini-trate is also measured as NOy
with the experimental setup at JFJ. This ratio is therefore viewed as suitable method to distinguish between disturbed and undisturbed FT conditions at the JFJ and hence is used in the current analysis.
In order to confirm the validity of the NOy/CO filter for
se-lecting undisturbed FT conditions in our study we used other commonly used meteorological indices for filtering such as the weather type of the Alpine Weather Statistics (AWS) (Sch¨uepp, 1979; Wanner et al., 1998), the “sun” day index (SND) and the “radiation” day index (RAD) to identify fair weather conditions that favour thermal convection (Henne et al., 2005a) as well as the indication for South or North Foehn events (Forrer et al., 2000). The aim was to cross-check the distribution of AWS, SND and RAD indices for se-lected undisturbed FT days accompanied by the lowest quar-tile NOy/CO ratio values (<1st quartile).
According to Sch¨uepp’s weather classification in AWS a region of 444 km in diameter over the central Alps is consid-ered and each day is attributed to a specific synoptic weather type based on a number of meteorological parameters includ-ing the surface pressure and the 500 hPa heights (Sch¨uepp, 1979). There are 40 weather types in AWS which can be sorted out into three large categories (Convective, Advec-tive and Mixed). The ConvecAdvec-tive category has three sub-categories, anticyclonic (A), indifferent (I) and cyclonic (C), while Advective category has four sub-categories, West (W), North (N), East (E), and South (S).
The SND and RAD indices are based on data from the au-tomated MeteoSwiss surface station network on both sides of the Alps covering the whole Swiss plateau in the west–east direction and the Ticino area south of the Alps (Henne et al., 2005a). If the total sunshine duration per day was larger than 9 h for at least 50% of the stations in the north and 50% of the stations in the south, a day was categorized as being a “sun day” (SND). If the total amount of incoming solar radiation per day to the earth’s surface was larger than 19 MJ m−2 at more than 50% of the stations in the north and south, a day was categorized as being a “radiation day” (RAD). Atmo-spheric conditions on days selected by RAD and SND index can be seen as necessary conditions to create thermally in-duced up-slope flow. However, undisturbed FT conditions might still be present at high altitudes, if mixing and up-slope transport was limited to lower altitudes.
Concerning the relation between AWS classification and the selected undisturbed FT days accompanied by the low-est quartile NOy/CO ratio values it was found that 33% of
the days were Anticyclonic, 35% were Indiferent, 26% were Advective (N,W,S,E), 4% were Mixed and only 2% were Cy-clonic. As far as it concerns the SND and RAD criteria 22% of the selected days were classified as sun days and 27% as radiation days. Furthermore, only 13% of the selected undis-turbed FT days (17 days) were fulfilling simultaneously the criteria of a sun day, radiation day and anticyclonic or indif-ferent day which are days that can be potentially affected by thermal convection. Among these 17 days, 14 days were dur-ing the warm period from May to September when thermally induced convective activity is enhanced at JFJ. These 14 days account for 19% of the selected days within the period from May to September. Hence the NOy/CO filter worked
rela-tively well in excluding days which have a high potential to be affected by thermal convection from ABL.
Finally out of the selected undisturbed FT days accom-panied by the lowest quartile NOy/CO ratio values only 5%
can be potentially affected by Foehn events and only 2% by cyclonic synoptic systems which are weather conditions that favor precipitation. This implies the limited influence of pre-cipitation on ENcalculation for the selected undisturbed FT
days.
2.3 Observed and steady state calculations of EN
Using the whole dataset (1998–2004), ozone production effi-ciencies (EN) have been calculated on a daily basis for
day-time periods. Specifically, 30 min averages of O3and NOz
values were used from 8 AM to 8 PM (UTC) to determine the slope of O3versus NOzfor each individual day from the
2557 days between 1998 and 2004. An example of the cal-culation of a daily EN value is illustrated in Fig. 1 for date
24/07/2003. This is a day with a low EN value of 5.9 as
calculated from the slope of simple linear regression line (or 6.3 based on the organic correlation method that takes into account the uncertainties in both axes) which might be
asso-ciated with transport of relatively freshly polluted air masses up to the JFJ. The calculated daily ENvalues were only used
for the subsequent analyses if the following criteria were ful-filled. First, concurrent measurements of O3, NOx, NOyand
CO were available for the individual days. With this first cri-terion 2120 days were selected out of the 2557 days. Second, the correlation coefficient between O3and NOzexceeded the
value of +0.5. With this second criterion 617 days were se-lected. Third, the regression coefficient 1O3/1NOz of O3
versus NOz, which corresponds to the EN, was statistically
significant at the 95% level. With this third criterion 598 days were selected. Finally, the calculated daily EN values,
which were outside the range of the average of all daily EN
values ±2σ , were considered as outliers and have been ex-cluded from further analysis. With the above criteria 571 out of 2557 days have been selected for further analysis from 1998 to 2004.
The selection criteria deduce EN values which are biased
towards those conditions that give better than average regres-sion fits thus eliminating days with low photochemical ac-tivity and days with net ozone loss. However, the fact that 75% of the days do not meet the above criteria does not nec-essarily imply that there is no ozone production for these days because possibly transport processes mask photochem-istry. For example during winter when the ozone lifetime is longer compared to summer we have fewer days fulfilling the above criteria. Furthermore, there is a significant number of days (429) with negative correlation between O3and NOz
(ρ<−0.5) which can be partly related to downward transport from the upper troposphere/lower stratosphere. Days with net ozone chemical loss cannot be disregarded as a possibil-ity at JFJ especially when NOxlevels are lower than about
50 pptv but such days were rarely found. For example based on measurements of peroxy radicals and other relevant chem-ical species and photochemchem-ical parameters at JFJ, positive net ozone production rates were calculated in the vast ma-jority of the days during FREETEX ’98 (from mid-March to mid-April) ranging from around 0.1 ppbv h−1 on relatively clean days to more than 1 ppbv h−1 on relatively polluted days (Zanis et al., 2000a). Positive net ozone production rates were also calculated from observations during FREE-TEX ’96 April to mid-May) and FREEFREE-TEX ’01 (mid-February to mid-March) (Zanis et al., 2003).
Zanis et al. (2000b) have shown that for low and mid-NOx
conditions typical for JFJ, the important peroxy/hydroxyl radical ratio can be expressed by an empirical equation, which takes account of radical recombination and inter-conversion through O3, as well as NOxprocesses, although
it ignores NMHC chemistry: [HO2+CH3O2]
[OH] =
kOH+CO·[CO] + kOH+CH4·[CH4] + kOH+O3·[O3]
kHO2+NO·[NO] + kHO2+O3·[O3] + 2 ·
p
k′·k · j(O1D) · [O 3]
(1)
Fig. 1. Scatter plot of half-hourly averages of O3versus NOzat JFJ
from 8 AM to 8 PM (UTC) on 24/07/2003.
It has been shown that the ratio HO2+CH3O2/OH,
calcu-lated with the empirical expression (1), approximates the ra-tio calculated by a CO-CH4photochemical box model very
well for the whole range of NO concentrations (Zanis et al., 2000b). The required values of O3, CO, NO, NO2,
temper-ature, H2O, and pressure in Eq. (1) were based on the
ob-servations. All the necessary kinetic data for the calculation of the rate constants are based on Sander et al. (2003). A methane (CH4) mixing ratio of 1800 ppbv was assumed in
Eq. (1). The ozone photolysis rate j(O1D) for the 15th of each month was calculated by the HARWELL radiative transfer model (Hough, 1988). The Harwell radiative transfer model has been adjusted for the conditions at the JFJ by setting the ground at 3 km, and using a surface albedo of 0.65. The co-efficient k′ is a composite rate constant made up from the individual rate constants of the self- and cross-reactions for HO2 and CH3O2and f is the proportion of O1D which
re-acts with water vapor. The moles of ozone produced from solely CO and CH4chemistry [PO3] per mole of NOx
oxi-dized [RNOx] can thus be estimated by multiplying Eq. (1)
by kHO2+NO[NO]/kOH+NO2+M[NO2]:
EN= [PO3] [RNOx] = kHO2+NO·[NO] kOH+NO2+M·[NO2] ·
kOH+CO·[CO] + kOH+CH4 ·[CH4] + kOH+O3·[O3]
kHO2+NO·[NO] + kHO2+O3 ·[O3] + 2 ·
p
k′·f · j(O1D) · [O 3]
(2)
Carpenter et al. (2000) have used Eq. (2) to calculate a EN
value for typical mid- to low-NOx conditions often
expe-rienced at the JFJ research station, in free tropospheric air masses. It should be noted that Eq. (2) does not include the effects of PAN and PNA formation which may reduce EN
values as discussed in Sect. 1. Sensitivity analysis of Eq. (2) for typical JFJ conditions throughout the year revealed that
EN is mainly sensitive to NO and NO2. For example, 20%
increase in NO2, NO, O3, CH4, and CO, result to percentage
Fig. 2. Median monthly values of NOx, NOy, NOz, CO and O3at
JFJ over the whole period between 1998 and 2004.
respectively, while ENis almost insensitive to H2O, pressure
and j(O1D). We have also evaluated that an increase of 20% in temperature results to a percentage change of EN of 1%
directly from Eq. (3) and 2–3% through the temperature de-pendence of the NO/NO2ratio.
3 Results and discussion
3.1 An overview of the measurements at JFJ from 1998 to 2004
An overview of monthly median values of NOx, NOy, NOz,
CO and O3over the whole period 1998–2004 without any
filter is given in Fig. 2. The monthly medians in Fig. 2 were calculated from all data throughout a day but the result is similar if we use only the daytime data from 8 AM to 8 PM. Generally, as it is shown in Fig. 2, O3displays a broad
spring-summer maximum from April to August peaking in May. The broad spring-summer maximum at the JFJ has been pre-viously reported by Schuepbach et al. (2001) while a similar seasonality has been also reported based on surface ozone measurements at Arosa, Switzerland (Staehelin et al., 1994) and on ozonesonde measurements in the lower FT at Pay-erne, Switzerland (Staehelin and Schmid, 1991). The May peak in O3is evidenced in the monthly means of 5 individual
years out of the 7 years of measurements from 1998 to 2004 while in 1999 there is an ozone peak in April and in 2003 there is an ozone peak in August (see Fig. 3). The ozone peak in August 2003 corresponds to the record-breaking heat wave affecting the European continent in summer 2003 (Sch¨ar et al., 2004; Ordonez et al., 2005). Higher CO mixing ratios are observed during the cold season from November to April due to the longer lifetime of CO (Fig. 2). Interestingly, CO consistently peaks in April for the whole period from 1998 to 2004 as illustrated in Fig. 3 although considering the lifetime of CO the maximum would rather be expected in mid-winter. Concerning NOy, higher concentrations were observed at
the JFJ from April to August peaking in April (Fig. 2). This
Fig. 3. Individual monthly mean values of NOx, NOy, CO and O3
at JFJ from 1998 to 2004.
April peak in NOyis observed in the monthly means of 5
in-dividual years from the 7 years of measurements from 1998 to 2004 (Fig. 3). The NOy peak in August 2003 may be
explained as for O3 by the heat wave affecting the
Euro-pean continent. Generally, the higher NOy concentrations
during the warm season from late spring to early autumn were attributed to enhanced vertical transport processes dur-ing these seasons (Zellweger et al., 2000). The monthly NOz
concentrations show similar seasonal variability with NOy
concentrations indicating the dominant role of NOzin NOy
partitioning. Concerning the NOy partitioning, Zellweger
et al. (2003) showed that PAN was found to be the domi-nant NOyspecies during spring and summer, NO2was most
abundant during autumn and winter, whereas particulate ni-trate was found to contribute significantly to total NOyduring
thermally induced vertical transport.
The monthly median NOxconcentrations in Fig. 2 show a
peak value in April but do not reveal a distinct seasonal pat-tern. This is possibly due to the opposite effect of two pro-cesses; the thermally induced vertical transport that peaks in summer and vents fresh pollution into the FT and the chemi-cal lifetime of NOxthat is significantly longer in winter (Liu
et al., 1987). The monthly means of NOxconcentrations for
each individual year between 1998 and 2004 reveal primary and secondary peak concentrations in April and November for 5 years out of the 7 years of measurements while for the other two years peak concentrations are present in March and October. It should be noted that the monthly mean values of NOxand NOywere often found to be a factor of two or
more higher than the corresponding median values due to the occurrence of relatively short episodes with high concentra-tions, which can be attributed to periods with transport of polluted air masses from source regions to the JFJ caused by various meteorological processes (Zellweger et al., 2000).
A striking feature, as inferred from Fig. 2 and Fig. 3, is the monthly peak values of NOy, NOz, and NOx in April,
which is a consistent feature for most of the individual years between 1998 and 2004 in accordance with what it is also
Fig. 4. Scatter plot of monthly means of O3versus NOzat JFJ from
1998 to 2004.
observed for CO. In contrast, the period when thermally induced vertical transport gets more efficient is the warm period from May to September with the highest potential in July and August (Lugauer et al., 1998; Henne et al., 2005a). This implies that presumably other transport pro-cesses of polluted air masses from regional to hemispheric scale can account for the April peak in NOy, NOxand CO at
JFJ in combination with the relatively longer chemical life-time of these species in early spring compared to summer. The NOydata from 1996 to 2001 at Zugspitze (not shown
here), Germany (World Data Centre for Greenhouse Gases; http://gaw.kishou.go.jp/wdcgg.html) also reveal a clear mean seasonal cycle with peak in April in agreement with JFJ con-firming the theory of larger scale processes. In addition, Pen-kett and Brice (1986) based on the analysis of PAN measure-ments showed a large PAN increase in background North-ern Hemisphere air during springtime and developed a the-ory to explain the observed spring ozone maximum in the FT since PAN is an excellent tracer of the photochemical activ-ity. It should be also noted that the seasonal variation of the frequency of south Foehn events from April 1997 to March 1999 at JFJ shows a peak in April (Zellweger et al., 2003) while Campana et al. (2005) reported enhanced O3and NOy
levels at Arosa during south Foehn events in spring.
Figure 4 shows the monthly means of O3 versus NOz at
JFJ from 1998 to 2004. The explained variance is 62% while the regression coefficient 1O3/1NOzfrom the scatter of O3
versus NOzis 21.5±1.9. A prerequisite for the calculation of EN is to follow the same air mass from the source to the
re-ceptor. The estimate of 1O3/1NOz from Fig. 4, although
it assumes different air masses with different background ozone mixing ratios throughout the year, reflects the an-nual average ozone production efficiency at JFJ and indicates the great potential and importance of photochemical ozone production in the FT. The intercept reflecting the present time background ozone on which photochemistry builds on throughout the year is estimated to be 40.7±1.2 ppbv and
Fig. 5. Scatter plot of the experimentally derived daily values of
EN (1O3/1NOz) versus the respective daily values of the ratio NOy/CO for the 571 selected days between 1998 and 2004
fol-lowing the selection criteria described in Section 2.3. The black solid line denotes a theoretical curve of EN values calculated by the steady state Eq. (2) for varying NOy/CO by setting the
lev-els of O3 (median 54.6 ppbv), CO (median 140 ppbv), H2O
(me-dian 3.0 g/kg), temperature (me(me-dian −4.8◦C), pressure (median 657.1 hPa), NO/NOx(median 0.20) and NOx/NOy(median 0.20) to their median values from the 571 days selected days. The dot-ted and dashed lines denote the respective theoretical ENvalues by setting the ratio NOx/NOyto their 1st quartile value (0.13) and 3rd quartile value (0.31) from the 571 selected days (instead of their median values) while keeping all the other variables (O3, CO, H2O,
temperature, pressure) constant to their median values.
compares well to winter ozone concentrations at JFJ.
3.2 Selected daily values of EN
The daily EN values derived from the slope (1O3/1NOz)
for 571 days, selected out of the 2557 days from 1998 to 2004 following the selection criteria described in Sect. 2.3 give an average ozone production efficiency of 18.8±1.3 (the error bar denotes the 95% confidence interval), which is com-parable with the EN value of 21.5±1.9 derived from the
monthly means of O3 and NOz at JFJ from 1998 to 2004
shown in Fig. 4. However, Fig. 5 shows that there is large scatter of these experimentally derived daily ENvalues
rang-ing from 1 to 72 molecules of O3produced per molecule of
NOxoxidized to NOz, which shows the influence of both free
tropospheric and polluted air masses with different chemi-cal composition and aging at the JFJ. In previous published work, Carpenter et al. (2000), based on a 5-week observa-tion of O3/NOz ratios during FREETEX ’98 at
Jungfrau-joch in March and April, derived EN values of about 20
to 30 molecules of O3produced per NO2molecule oxidised
in free tropospheric conditions while a EN value of about 4
was calculated in photochemically aged air from South Eu-rope. Pr´evˆot et al. (1997), based on aircraft measurements in the Swiss Alps as part of the POLLUMET study, calculated
Fig. 6. Seasonal variation of monthly means of experimentally
de-rived EN (1O3/1NOz) values and of the intercept along with the monthly means of the respective NOy/CO values. The frequency
of the selected days per month, for which daily values of ENwere experimentally derived following the selection criteria described in Sect. 2.3, are also superimposed with grey column bars. Theoreti-cally derived (modelled) monthly ENvalues are also demonstrated with open pink triangles. The theoretical ENvalues were calculated from the steady state Eq. (2) by setting the levels of NO, NO2, O3,
CO, H2O, temperature and pressure to their median monthly values
from the 571 days selected days between 1998 and 2004 follow-ing the selection criteria described in Sect. 2.3. The error bars on the monthly means of experimentally derived ENdenote their 95% confidence interval. The error bars on the theoretical EN values denote their 10% sensitivity to the median value.
close to the NOx/VOC limiting transition point. Thielmann
et al. (2002) based on field measurements in the Italian Po basin derived EN values at a rural station as low as 2.5 for
air masses advected from Milan, Italy. Chin at al. (1994) re-ported a mean O3production efficiency in the U.S. boundary
layer of 5.5 with values being more than 2 times higher in the western United States (9.1) compared to the east (4.2) due to lower NOxconcentrations in the west. Based on
mea-surements from three intensive field campaigns at two Euro-pean coastal sites (Mace Head, Ireland and Weybourne, UK) it was shown that the calculated ozone production efficiency in clean oceanic air masses was approximately 65, which was in contrast to values between 4 and 6 for more polluted air masses from the U.K. and continental Europe (Rickard et al., 2002).
It was pointed out in Sect. 2.2 that the NOy/CO ratio
could be used as an alternative suitable method to distinguish between disturbed FT conditions (air masses influenced by recent emissions) and undisturbed FT conditions (aged air masses) at the JFJ. The experimentally derived daily EN
val-ues versus the respective daily valval-ues of the ratio NOy/CO
show a general decreasing exponential trend in EN with
in-creasing NOy/CO (Fig. 5) which is in agreement with
pre-vious studies which have shown the exponential decrease of
EN as NOxlevels increase (e.g. Liu et al., 1987; Carpenter
et al., 2000; Rickard et al., 2002). Caution must be
exer-cised in the implication of photochemistry in such correla-tions, because a relationship would also be expected if O3
and NOz were exported from a common source and
conse-quently diluted. However, if this were the case, the O3/NOz
ratio would not be expected to change, whereas Fig. 5 reveals the expected decrease of EN with concentration of oxidized
nitrogen. It should also be noted that for the vast majority of the daily values the NOy/CO ratio is lower than 0.01. Stohl
et al. (2002) reported that the NOy/CO ratio dropped to
values below 0.01 for air masses older than four days in the continental outflow region of North America, where warm conveyer belts are responsible for the vertical lifting of pol-lutants.
Theoretical values of EN were calculated by the steady
state Eq. (2) for varying NOy/CO by setting the levels of O3,
CO, H2O, temperature, pressure, NO/NOx and NOx/NOy
to their median values from the measurements carried out at JFJ from 1998 to 2004. These theoretically derived EN
values for varying NOy/CO levels are shown with a black
solid line in Fig. 5, which compares rather well with the gen-eral decreasing exponential trend from the experimentally derived EN values. Nevertheless, the experimentally
de-rived ENvalues show a scatter around the theoretical curve.
Since EN is mainly sensitive to NO and NO2as pointed in
Sect. 2.3, in order to illustrate uncertainty of the theoreti-cally derived EN curve, we calculated EN values from the
steady state Eq. (2) for varying NOy/CO by setting the ratios
NO/NOxand NOx/NOyto their 1st and 3rd quartile values of
the 1998–2004 record (instead of their median values) while keeping all the other variables (O3, CO, H2O, temperature,
pressure) constant at their median values. The ENvalues for
1st and 3rd quartiles are displayed as dashed lines in Fig. 5. While the theoretical values cover most of the higher EN
val-ues, most of the lower EN cases are not covered by the
the-oretical estimation which might be attributed to the fact that PAN and PNA formation can lower the EN values but their
influence is not included in Eq. (2).
3.3 Seasonality of ENwith respect to undisturbed and
dis-turbed FT conditions
The experimentally derived daily EN values of Fig. 5 and
the daily intercept values have been used to calculate the monthly mean values. These monthly means of experimen-tally derived ENand intercept values are illustrated in Fig. 6
along with the monthly means of the respective NOy/CO
val-ues and the frequency of the selected days per month from which the monthly means were calculated.
Note from Fig. 6 that the highest frequencies of the se-lected days per month, for which daily values of ENwere
ex-perimentally derived, are observed during March, April and May. The monthly means of experimentally derived daily
ENvalues show a seasonal variation with lower values
dur-ing the warm period from May to August, which is accom-panied by higher values of the NOy/CO ratio. The seasonal
variation in the NOy/CO ratio can be attributed on the one
hand to a longer lifetime of CO during the cold season and on the other hand to enhanced vertical transport during the warm season. However, the fact that the NOy/CO level in
April is comparable with the NOy/CO levels from May to
September is primarily due to the peak NOy concentration
in April (see Fig. 2 and Fig. 3). This cannot be attributed to thermal vertical mixing but rather to other transport pro-cesses of polluted air masses from regional to hemispheric scale. It can be inferred from Fig. 6 that the seasonal varia-tion of ENvalues with lower values from May to August can
be partially attributed to more efficient vertical transport of polluted air masses from the atmospheric boundary layer up to JFJ during the warm period.
The monthly means of the intercept, which reflects the background ozone, were calculated from the daily intercept values and demonstrate a seasonal cycle oscillating around a mean level of 43±3 ppbv (the error bar denotes the 95% con-fidence interval of the mean) with amplitude ranging from about 35 ppbv in winter months to about 50 ppbv within the period between April and August.
Figure 6 also shows that the monthly means of experi-mentally derived EN values compare rather well with
theo-retically derived EN values. Both experimentally and
the-oretically derived EN values demonstrate similar seasonal
variation. The theoretical monthly EN values were
calcu-lated from the steady state Eq. (2) by setting the levels of NO, NO2, O3, CO, H2O, temperature and pressure to their
median monthly values from the daily mean values of the 571 selected days. In order to get a range for the theoretical monthly ENvalues, we calculated ENvalues from the steady
state Eq. (2) by varying the respective monthly median val-ues of NO, NO2, O3, CO, H2O, temperature and pressure by
10%.
Taking into account the results by Zellweger et al. (2003), who showed from measurements of NOyand CO at JFJ that
undisturbed FT conditions are always accompanied by the lowest NOy/CO ratios, we used this ratio to distinguish
be-tween disturbed and undisturbed FT conditions at the JFJ. Initially, the experimentally derived EN values were
disag-gregated in two large classes in order to use all the avail-able data for the calculations, one class including days when the respective daily NOy/CO value was lower than the
me-dian monthly value of the ratio NOy/CO (less disturbed FT
conditions) and one class including days when the respective daily NOy/CO value was higher than the median monthly
value of the ratio NOy/CO (more disturbed FT
condi-tions). The monthly means of ENvalues, which were
calcu-lated for these two individual classes (NOy/CO<median and
NOy/CO>median) at JFJ, are illustrated in Fig. 7a indicating
that the monthly means of experimentally derived ENvalues
for the less disturbed FT conditions (NOy/CO<median) are
generally higher than the respective monthly EN values for
the more disturbed FT conditions (NOy/CO>median) except
in November and January.
Fig. 7. (a) Seasonal variation of monthly means of experimentally
derived EN (1O3/1NOz) values (a) for days that the respective daily NOy/CO value was lower (or higher) than the median monthly
value of the ratio NOy/CO and (b) for days that the respective daily
NOy/CO value was lower than the monthly 1st quartile value of
the ratio NOy/CO (characterised as undisturbed FT conditions) or
higher than the monthly 3rd quartile value of the ratio NOy/CO
(characterised as disturbed FT conditions). The frequency of the days per month from which the respective monthly ENvalues were calculated is superimposed with grey column bars. Error bars de-note 95% confidence interval of the monthly mean values of EN.
However, this separation method in two classes based on the median value of NOy/CO is rather crude and hence a
stricter criterion was applied to disaggregate the daily EN
values using the 1st and 3rd quartile monthly values of the NOy/CO ratio (see Table 1). A day was characterised as
undisturbed FT if the respective daily NOy/CO value was
lower than the monthly 1st quartile value of the NOy/CO
ra-tio while a day was characterised as disturbed FT if the re-spective daily NOy/CO value was higher than the monthly
3rd quartile value of the NOy/CO ratio. Indicatively, the
1st quartile value of the NOy/CO ratio ranges from 0.0020
in February to 0.0075 in July, while the 3rd quartile value of the NOy/CO ratio ranges from 0.0054 in December to
0.0128 in July (see Table 1). Table 1 also shows that the respective seasonal 1st quartile values of the NOy/CO ratio
range from 0.0022 in winter (DJF) to 0.0063 in summer (JJA) with spring (MAM) and autumn (SON) values being around 0.004. These 1st quartile NOy/CO ratio values in winter,
Table 1. Monthly, seasonal and annual statistics of the NOy/CO values for the 571 selected days between 1998 and 2004.
Min 1stQu Median Mean 3rdQu Max January 0.0007 0.0025 0.0041 0.0046 0.0069 0.0087 February 0.0015 0.0020 0.0035 0.0046 0.0069 0.0130 March 0.0015 0.0024 0.0041 0.0054 0.0070 0.0197 April 0.0026 0.0052 0.0075 0.0080 0.0107 0.0163 May 0.0032 0.0053 0.0070 0.0079 0.0093 0.0163 June 0.0028 0.0054 0.0081 0.0083 0.0112 0.0160 July 0.0027 0.0075 0.0093 0.0102 0.0128 0.0219 August 0.0028 0.0062 0.0076 0.0082 0.0094 0.0163 September 0.0025 0.0060 0.0075 0.0083 0.0096 0.0204 October 0.0014 0.0034 0.0045 0.0058 0.0066 0.0150 November 0.0015 0.0033 0.0055 0.0055 0.0067 0.0164 December 0.0013 0.0021 0.0037 0.0042 0.0054 0.0132 Winter 0.0007 0.0022 0.0037 0.0045 0.0064 0.0132 Spring 0.0015 0.0041 0.0062 0.0071 0.0092 0.0197 Summer 0.0027 0.0063 0.0081 0.0088 0.0113 0.0219 Autumn 0.0014 0.0042 0.0059 0.0067 0.0084 0.0204 Annual 0.0007 0.0041 0.0066 0.0071 0.0092 0.0219
spring and autumn are in agreement with the respective sea-sonal values indicated from meteorological analysis by Zell-weger et al. (2003) for undisturbed FT conditions. Only the 1st quartile NOy/CO ratio value in summer is slightly higher
than the respective summer value indicated in the study of Zellweger et al. (2003) for undisturbed FT conditions but within the standard error. It should always be kept in mind that this selection criterion, to use the 1st and 3rd quartile monthly value of the NOy/CO ratio, is not an absolute way
to distinguish between disturbed and undisturbed FT condi-tions but only a relative way to sample air masses with dif-ferent characteristics. Hence, the relative selection criterion with upper and lower quartiles is a compromise in order to have an adequate number of days per month for the calcu-lation of monthly EN values. For example when using an
absolute criterion for the NOy/CO ratio being lower than a
value of around 0.004, only a few days were selected from May to September.
Following this methodology with the 1st and 3rd quartile monthly values of the NOy/CO ratio as cut-off values, the
experimentally derived daily EN values were disaggregated
into two classes for disturbed and undisturbed FT conditions at JFJ. The monthly means of ENvalues, which were
calcu-lated for these two individual classes (disturbed and undis-turbed FT conditions) at JFJ, are illustrated in Fig. 7b along with the frequency of the undisturbed FT (or disturbed FT) days per month used for the calculation of the monthly EN
value. As it can be inferred from Fig. 7a and b the use of a more strict criterion with the 1st and 3rd quartile monthly values of the NOy/CO ratio as cut-off values results into a
clearer distinction between the monthly means of EN
val-ues of the selected classes, indicating the consistency of the filtering methodology. The annual mean ENvalue for
undis-turbed FT conditions (<1st quartile) is 27.4±4.9 molecules of O3produced per molecule of NOxoxidized, while for
dis-turbed FT conditions (>3rd quartile) it is 14.4±4.7 (the error bars denotes the 95% confidence interval of the mean). The monthly means of experimentally derived EN values for the
undisturbed FT conditions are generally higher than the re-spective monthly EN values for the disturbed FT conditions
except in November. This reflects the expected decrease of
ENwith increasing concentration of oxidized nitrogen. The
monthly mean ENvalues for the disturbed FT conditions are
around 10 for all months from February to October with no distinct seasonal pattern while the monthly EN values for
the undisturbed FT conditions show a distinct seasonal cy-cle with higher values in the cold season from November to April.
If we disregard the peak monthly EN value of
Decem-ber (EN=46.9) for undisturbed FT conditions, which was
calculated from only 8 days, the monthly EN values of
March (EN=35.8) and April (EN=34.9) are the highest
val-ues throughout the year for undisturbed FT conditions at JFJ. In addition these high EN values of March and April result
from the highest frequencies of selected days per month with undisturbed FT conditions (18 days for both months) (see Fig. 7b). It should be noted that the monthly EN values for
the disturbed FT conditions from November to January are higher than 24 and almost comparable with the monthly EN
values for the undisturbed FT conditions (except in Decem-ber), which implies that the criterion used to disaggregate disturbed and undisturbed FT conditions for these months is
not a distinct selection rule. The difference of ENvalues
be-tween undisturbed FT and disturbed FT conditions during the warm period of the year from May to September can be par-tially attributed to more frequent and apparent episodes with thermally induced vertical transport of polluted air masses from the atmospheric boundary layer up to JFJ. However, the difference of ENvalues between undisturbed FT and
dis-turbed FT in February, March and April cannot be associated to more efficient thermal vertical mixing but rather to other transport processes of polluted air masses from regional to hemispheric scale.
Preliminary analysis of the back trajectories for the dis-turbed and undisdis-turbed FT days in April using the British At-mospheric Data Centre (BADC) trajectory tool (http://badc. nerc.ac.uk) which derived the parcel paths from the ECMWF analysed winds with 2.5◦×2.5◦resolution points to transport
processes from regional scale (such as dynamical uplifting within synoptic frontal systems) to hemispheric scale (inter-continental transport) as a source of pollutants (and hence of precursors for ozone production) at the lower FT during early spring. However, taking into account the trajectory uncer-tainties associated with the low resolution of the wind fields and the complexity of the alpine topography there is an ef-fort in progress to investigate in detail the origin of the air masses for undisturbed and disturbed FT conditions during spring with more elaborate trajectory tools and meteorologi-cal analysis.
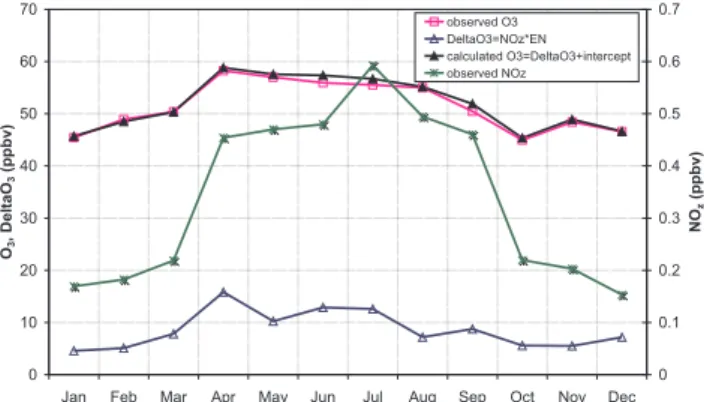
The monthly ENvalues for the undisturbed FT conditions
(shown in Fig. 7b) can be multiplied with the respective ob-served monthly NOzvalues (shown in Fig. 8), to obtain the
monthly quantity 1O3. Taking into account the respective
monthly ozone production efficiency, the quantity 1O3
re-flects how much ozone would be produced on the way to JFJ if all the observed monthly NOz concentration at JFJ were
obtained from the oxidation of NOx following the way to
JFJ. As can be noted from Fig. 8 the monthly mean values of the quantity 1O3show a rather similar seasonal variation
with the respective observed monthly O3 values (as
calcu-lated from the days with undisturbed FT conditions at JFJ) with a peak in April. The 1O3 builds up on the monthly
ozone background as reflected from the respective monthly intercept value of the regression. Hence calculated monthly ozone values were derived from the addition of the monthly
1O3values and the respective monthly intercept values for undisturbed FT conditions. Figure 8 indicates that these cal-culated monthly ozone values show good agreement with the observed monthly ozone values for undisturbed FT condi-tions. It is apparent that the seasonal cycle in calculated monthly ozone values results from both the seasonal depen-dence of ENand the seasonal dependence of NOz.
The evidences from Fig. 7b and Fig. 8 highlight the great potential and importance of photochemical ozone production in the FT during the spring season, thus indicating a key and possibly dominant role for photochemistry in the observed build-up of tropospheric ozone in the winter-spring
transi-Fig. 8. Seasonal variation of monthly means of observed O3(pink open squares) and NOz(green asterisks) concentrations calculated
from the days with undisturbed FT conditions at JFJ from 1998 to 2004. With blue open triangles are illustrated monthly 1O3
val-ues derived from the multiplication of the monthly experimentally derivedEN values for undisturbed FT conditions with the respec-tive monthly observed NOzvalues. With solid black triangles are
illustrated calculated ozone values derived from the addition of the monthly 1O3 values and the respective monthly intercept values
for undisturbed FT conditions.
tion period. This is in line with the findings of FREETEX campaigns between 1996 and 2001 (Zanis et al., 2003).
4 Summary and conclusions
In this study we investigate the seasonal variability of ozone productions efficiencies (EN) at the high-alpine research
sta-tion Jungfraujoch (JFJ) based on continuous measurements of nitrogen oxide (NO), nitrogen dioxide (NO2), total
reac-tive nitrogen (NOy) and ozone (O3) carried out regularly for
a seven-year period (1998–2004). This dataset is a unique long-term data series of nitrogen levels in the FT over Cen-tral Europe and hence it provides an excellent opportunity to perform such an analysis.
A striking feature is the monthly peak values of NOy, NOz,
and NOxin April, which is a consistent feature for most of
the individual years between 1998 and 2004 in accordance with the CO observations. This feature cannot be associated to thermally induced vertical transport from the boundary layer but rather to larger scale transport processes of polluted air masses from regional to hemispheric scale.
Experimentally derived daily EN values have been
se-lected for 571 days out of the 2557 days from 1998 to 2004, from which an average ozone production efficiency of 18.8±1.3 molecules of O3 produced per molecule of NOx
oxidized was calculated. This EN value, which is
compara-ble with the ENvalue of 21.5±1.9 derived from the monthly
means of O3and NOz at JFJ from 1998 to 2004, indicates
the great potential and importance of photochemical ozone production in the FT. In agreement with theoretical steady-state calculations, these experimentally derived daily EN
val-ues exhibited a general decreasing exponential trend with in-creasing NOy/CO ratio, a parameter to assess the aging
pro-cess that has occurred in an air parcel.
The monthly means of experimentally derived daily EN
values showed a seasonal variation with lower values from May to August, which can be partially attributed to more efficient vertical transport of polluted air masses from the atmospheric boundary layer up to JFJ during the warm pe-riod. Both experimentally and theoretically derived EN
val-ues demonstrate a similar seasonal variation.
Taking into account that undisturbed FT conditions are al-ways accompanied by the lowest NOy/CO ratios, we used the
1st and 3rd quartile values of this ratio to disaggregate the experimentally derived daily EN values into two classes for
disturbed and undisturbed FT conditions at JFJ. The monthly means of experimentally derived EN values for the
undis-turbed FT conditions are generally higher than the respective monthly ENvalues for the disturbed FT conditions except in
November, which reflects the expected decrease of EN with
increasing concentration of oxidized nitrogen and pollution levels in the disturbed FT conditions. The monthly mean EN
values for the disturbed FT conditions are relatively constant and remain around 10 for all months from February to Oc-tober while the monthly EN values for the undisturbed FT
conditions show a distinct seasonal cycle with higher values in the cold season from November to April.
The monthly EN values of March (EN=35.8) and April
(EN=34.9) are among the highest values throughout the
year for undisturbed FT conditions at JFJ. Furthermore, the monthly mean values of the quantity 1O3, which reflects
how much ozone would be produced in a month from the oxidation of NOx to the observed monthly NOz
concentra-tion taking into account the respective monthly ozone pro-duction efficiency, show a rather similar seasonal variation with the respective monthly O3values with a peak in April.
These results highlight the key and possibly the dominant role for photochemistry in the observed build-up of tropo-spheric ozone in the winter-spring transition period.
Acknowledgements. We acknowledge that the International
Foundation High Altitude Research Stations Jungfraujoch and Gornergrat (HFSJG), made it possible to carry out our measure-ments. Measurements were made by the Swiss National Air Pollution Monitoring Network (NABEL) on behalf of the Swiss Federal Office for the Environment (FOEN). The financial support of the NABEL network by FOEN is highly acknowledged.
Edited by: N. Mihalopoulos
References
Baltensperger, U., G¨aggeler, H. W., Jost, D. T., Lugauer, M., Schwikowski, M., and Seibert, P.: Aerosol climatology at a high Alpine site Jungfraujoch, Switzerland, J. Geophys. Res., 102(D16), 19 707–19 715, 1997.
Br¨onnimann, S.: Early Spring Ozone Episodes: Occurrence and Case Study, Phys. Chem. Earth, Part C, 24(5), 531–536, 1999. Campana, M., Li, Y., Staehelin, J., Pr´evˆot, A. S. H., Bonasoni, P.,
Loetscher, H., and Peter, T.: The in?uence of south foehn on the ozone mixing ratios at the high alpine site Arosa, Atmos. Environ., 39, 2945–2955, 2005.
Carpenter, L. J., Green, T. J., Mills, G. P., Bauguitte, S., Penkett, S. A., Zanis, P., Schuepbach, E., Schmidbauer, N., Monks, P. S., and Zellweger, C.: Oxidised nitrogen and ozone production efficiencies in the springtime free troposphere over the Alps, J. Geophys. Res., 105, 14 547–14 559, 2000.
Chin, M., Jacob, D. J., Munger, J. W., Parrish, D. D., and Dod-dridge, B. G.: Relationship of ozone and carbon monoxide over North America, J. Geophys. Res., 99, 14 565–14 573, 1994. Crutzen, P. J.: Tropospheric ozone: An overview, in: Tropospheric
Ozone, edited by: I.S.A. Isaksen, D. Reidel Publ. Co., 3–32, 1988.
Crutzen, P. J., Lawrence, M. G., and Poeschl, U.: On the back-ground photochemistry of tropospheric ozone, Tellus, 51A-B, 123–146, 1999.
Davies, T. D. and Schuepbach, E.: Episodes of high ozone con-centrations at the earth’s surface resulting from transport down from the upper troposphere/lower stratosphere: A review and case studies, Atmos. Environ., 28(1), 53–68, 1994.
DeWekker, S. F. J., Steyn, D. G. and Nyeki, S.: A Comparison of Aerosol-layer and Convective Boundary Layer Structure Over a Mountain Range During STAAARTE ’97, Bound. Lay. Met., 113, 249–271, 2004.
Emmons, L. K., Carroll, M. A., Hauglustaine, D. A., Brasseur, G. P., et al.: Climatologies of NOxand NOy: A comparison of data
and models, Atmos. Environ., 31(12), 1851–1904, 1997. Forrer, J., R¨uttimann, R., Schneiter, D., Fischer, A., Buchmann,
B., and Hofer, P.: Variability of trace gases at the high Alpine site Jungfraujoch caused by meteorological transport processes, J. Geophys. Res., 105, 12 241–12 251, 2000.
Jaegl´e, L., Jacob, D. J., Wang, Y., Weinheimer, A. J., Ridley, B. A., Campos, T. L., Sachse, G. W., and Hagen, D. E.: Sources and chemistry of NOxin the upper troposphere over the United
States, Geophys. Res. Lett., 25, 1705–1708, 1998.
Henne, S., Furger, M., Nyeki, S., Steinbacher, M., Neininger, B., De Wekker, S. F. J., Dommen, J., Spichtinger, N., Stohl, A., and Pr´evˆot, A. S. H.: Quantification of Topographic Venting of Boundary Layer Air to the Free Troposphere, Atmos. Chem. Phys., 4, 497–509, 2004,
http://www.atmos-chem-phys.net/4/497/2004/.
Henne, S., Furger, M., and Pr´evˆot, A. S. H.: Climatology of Moun-tain Venting - Induced Elevated Moisture Layers in the Lee of the Alps, J. Appl. Meteo., 44(5), 620–633, 2005a.
Henne, S., Dommen, J., Neininger, B., Reimann, S., Staehelin, J., and Pr´evˆot, A. S. H.: Influence of Mountain Venting in the Alps on the Ozone Chemistry of the Lower Free Troposphere and the European Pollution Export, J. Geophys. Res., 110(D22), D22307, doi:10.1029/2005JD005936, 2005b.
Hirsch, A. I., Munger, J. W., Jacob, D. J., Horowitz, L. W., and Goldstein, A. H.: Seasonal variation of ozone production effi-ciency per unit NOxat Harvard National Forest, Massachusetts,
J. Geophys. Res., 101, 12 659–12 666, 1996.
Hough, A. M.: The calculation of photolysis rates for use in global tropospheric modelling studies, AERE Rep. R-13259, pp. 53,
Her Majesty’s Stn. Off., Norwich, England, 1988.
Lacis, A. A., Wuebbles, D. J., and Logan, J. A.: Radiative forc-ing of climate by changes in the vertical distribution of ozone, J. Geophys. Res., 95, 9971–9981, 1990.
Lelieveld, J. and Dentener, F.: What controls tropospheric ozone, J. Geophys. Res., 105(3), 3543–3563, 2000.
Li, Y., Campana, M., Reimann, S., Schaub, D., Stemmler, K., Stae-helin, J., and Peter, T.: Hydrocarbon concentrations at the Alpine mountain sites Jungfraujoch and Arosa, Atmos. Environ., 39, 1113–1127, 2005.
Liu, S. C., Trainer, M., Fehsenfeld, F. C., Parrish, D. D., Williams, E. J., Fahey, D. W., H¨ubler, G., and Murphy, P. C.: Ozone Production in the Rural Troposphere and the Implications for Regional and Global Ozone Distributions, J. Geophys. Res., 92(D4), 4191–4207, 1987.
Logan, J. A.: Nitrogen oxides in the troposphere: Global and re-gional budgets, J. Geophys. Res., 88, 10 785–10 807, 1983. Lugauer M., Baltensperger, U., Furger, M., G¨aggeler, H. W., Jost,
D. T., Schwikowski, M., and Wanner, H.: Aerosol transport to the high Alpine sites Jungfraujoch(3454 m asl) and Colle Gnifetti (4452 m asl). Tellus, 50B, 76–92, 1998.
Lugauer, M., Baltensperger, U., Furger, M., G¨aggeler, H. W., Jost, D. T., Nyeki, S., and Schwikowski, M.: Influences of vertical transport and scavenging on aerosol particle surface area and radon decay product concentrations at the Jungfraujoch (3454m above sea level), J. Geophys. Res., 105, 19 869–19 879, 2000. Monks, P. S.: A review of observations and origins of the spring
ozone maximum, Atmos. Environ., 34, 3545–3561, 2000. Nyeki, S., Kalberer, M., Colbeck, I., De Wekker, S., Furger, M.,
G¨aggeler, H. W., Kossmann, M., Lugauer, M., Steyn, D., Wein-gartner, E., Wirth, M., and Baltensperger, U.: Convective bound-ary layer evolution to 4 km asl over high-alpine terrain: Airborne lidar observations in the Alps, Geophys. Res. Lett., 27, 689–692, 2000.
Nunnermacker, L. J., Imre, D., Daum, P. H., Kleinman, L., Lee, Y. N., Lee, J. H., Springston, S. R., Newman, L., Weinstein-Lloyd, J., Luke, W. T., Banta, R., Alvarez, R., Senff, C., Sillman, S., Holdren, M., Keigley, G. W., and Zhou, X.: Charaterization of the Nashville urban plume on July 3 and July 18, 1995, J. Geo-phys. Res., 103(D21), 28 129–28 148, 1998.
Olszyna, K. J., Bailey, E. M., Simonaitis, R., and Meagher, J. F.: O3and NOyrelationships at a rural site, J. Geophys. Res., 99,
14 557–14 563, 1994.
Ordonez C., Mathis U., Furger M., Henne S., H¨uglin C., Staehelin J., and Pr´evˆot, A. S. H.: Changes of daily surface ozone maxima in Switzerland in all seasons from 1992 to 2002 and discussion of summer 2003, Atmos. Chem. Phys., 5 1187–1203, 2005. Parrish, D. D., Trainer, M., Buhr, M. P.,Watkins, B. A., and
Fehsen-feld, F. C.: Carbon monoxide concentrations and their relation to concentrations of total reactive oxidized nitrogen at two rural U.S. sites, J. Geophys. Res., 96, 9309–9320, 1991.
Penkett, S. A. and Brice, K. A.: The spring maximum in photo-oxidant in the Northern hemisphere troposphere, Nature, 319, 655–657, 1986.
Penkett, S. A.: Indications and causes of ozone increase in the tro-posphere, in: The changing atmosphere, edited by: Rowland, F. S. and Isaksen, I. S. A., J. Wiley & Sons, 91, 1988.
Pr´evˆot, A. S. H., Staehelin, J., Kok, G. L., Schillawski, R. D., Neininger, B., Staffelbach, T., Neftel, A., Wernli, H., and
Dom-men, J.: The Milan photooxidant plume, J. Geophys. Res., 102, 23 375–23 388, 1997.
Rickard, A. R., Salisbury, G., Monks, P. S., Lewis, A. C., Baugitte, S., Bandy, B. J., Clemitshaw, K. C., and Penkett, S. A.: Com-parison of measured ozone production efficiencies in the marine boundary layer at two European coastal sites under different pol-lution regimes, J. Atmos. Chem., 43, 107–134, 2002.
Sander, S. P., De More, W. B., Howard, C. J., Ravishankara, A. R., Golden, D. M., Kolb, C. E., Hampson, R. F., Kurylo, M. J., and Molina, M. J.: Chemical kinetics and photochemical data for use in stratospheric modeling, evaluation number 12, National Aeronautics and Space Administration, Jet Propulsion Labora-tory, JPL Publication 97-4, 2003.
Sch¨ar, C., Vidale, P. L., L¨uthi, D., Frei, C., H¨aberli, C., Liniger, M. A., and Appenzeller, C.: The role of increasing temperature variability in European summer heatwaves, Nature, 427, 332– 336, doi:10.1038/nature02300, 2004.
Schuepbach, E., Friedli, T. K., Zanis, P., Monks, P. S., and Penkett, S. A.: State space analysis of trends and seasonalities of lower free tropospheric ozone (1988–1997) at the high elevation site at Jungfraujoch, J. Geophys. Res., 106(D17), 20 413–20 427, 2001. Sch¨uepp, M.: Witterungsklimatologie, Beiheft zu den Annalen der
Sz. Meterol. Anstalt 20, 93 pp, 1979.
Sillman, S., Logan, J. A., and Wofsy, S .C.: The sensitivity of ozone to nitrogen oxides and hydrocarbons in regional ozone episodes, J. Geophys. Res., 95(D2), 1837–1851, 1990.
Staehelin, J. and Schmid, W.: Trend analysis of tropospheric ozone concentrations utilizing the 20-year data set of ozone balloon soundings over Payerne (Switzerland), Atmos. Environ., 25A(9), 1739–1749, 1991.
Staehelin, J., Thudium, J., Buehler, R., Volz-Thomas, A., and Graber, W.: Trends in surface ozone concentrations at Arosa (Switzerland), Atmos. Environ., 28(1), 75–87, 1994.
Stohl, A., Trainer, M., Ryerson, T. B., Holloway, J. S., and Parrish, D. D.: Export of NOyfrom the North American boundary layer
during NARE 96 and NARE 97, J. Geophys. Res., 107(D11), 4131, doi:10.1029/2001JD000519, 2002.
Stohl, A., Bonasoni, P., Cristofanelli, P., Collins, W., Feichter, J., Frank, A., Forster, C., Gerasopoulos, E., G¨aggeler, H., James, P., Kentarchos, T., Kreipl, S., Kromp-Kolb, H., Kr¨uger, B., Land, C., Meloen, J., Papayannis, A., Priller, A., Seibert, P., Sprenger, M., Roelofs, G. J., Scheel, E., Schnabel, C., Siegmund, P., To-bler, L., Trickl, T., Wernli, H., Wirth, V., Zanis, P., and Zere-fos, C.: Stratosphere-troposphere exchange – a review, and what we have learned from STACCATO, J. Geophys. Res., 108(D12), doi:10.1029/2002JD002490, 2003.
Thielmann, A., Pr´evˆot, A.S.H., and Staehelin, J.: Sensitiv-ity of ozone production derived from field measurements in the Italian Po basin, J. Geophys. Res., 107(D22), 8194, doi:10.1029/2000JD000119, 2002.
Trainer, M., Parrish, D. D., Buhr, M. P., Norton, R. B., Feshenfeld, F. C., Anlauf, K. G., Bottenheim, J. W., Tang, Y. Z., Wiebe, H. A., Roberts, J. M., Tanner, R. L., Newman, L., Bowersox, V. C., Meagher, J. F., Olszyna, K. J., Rodgers, M. O., Wang, T., Berresheim, H., Demerjian, K. L., and Roychowdhury, U. K.: Correlation of ozone with NOyin photochemically aged air, J.
Geophys. Res., 98, 2917–2985, 1993.
Volz-Thomas, A. and Kley, D.: Evaluation of the Montsouris series of ozone measurements made in the nineteenth century, Nature,
332, 240–242, 1988.
Wanner, H., Salvisberg, E., Rickli, R., and Sch¨uepp, M.: 50 years of Alpine Weather Statistics (AWS), Meteorol. Zeitschrift, N.F. 7, 99–111, 1998.
Yienger, J. J., Klonecki, A. A., Levy II, H., Moxim, W. J., and Carmichael, G. R.: An evaluation of chemistry’s role in the winter-spring ozone maximum found in the northern midlatitude free troposphere, J. Geophys. Res., 104(D3), 3655–3667, 1999. Zanis, P., Monks, P. S., Schuepbach, E., Carpenter, L. J., Green, T.
J., Mills, G. P., Bauguitte, S., and Penkett, S. A.: In-situ ozone production under free tropospheric conditions during FREETEX ’98 in the Swiss Alps, J. Geophys. Res., 105(D19), 24 223– 24 234, 2000a.
Zanis, P., Monks, P. S., Schuepbach, E., and Penkett, S. A.: The role of in-situ photochemistry in the control of ozone during spring at the Jungfraujoch Observatory (3,580 m asl) – Comparison of model results with measurements, J. Atmos. Chem., 37, 1–27, 2000b.
Zanis, P., Monks, P. S., Green, T. J., Schuepbach, E., Carpenter, L. J., Mills, G. P., Richard, A., and Penkett, S. A.: Seasonal variation of peroxy radicals in the lower free troposphere based on observations from the FREE Tropospheric EXperiments at Jungfraujoch in the Swiss Alps, Geophys. Res. Lett., 30(10), 1497, doi:10.1029/2003GL017122, 2003.
Zellweger, C., Ammann, M., Buchmann, B., Hofer, P., Lugauer, M., R¨uttimann, R., Streit, N., Weingartner, E., and Baltensperger, U.: Summertime NOySpeciation at the Jungfraujoch, 3580 m asl,
Switzerland, J. Geophys. Res., 105(D5), 6655–6667, 2000. Zellweger, C., Forrer, J., Hofer, P., Nyeki, S., Schwarzenbach, B.,
Weingartner, E., Ammann, M., and Baltensperger, U.: Partin-ioning of reactive nitrogen (NOy) and dependence on meteoro-logical conditions in the lower free troposphere, Atmos. Chem. Phys., 3, 770–796, 2003,