HAL Id: hal-03136495
https://hal.univ-lorraine.fr/hal-03136495
Submitted on 9 Feb 2021
HAL is a multi-disciplinary open access
archive for the deposit and dissemination of
sci-entific research documents, whether they are
pub-lished or not. The documents may come from
teaching and research institutions in France or
abroad, or from public or private research centers.
L’archive ouverte pluridisciplinaire HAL, est
destinée au dépôt et à la diffusion de documents
scientifiques de niveau recherche, publiés ou non,
émanant des établissements d’enseignement et de
recherche français ou étrangers, des laboratoires
publics ou privés.
Distributed under a Creative Commons Attribution| 4.0 International License
Pyropheophorbide-a and Photofrin® in Different
Conditions
Bauyrzhan Myrzakhmetov, Philippe Arnoux, Serge Mordon, Samir Acherar,
Irina Tsoy, Céline Frochot
To cite this version:
Bauyrzhan Myrzakhmetov, Philippe Arnoux, Serge Mordon, Samir Acherar, Irina Tsoy, et al..
Photo-physical Properties of Protoporphyrin IX, Pyropheophorbide-a and Photofrin® in Different Conditions.
Pharmaceuticals, MDPI, 2021, 14 (2), pp.138. �10.3390/ph14020138�. �hal-03136495�
Pharmaceuticals 2021, 14, 138. https://doi.org/10.3390/ph14020138 www.mdpi.com/journal/pharmaceuticals
Article
Photophysical Properties of Protoporphyrin IX,
Pyropheophorbide-a and Photofrin
®in Different Conditions
Bauyrzhan Myrzakhmetov 1,2, Philippe Arnoux 1, Serge Mordon 3, Samir Acherar 4, Irina Tsoy 2
and Céline Frochot 1,*
1 LRGP UMR 7274, CNRS, University of Lorraine, 54000 Nancy, France;
bauyrzhanmyrzakhmetov86@gmail.com (B.M.); philippe.arnoux@univ-lorraine.fr (P.A.); celine.frochot@univ-lorraine.fr (C.F.)
2 Department of Chemistry and Chemical Technology, M.Kh. Dulaty Taraz Regional University,
Taraz 080012, Kazakhstan; tsoyirinagen@mail.ru
3 ONCO-THAI U1189, INSERM, CHU Lille, University of Lille, 59000 Lille, France; serge.mordon@inserm.fr 4 LCPM UMR 7375, CNRS, University of Lorraine, 54000 Nancy, France; samir.acherar@univ-lorraine.fr
* Correspondence: celine.frochot@univ-lorraine.fr; Tel.: +33-372743780
Abstract: Photodynamic therapy (PDT) is an innovative treatment of malignant or diseased tissues.
The effectiveness of PDT depends on light dosimetry, oxygen availability, and properties of the photosensitizer (PS). Depending on the medium, photophysical properties of the PS can change leading to increase or decrease in fluorescence emission and formation of reactive oxygen species (ROS) especially singlet oxygen (1O2). In this study, the influence of solvent polarity, viscosity,
concentration, temperature, and pH medium on the photophysical properties of protoporphyrin IX, pyropheophorbide-a, and Photofrin® were investigated by UV-visible absorption, fluorescence
emission, singlet oxygen emission, and time-resolved fluorescence spectroscopies.
Keywords: photodynamic therapy; protoporphyrin IX; pyropheophorbide-a; Photofrin®;
absorption; fluorescence; singlet oxygen
1. Introduction
Photodynamic therapy (PDT) is a targeted technique for the treatment of malignant or diseased tissues that relies on three non-toxic elements—a light-activated drug (photosensitizer, PS), light, and molecular oxygen. Illumination of the PS induces the production of the triplet excited state 3PS* which is able to transfer protons, electrons, or
energy, leading to the formation of reactive oxygen species (ROS). ROS cause apoptosis or necrosis of tumor cells by photochemical oxidation [1–3].
A PS should ideally possess some valuable properties including (i) absorption peak in the near-infrared (NIR) region (700–1000 nm) of the UV-visible spectrum that provides enough penetration of light into deep tissues and energy to excite molecular oxygen to its singlet state efficiently, (ii) minimal skin photosensitivity, (iii) no dark toxicity, (iv) selective uptake by cancer tissues, thereby enabling the decrease of side effects [4,5], and (v) fast elimination.
The self-assembly or aggregation of PS in aqueous environments can be caused by different reasons and is favored for amphiphilic PSs showing a negligible PDT activity due to the emission reduction of the 3PS* state in aggregated form [6,7]. The
physico-chemical properties of aggregates differ from those of monomers. They exhibit a broadened Soret band and red-shifted Q bands in the UV-visible absorption spectra, low fluorescence intensity and lifetime [8–13], and low singlet oxygen (1O2) production.
The hematoporphyrin derivative (HPD) and its purified form Photofrin® (PF) were
the first used PSs in PDT and PF was approved for the treatment of solid tumors [14–17]. Citation: Myrzakhmetov, B.;
Arnoux, P.; Mordon, S.; Acherar, S.; Tsoy, I.; Frochot, C. Photophysical Properties of Protoporphyrin IX, Pyropheophorbide-a and Photofrin®
in Different Conditions.
Pharmaceuticals 2021, 14, 138.
https://doi.org/10.3390/ph14020138
Academic Editor: Luís M. T. Frija Received: 26 January 2021 Accepted: 7 February 2021 Published: 9 February 2021
Publisher’s Note: MDPI stays
neutral with regard to jurisdictional claims in published maps and institutional affiliations.
Copyright: © 2021 by the authors.
Licensee MDPI, Basel, Switzerland. This article is an open access article distributed under the terms and conditions of the Creative Commons Attribution (CC BY) license (http://creativecommons.org/licenses /by/4.0/).
PF was also indicated as a specific and selective radiosensitizing agent by several in vitro and in vivo studies [18–22]. PF is being used for the treatment of esophageal and non-small-cell lung and pancreatic cancers as well as a possible therapy against Karposi’s sarcoma and brain, breast, skin, and bladder cancers [23].
The selective accumulation of protoporphyrin IX (PpIX) in the tumor cells following administration of 5-aminolevulinic acid (5-ALA) has made this PS precursor very popular for skin cancer PDT and fluorescent diagnostics of tumor tissues [24,25]. Topical, oral, or intravenous administration of 5-ALA prodrug in excess leading to the formation and accumulation of PpIX in vivo [26] is used by dermatologists to treat several malignant neoplasms of the skin, such as Bowen disease or actinic keratosis [27].
Pyropheophorbide-a (PPa) is a natural second-generation bacteriochlorin PS which presents a significant absorption in the far-red spectral region and high 1O2 formation
upon light illumination, suggesting it for PDT [28,29].
This study aimed to explore the different parameters (i.e., solvent polarity, concentration, temperature, and pH medium) that influence the photophysical properties (absorption, fluorescence emission, and 1O2 formation) of the three PSs (PpIX, PPa, and
PF).
2. Results and Discussion
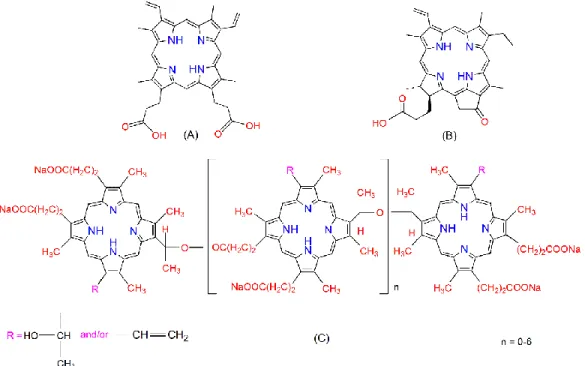
Chemical structures of PpIX, PPa, and PF are shown in Figure 1. PpIX has two ionizable propionate groups and a hydrophobic ring core, which gives it amphiphilic properties leading to an aggregation through π–π stacking interaction and vesicle formation [30]. PPa has only one propionate group and a hydrophobic ring core, it can also aggregate in aqueous solutions [31]. PF is composed of monomers, dimers, and some very large oligomers [32].
Figure 1. Chemical structures of protoporphyrin IX (PpIX) (A), pyropheophorbide-a (PPa) (B), and Photofrin® (PF) (C).
2.1. Influence of the Solvent
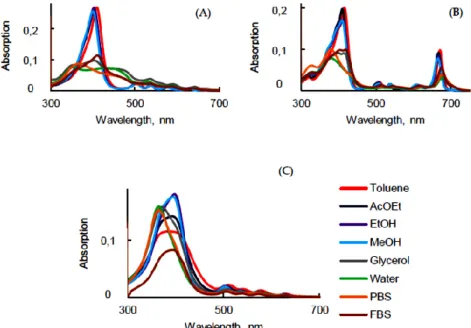
The structure of the molecule, ionic strength, pH, and temperature should play a main role in the photophysical properties [33]. UV-visible absorption spectra of PSs presented in Figure 2, were recorded in different solvents. ET(30) is a solvent polarity
parameter that characterized the polarity of the different solvents. The bigger the ET (30) value, the more solvent polarity it is associated with.
As expected, UV-visible absorption spectra of PpIX (Figure 2A) exhibited an intense Soret band centered at around 406 nm and four weaker Q bands in the visible range in toluene, ethyl acetate (AcOEt), ethanol (EtOH), and methanol (MeOH). These similar spectra are typical of monomeric PpIX. Nevertheless, in glycerol, water, phosphate-buffered solution (PBS), and fetal bovine serum (FBS), the Soret band was split into two bands [34]. This can be explained by the fact that PpIX is aggregated in aqueous solutions. In polar solvents the QI band was red-shifted compared to the QI band in less polar solvents (629 nm and 641 nm in EtOH and PBS, respectively) (Table 1), and the intensity decreased drastically. In the literature, it is often claimed that PpIX should be excited in vitro or in vivo at 630 nm. This wavelength of excitation is based on the absorption spectrum in EtOH. As it can be seen in Table 1 in water, PBS, and FBS, the QI band was located at 641, 641, and 640 nm, respectively.
Figure 2. UV-visible absorption spectra of PpIX (A), PPa (B) and PF (C) in different solvents (c =
1.87 μM).
The UV-visible absorption spectra of PPa in various solvents exhibited a Soret band and four Q bands in the spectral range 300–700 nm (Figure 2B and Table 1). The Soret band in non-aqueous solution was located between 409 nm and 415 nm whereas it was blue-shifted to 380 nm in water and PBS and 405 nm in FBS. QIV, QIII, QII, and QI were red-shifted from, respectively, 510 nm to 526 nm, 539 nm to 558 nm, 612 nm to 630 nm, and 671 nm to 677 nm, from toluene to PBS. The UV-visible absorption spectra of PPa showed a broad Soret band in glycerol, water, PBS, and FBS due to the formation of aggregates. Interestingly, all shifts of PPa in glycerol and FBS showed close values.
UV-visible absorption spectra of PF in the different solvents were less impacted by the change of the polarity than PpIX and PPa. The shape of the Soret band was broader in toluene, AcOEt and it became intense when the polarity of solvent increased. The Soret band was blue-shifted by 23 nm from toluene to PBS. The positions of QI and QII bands in water and PBS were blue-shifted by 12 nm, respectively, compared to toluene (Figure 2C). The maxima of the absorption bands are presented in Table 1. In FBS, due to the presence of proteins (30–45 g·L−1), the behavior was different to than in water. The
On the basis of the UV-visible absorption spectra of PSs, molar extinction coefficients (ε) were calculated for all observed bands in all solvents. For PpIX and PPa, there was a single abrupt jump of ε (for the Soret band) when moving from toluene, AcOEt, EtOH, or MeOH into glycerol, water, or PBS. That was not observed for PF due to the fact that PF is a mixture of different compounds that do not all behave in the same way (Table 2). The high value of ε for the QI band of PPa is interesting for PDT applications. ε for the QI band of PPa was 3.5 times higher than the one of PpIX and 16.5 times higher than the one of PF [35].
Fluorescence emission spectra presented in Figure 3 were recorded in different solvents at room temperature and at a concentration of 1.87 μM.
PpIX was excited at 400 nm. The highest was the polarity of the solvent and the blue-shift of the two fluorescence emission bands in agreement with the UV-visible absorption spectra (Figure 3A). All the maximum wavelengths are in the supporting information. Moreover, fluorescence intensity decreased with increase of the polarity of the solvent due to the lack of solubility of PpIX in aqueous media.
PPa was excited at 415 nm. The fluorescence emission spectra presented two bands and they were blue-shifted in polar solvents in accordance with the blue shift observed in the UV-visible absorption spectra. In water, PBS, and FBS at this concentration, the fluorescence intensity was very weak (Figure 3B), which could be explained by the aggregation [31].
PF was excited at 400 nm and a different behavior was observed in fluorescence emission spectra. Very weak maximum emission peaks at 633 nm and 696 nm were observed in toluene. The PF cores might have been in their highly quenched state, which did not generate fluorescence. The fluorescence intensity increased around 10 times in EtOH, and decreased again in polar solvents (Figure 3C). The emission bands of PF in water and PBS were blue-shifted for 15 ± 2 nm (Table S1) like the UV-visible absorption spectra indicating highly ordered aggregated structures [36]. In FBS, the fluorescence spectrum was similar to the one in non-polar solvent.
Table 1. Soret and Q bands (nm) of PpIX, PPa, and PF in different solvents at room temperature (c = 1.87 μM).
Solvent ET(30) PpIX PPa PF
Soret QIV QIII QII QI Soret QIV QIII QII QI Soret QIV QIII QII QI
Toluene 33.9 409 506 540 577 632 415 510 539 612 671 388 509 539 578 628 AcOEt 38.1 402 503 536 575 630 410 506 536 608 667 394 503 536 574 625 EtOH 51.9 402 503 537 575 629 411 509 539 609 667 398 503 536 574 625 MeOH 55.4 401 502 537 574 628 409 507 538 608 665 394 503 536 574 625 Glycerol 57.0 404 536 561 590 642 415 512 544 616 671 371 507 536 574 625 Water 63.1 352 532 557 589 641 380 522 554 625 677 365 507 542 567 616 PBS ≈63.1 365 532 557 589 641 379 526 558 630 677 365 507 542 567 616 FBS - 409 506 537 585 640 405 515 546 617 675 391 506 538 573 624
Table 2. Molar extinction coefficient (ε, (M−1·cm−1)) of PpIX, PPa, and PF in different solvents at room temperature.
Solvent PpIX PPa PF
Soret QIV QIII QII QI Soret QIV QIII QII QI Soret QIV QIII QII QI
Toluene 143,590 13,746 10,448 6481 5204 107,765 10,718 8589 7108 52,500 45,454 8535 5544 4705 2381 AcOEt 140,975 13,148 10,432 6113 5302 106,642 10,691 8455 6202 49,416 55,780 7351 4655 3854 2056 EtOH 142,440 13,305 10,615 6476 5067 92,874 9303 8403 7851 45,435 71,905 7832 4779 3661 1891 MeOH 139,797 12,410 10,048 6111 4579 94,334 9555 8771 8202 43,430 70,829 7333 4495 3497 1722 Glycerol 38,582 14,342 9180 8029 4909 46,057 5215 4989 4603 20,415 61,111 5151 3891 3531 1392 Water 40,603 15,326 9447 8177 5005 41,993 3900 3489 4179 17,311 61,617 3456 2806 2751 1044 PBS 47,433 11,565 7964 6945 4152 39,431 3699 3467 3937 15,444 59,023 3970 2786 2524 931 FBS 61,034 13,332 12,969 7436 4346 54,518 7172 6478 6808 31,092 45,952 5447 3515 2956 1387
Figure 3. Fluorescence emission and decay (λexc = 408 nm) of PpIX (A,D), PPa (B,E), and PF (C,F) in
different solvents (c = 1.87 μM).
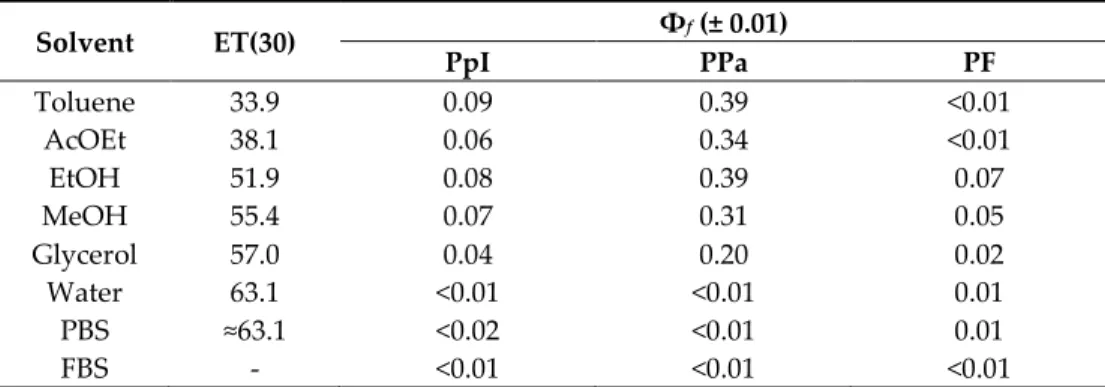
The fluorescence quantum yield (Φƒ) of PpIX was evaluated to be higher in less polar
solvents than in water, PBS, and FBS (Table 3). This is in good agreement with the fact that PpIX tends to aggregate in aqueous media [37]. Among the three PSs, PPa presented the best Φƒ which was 0.39 in toluene and EtOH. Φƒ of PF was low (below 0.1) and the
highest was obtained in EtOH and MeOH, possibly due to a better solubilization (Table 3).
Table 3. Φf of PpIX, PPa, and PF in different solvents at room temperature (c = 1.87 μM).
Solvent ET(30) Φf (± 0.01) PpI PPa PF Toluene 33.9 0.09 0.39 <0.01 AcOEt 38.1 0.06 0.34 <0.01 EtOH 51.9 0.08 0.39 0.07 MeOH 55.4 0.07 0.31 0.05 Glycerol 57.0 0.04 0.20 0.02 Water 63.1 <0.01 <0.01 0.01 PBS ≈63.1 <0.02 <0.01 0.01 FBS - <0.01 <0.01 <0.01
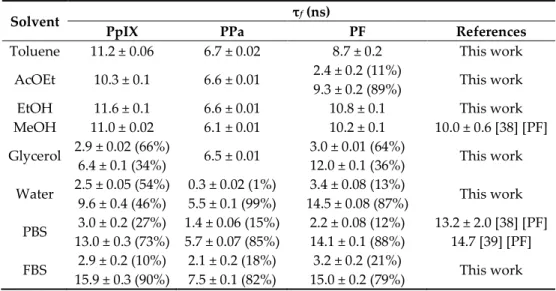
The fluorescence lifetime (τf) of PSs was measured by time-resolved fluorescence
after excitation at 408 nm. An exponential decay was fitted with an R2 ≈ 1.000. A
populations—monomers (long decay) and aggregates (short decay). PpIX exhibited mono-exponential decay (Figure 3D) in non-polar solvents, though the monomer– aggregate equilibrium was observed in glycerol, water, PBS, and FBS solutions: τf values
of 10.3–15.9 ns and 2.5–3.0 ns for PpIX monomer and aggregates, respectively (Table 4). Table 4. Fluorescence lifetimes (τf) of PpIX, PPa, and PF in different solvents at room temperature
(c = 1.87 μM, λexc = 408 nm).
Solvent τf (ns)
PpIX PPa PF References
Toluene 11.2 ± 0.06 6.7 ± 0.02 8.7 ± 0.2 This work
AcOEt 10.3 ± 0.1 6.6 ± 0.01 2.4 ± 0.2 (11%)
9.3 ± 0.2 (89%) This work
EtOH 11.6 ± 0.1 6.6 ± 0.01 10.8 ± 0.1 This work
MeOH 11.0 ± 0.02 6.1 ± 0.01 10.2 ± 0.1 10.0 ± 0.6 [38] [PF] Glycerol 2.9 ± 0.02 (66%) 6.4 ± 0.1 (34%) 6.5 ± 0.01 3.0 ± 0.01 (64%) 12.0 ± 0.1 (36%) This work Water 2.5 ± 0.05 (54%) 9.6 ± 0.4 (46%) 0.3 ± 0.02 (1%) 5.5 ± 0.1 (99%) 3.4 ± 0.08 (13%) 14.5 ± 0.08 (87%) This work PBS 3.0 ± 0.2 (27%) 13.0 ± 0.3 (73%) 1.4 ± 0.06 (15%) 5.7 ± 0.07 (85%) 2.2 ± 0.08 (12%) 14.1 ± 0.1 (88%) 13.2 ± 2.0 [38] [PF] 14.7 [39] [PF] FBS 2.9 ± 0.2 (10%) 15.9 ± 0.3 (90%) 2.1 ± 0.2 (18%) 7.5 ± 0.1 (82%) 3.2 ± 0.2 (21%) 15.0 ± 0.2 (79%) This work
As it is known that aggregates reduce the inter-system crossing (ISC) transition from
1PS* to 3PS* and τf of aggregated PPa was shorter. PPa exhibited mono-exponential and
bi-exponential decay in toluene, AcOEt, EtOH, MeOH, glycerol, and in water, PBS, and FBS, respectively (Figure 3E), confirming the presence of two forms—monomers (long decay) and aggregates (short decay). The τf value of PPa was between 6.1 to 7.5 ns for
monomers and 0.3 to 2.1 ns for aggregates (Table 4).
The solution of PF in toluene, EtOH, and MeOH exhibited mono-exponential decay with τf values of 8.7, 10.8, and 10.2 ns, respectively, which was in good agreement with
literature values [38,39], and two decays in the other solvents (Figure 3F). Once again, the short decay corresponded to the aggregated parts with lifetime of 2.4, 3.0, 3.4, 2.2, and 3.2 ns in AcOEt, glycerol, water, PBS, and FBS, respectively, since there was a longer decay for monomers (Table 4).
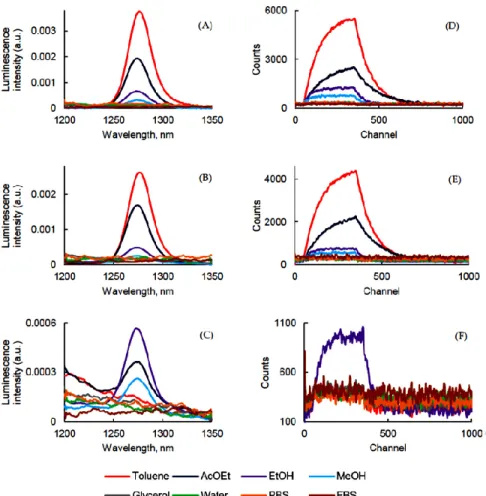
The 1O2 production of PSs in different solvents was carried out and 1O2 emission was
detected at 1270 ± 5 nm after excitation at 400 nm for PpIX, PF, and 415 nm for PPa (Figure 4).
Figure 4. 1O2 luminescence emission and decay (λexc = 400 nm for PpIX and PF and 415 nm for PPa)
of PpIX (A,D), PPa (B,E), and PF (C,F) in different solvents (c = 1.87 μM).
As expected, it was not possible to determine the Φ∆ of PpIX in aqueous solutions
due to possible aggregation of the PS, but it generated 1O2 very efficiently in toluene,
AcOEt, EtOH, and MeOH (Figure 4A). The same observation could be made with PPa. In our conditions we could not detect 1O2 emission in glycerol, water, FBS, or PBS (Figure
4B). On the contrary, PF (Figure 4C) generated 1O2 in EtOH, AcOEt, and MeOH (Table 5.
The detection of 1O2 was performed in D2O, since the τΔ value is higher than in H2O.
Indeed, solvents with high vibrational frequencies are more able to quench 1O2 [40].
However, no emission could be detected for PpIX and PPa whereas a Φ∆ of 0.15 was
obtained for PF. Additionally, 1O2 generation from PpIX, PPa, and PF in D2O was
monitored by using the most common fluorescence probe Singlet Oxygen Sensor Green (SOSG), which is not sensitive to hydroxyl radicals or superoxide. It clearly appeared that fluorescence emission intensity of SOSG increased during the time due to the production of 1O2 after excitation of PpIX, PPa, and PF. Sodium azide quenched 1O2 very efficiently
and fluorescence emission intensity of SOSG in the presence of quencher decreased (Figure 5).
Figure 5. Comparison of fluorescence emission intensity of Singlet Oxygen Sensor Green (SOSG)
and SOSG + NaN3 in D2O for 1O2 detection after excitation of PpIX (A), PPa (B), and PF (C) (λexc =
400 nm for PS and 495 nm for SOSG) (c = 3.1 μM).
Table 5. Φ∆ of PpIX, PPa, and PF in different solvents at room temperature (c = 1.87 μM).
Solvent Φ∆ (± 0.10) PpIX PPa PF Toluene 0.68 0.49 0.01 EtOH 0.92 0.53 0.80 MeOH 0.92 0.42 0.61 D2O - - 0.15
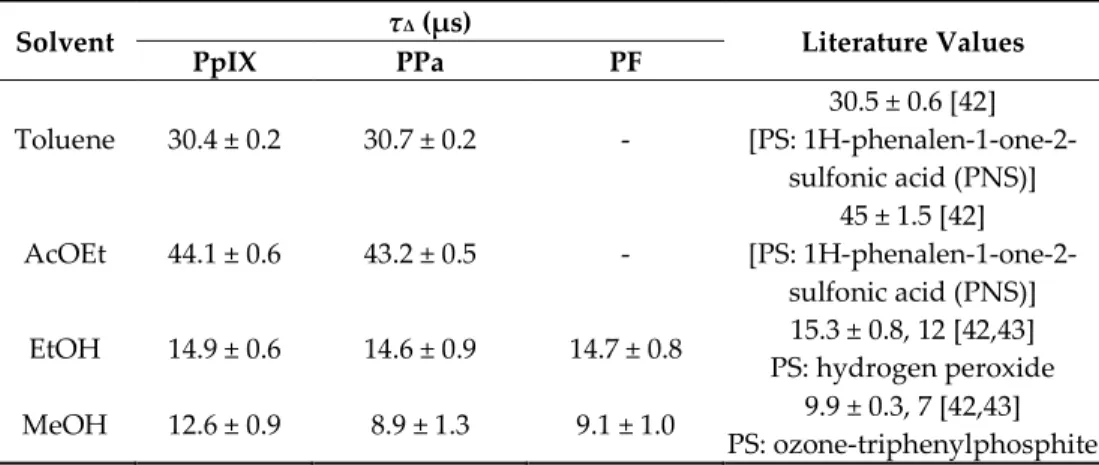
1O2 lifetime (τΔ) was determined. In solution, τΔ is governed by solvent deactivation through
electronic-vibrational energy transfer [41]. If no reaction happens between 1O2 and PS, τΔ value
should be the same for the three PSs in each solvent. What we can observe is in good relation with the literature data (Table 6).
Table 6. 1O2 lifetime of PpIX, PPa, and PF in different solvents at room temperature (c = 1.87 μM).
Solvent τΔ (μs) Literature Values
PpIX PPa PF Toluene 30.4 ± 0.2 30.7 ± 0.2 - 30.5 ± 0.6 [42] [PS: 1H-phenalen-1-one-2- sulfonic acid (PNS)] AcOEt 44.1 ± 0.6 43.2 ± 0.5 - 45 ± 1.5 [42] [PS: 1H-phenalen-1-one-2- sulfonic acid (PNS)] EtOH 14.9 ± 0.6 14.6 ± 0.9 14.7 ± 0.8 15.3 ± 0.8, 12 [42,43] PS: hydrogen peroxide MeOH 12.6 ± 0.9 8.9 ± 1.3 9.1 ± 1.0 9.9 ± 0.3, 7 [42,43] PS: ozone-triphenylphosphite
2.2. Influence of the Medium Viscosity
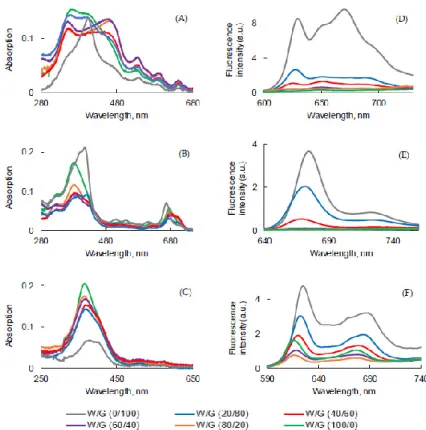
To evaluate the influence of the viscosity on the photophysical properties, a water/glycerol (W/G) mixture at various ratios was used. The higher the glycerol concentration, the higher the viscosity of the medium. The UV-visible absorption and fluorescence emission spectra of all PSs are shown in Figure 6.
For the three PSs, fluorescence emission decreased with addition of water. The highest was the viscosity and the lowest was the non-radiative decay.
The Soret band became larger and split in the solutions of PpIX with high concentrations of water, but the maximum wavelengths of four Q bands were not affected. A thin Soret band at 406 nm was only observed in 100% glycerol. This might be due to the fact that with the increase of the viscosity, the movement of the molecules was reduced and the formation of aggregates decreased or just due to the fact that aggregation occurred in water (Figure 6A).
UV-visible absorption spectra of PPa in water and in the mixture of water/glycerol showed a blue-shifted Soret band and weak, red-shifted Q bands. These band shifts might have been a result of the viscosity, which reduced the molecule’s mobility for aggregate formation (Figure 6B).
A totally different behavior was observed for PF. The intensity of the Soret band of PF decreased by increasing the viscosity of the medium and the Soret band became wider in 100% glycerol with a red-shift of the maximum of absorption (Figure 6C).
Figure 6. UV-visible absorption and fluorescence emission spectra ((λexc = 400 nm for PpIX, PF and
415 nm for PPa) of PpIX (A,D), PPa (B,E), and PF (C,F) in water/glycerol (W/G) mixtures (c = 3.1 μM) at room temperature.
The intensity of fluorescence emission of PpIX in the W/G mixture increased with the viscosity of the medium (Figure 6D). Φƒ value of PpIX in the W/G mixture increased
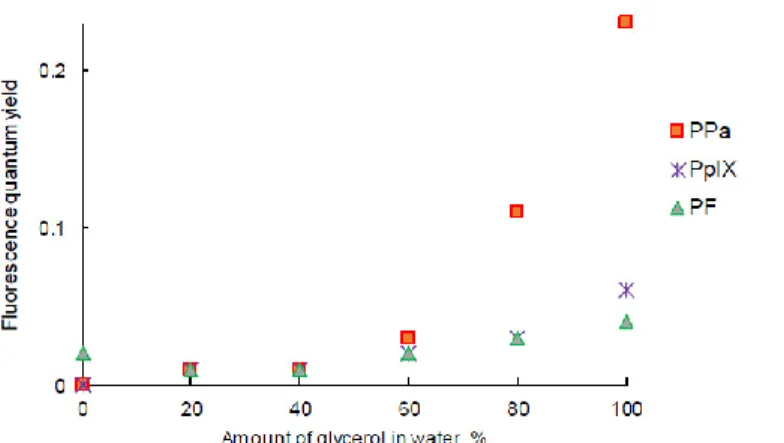
in highly viscous media due to the fact that the formation of aggregates was less important. PPa in glycerol showed two emission bands located at 675 nm and 724 nm (Figure 6E). The fluorescence emission intensity increased with the viscosity of medium. The viscous medium might prevent non radiative deactivation. The fluorescence emission intensity of PF also increased with the viscosity of the medium (except in water) and was red-shifted (Figure 6F) for 10 nm. It is interesting to note that for PF when the viscosity increased, fluorescence emission increased but absorption decreased. The highest Φƒ value for all PSs was calculated for the solution in glycerol (Figure 7).
Figure 7. Fluorescence quantum yield of PpIX, PPa, and PF in the water/glycerol (W/G) mixture (c =
3.1 μM).
Fluorescence emission decays presented in Figure S1 were measured in the different media. τf were evaluated and are presented in Table 7. In all mixtures two lifetimes were
detected, probably because of the presence of both monomers and aggregates. The τf
value of PpIX increased with the viscosity (Figure S1A). The solution of PPa in W/G (100/0, 80/20, and 60/40) ratio exhibited two decays, but starting at a ratio of 40/60 showed mono-exponential decay and τf increased in line with the medium viscosity (Figure S1B).
The solution of PF exhibited bi-exponential decay (Figure S1C) in all W/G mixtures. Table 7. Fluorescence lifetimes of PpIX, PPa, and PF (λexc = 408 nm, c = 3.1 μM) at room
temperature. (W/G, v/v) τf (ns) PpIX PPa PF W/G (100/0) 2.7 ± 0.02; 8.0 ± 0.1 0.3 ± 0.01; 5.5 ± 0.1 3.3 ± 0.1; 13.8 ± 0.2 W/G (80/20) 2.4 ± 0.04; 9.2 ± 0.3 0.1 ± 0.01; 5.6 ± 0.03 3.7 ± 0.02; 12.8 ± 0.04 W/G (60/40) 3.0 ± 0.01; 10.3 ± 0.1 0.1 ± 0.01; 5.7 ± 0.03 4.2 ± 0.02; 12.6 ± 0.04 W/G (40/60) 3.1 ± 0.02; 10.9 ± 0.2 5.5 ± 0.03 3.8 ± 0.04; 12.3 ± 0.1 W/G (20/80) 3.1 ± 0.05; 12.3 ± 0.4 5.9 ± 0.02 3.6 ± 0.02; 14.4 ± 0.05 W/G (0/100) 3.2 ± 0.02; 12.5 ± 0.2 6.5 ± 0.02 3.5 ± 0.01; 15.2 ± 0.05
Unfortunately, no correlation could be established between the fraction of monomers/aggregates and the viscosity of the medium. One reason might be that the polarity of the medium also changes when different amounts of glycerol and water are mixed. Therefore, the changes observed in W/G mixtures cannot only be attributed to the solution viscosity.
2.3. Influence of the Concentration
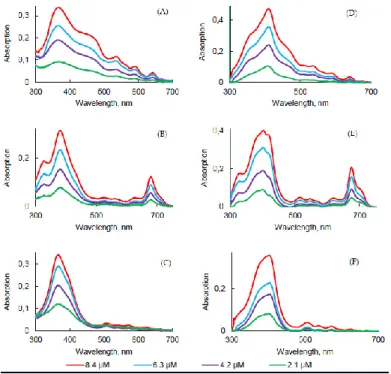
The influence of the concentration of PSs in PBS and FBS on photophysical properties was evaluated. As expected, the increase in concentration induced an increase in intensity, but no change in the absorption band maximum wavelength was observed in this concentration range for all PSs (Figure 8A–C).
Figure 8. UV-visible absorption spectra of PpIX (A,D), PPa (B,E), and PF (C,F) in PBS (A–C) and
FBS (D–F) at different concentrations.
The concentration increase led to a decrease of the fluorescence emission intensity for all PSs. Aggregation was higher in concentrated solutions (Figure 9D–F). The higher was the concentration, the lower was the fluorescence. Φƒ of all PSs in PBS at different
concentrations were measured and were all less than 1%. However, the results obtained in FBS turned out to be the opposite in comparison with PBS. As the concentration of all PSs increased, fluorescence emission of all PSs increased. The aggregation process might be lower in FBS than in PBS due to the interaction with the proteins.
Figure 9. Fluorescence emission spectra (λexc = 400 nm for PpIX, PF and 415 nm for PPa) of PpIX
Fluorescence decays were recorded (Figure S2A) and τf were evaluated (Table 8).
PpIX in PBS or FBS at different concentrations exhibited bi-exponential decay. The longest τf likely corresponded to the monomer decay time and the shorter lifetime was
likely due to aggregates’ decay time. PpIX in PBS at different concentrations exhibited bi-exponential decay. We could observe a slight increase of the ratio aggregate/monomers with the concentration increase in PBS but not in FBS. For PPa, only one population was observed in PBS between 5.6 and 6.8 ns. In FBS, a bi-exponential decay suggested the presence of both aggregates and monomers. For PF, no effect of the concentration could be observed. In PBS, 8% of aggregates and 92% of monomers can be evaluated whereas it was 14–17 % of aggregates and 83–86% of monomers in FBS. Table 8. Fluorescence lifetimes of PpIX, PPa, and PF in PBS and FBS (λexc = 408 nm) at room
temperature. Concentration (μM) τf (ns) PpIX PPa PF PBS 2.1 3.8 ± 0.2 (21%) 14.5 ± 0.2 (79%) 6.8 ± 0.1 2.1 ± 0.3 (8%) 14.0 ± 0.2 (92%) 4.2 3.6 ± 0.2 (22%) 13.8 ± 0.2 (78%) 5.9 ± 0.1 2.7 ± 0.4 (8%) 14.8 ± 0.2 (92%) 6.3 3.5 ± 0.2 (25%) 12.8 ± 0.2 (75%) 5.8 ± 0.1 2.4 ± 0.3 (8%) 14.7 ± 0.2 (92%) 8.4 3.8 ± 0.2 (27%) 13.7 ± 0.2 (73%) 5.6 ± 0.1 2.6 ± 0.4 (8%) 14.8 ± 0.2 (92%) FBS 2.1 3.7 ± 0.2 (13%) 17.0 ± 0.1 (87%) 3.5 ± 0.3 (13%) 8.2 ± 0.1 (87%) 3.3 ± 0.3 (17%) 15.3 ± 0.2 (83%) 4.2 3.6 ± 0.3 (12%) 17.1 ± 0.2 (88%) 2.5 ± 0.6 (5%) 8.2 ± 0.1 (95%) 3.6 ± 0.3 (15%) 15.5 ± 0.2 (85%) 6.3 3.9 ± 0.4 (11%) 17.8 ± 0.2 (89%) 2.6 ± 0.5 (5%) 8.2 ± 0.1 (95%) 3.4 ± 0.3 (14%) 15.6 ± 0.2 (86%) 8.4 3.9 ± 0.4 (11%) 17.8 ± 0.2 (89%) 3.2 ± 0.2 (4%) 8.5 ± 0.2 (96%) 3.4 ± 0.3 (14%) 15.7 ± 0.2 (86%)
2.4. Influence of the Temperature
The influence of temperature on UV-visible absorption, fluorescence emission, and lifetime of PpIX, PPa, and PF in aqueous media was evaluated. UV-visible absorption and fluorescence emission spectra of the PSs in PBS and FBS after heating from 10 °C to 40 °C are presented in Figure 10.
For PpIX, in PBS, the intensity of the Soret band decreased with the increase of temperature (Figure 10A), whereas the intensity of the Q bands increased, except QI. In FBS (Figure 10D), a different behavior could be observed with a decrease of all band intensities, except QI. For PPa in PBS (Figure 10B), the intensity of the Soret band decreased with the increase of temperature and the QI band shape changed and was red-shifted from 680 nm to 712 nm with an isobestic point at 685 nm. In FBS (Figure 10E), the intensity of the Soret band increased with the increase of temperature as well as the QI band, with a change of shape and an isobestic point at the same 685 nm. For PF, almost no change could be observed in PBS (Figure 10C) whereas in FBS, a blue shift of the Soret band and a decrease of intensity was observed by increasing the temperature, as well as an increase of QI intensity (Figure 10F).
Figure 10. UV-visible absorption spectra (λexc = 400 nm for PpIX and PF and 415 nm for PPa) of
PpIX (A,D), PPa (B,E), and PF (C,F) in PBS (A–C) and FBS (D–E) at different temperatures (c = 3.1 μM).
Fluorescence emission spectra were recorded in PBS and FBS at different temperatures (Figure 11). Whatever PS, the fluorescence emission intensity increased when the temperature rose from 10 to 40 °C. This might be have been because more monomers were in solution exhibiting fluorescence. For PpIX in PBS a slight red shift could be observed for the first band (Figure 11A) whereas in PBS, it was a slight blue-shift. No shift was detected for PPa (Figure 11B,E). Concerning PF, a red shift was observed both in PBS and FBS.
Figure 11. Fluorescence emission spectra (λexc = 400 nm for PpIX and PF and 415 nm for PPa) of
PpIX (A,D), PPa (B,E), and PF (C,F) in PBS (A–C) and FBS (D–F) at different temperatures (c = 3.1 μM).
Fluorescence decays were recorded (Figure S3) and τf were evaluated (Table 9). PpIX
in PBS of FBS at different temperatures exhibited bi-exponential decay. The longest τf
likely corresponded to the monomer decay time and the shorter lifetime and was likely due to the aggregate decay time. A decrease of the shortest τf could be observed with the
increase of the temperature in both solutions. Moreover, the ratio aggregate/monomer also seemed to decrease with the increase of the temperature. For PPa, only one τf was
calculated in PBS. At low temperature (10 and 2 °C), both monomers and aggregates were present in FBS whereas aggregates disappeared at high temperature (30 and 40 °C). For PF, no effect of temperature was detected in PBS, whereas both short and long τf
Table 9. Fluorescence lifetimes of PpIX, PPa, and PF (λexc = 408 nm, c = 3.1 μM).
Temperature, °C Fluorescence lifetime (ns)
PpIX PPa PF PBS 10 5.7 ± 0.4 (19%) 16.4 ± 0.3 (81%) 5.8 ± 0.1 2.4 ± 0.3 (9%) 14.6 ± 0.2 (91%) 20 4.6 ± 0.3 (16%) 15.4 ± 0.2 (84%) 5.6 ± 0.1 2.9 ± 0.3 (9%) 14.8 ± 0.2 (91%) 30 4.6 ± 0.4 (13%) 13.9 ± 0.2 (87%) 5.5 ± 0.1 2.6 ± 0.2 (9%) 14.6 ± 0.2 (91%) 40 4.0 ± 0.4 (13%) 14.1 ± 0.2 (87%) 5.3 ± 0.1 2.6 ± 0.3 (9%) 14.6 ± 0.2 (91%) FBS 10 3.9 ± 0.5 (9%) 18.0 ± 0.2 (91%) 2.8 ± 0.3 (10%) 7.8 ± 0.1 (90%) 3.0 ± 0.2 (16%) 15.0 ± 0.2 (84%) 20 3.4 ± 0.4 (8%) 18.0 ± 0.2 (92%) 2.0 ± 0.3 (7%) 7.7 ± 0.1 (93%) 2.8 ± 0.2 (16%) 14.7 ± 0.2 (84%) 30 3.3 ± 0.4 (7%) 17.9 ± 0.2 (93%) 7.3 ± 0.1 2.8 ± 0.2 (16%) 14.7 ± 0.2 (84%) 40 3.2 ± 0.4 (6%) 17.6 ± 0.2 (94%) 7.2 ± 0.1 2.6 ± 0.2 (16%) 13.8 ± 0.2 (84%) 2.5. Influence of pH Medium
pH could also have an influence on photophysical properties. The UV-visible absorption, fluorescence emission, and lifetime of all PSs in PBS with a concentration of 3.1 M were measured under different pH conditions (pH 5.0–8.0). For PpIX, increasing pH from 5 to 8 led to a red-shifted Soret band from 354 nm to 375 nm whereas the Q bands were pH-independent (Figure 12A).
Figure 12. UV-visible absorption (A–C) and fluorescence emission (D–F) spectra (λexc = 400 nm for
PpIX and PF and 415 nm for PPa) of PpIX (A,D), PPa (B,E), and PF (C,F) in PBS under different pH (c = 3.1 μM) at room temperature.
By increasing the pH, PPa showed an increase of the Soret and QI band intensities (Figure 12B). Two isobestic points could be observed at 415 nm and 685 nm, exactly the same as those observed by changing the temperature. This is in good agreement with the presence of two different species that could be monomers or aggregates. The Soret band of PF increased with pH and the maximum of absorption and Q bands were not affected (Figure 12C).
For all PSs (Figures 12D, 12E, and 12F), fluorescence increased with the increase of pH in relation to the formation of monomers and disappearance of aggregates [44–46] but we could also observe a decrease of the band at 717 nm for PPa (Figure 12E). Φƒ of all PSs
in PBS under different pH medium were below 0.01.
τƒ value of PpIX, PPa, and PF in PBS was also measured at different pH (Figure S4A).
For PpIX, no aggregation could be observed at pH = 5 whereas aggregation occurred at pH 6–8 with the appearance of a short decay. At pH 5 and 6, the height of fast decay of PPa was higher than at pH 7 and 8, which was due to aggregation. At pH 5 and 6, the PPa was more aggregated with low τƒ value, so only τƒ of longer decay is given in the Table
Table 10. Fluorescence lifetimes of PpIX, PPa, and PF in PBS (λexc = 408 nm, c = 3.1 μM) at room temperature. pH τƒ (ns) PpIX PPa PF 5 5.0 ± 0.2 3.5 ± 0.4 2.2 ± 0.2 (21%) 11.2 ± 0.2 (79%) 6 5.7 ± 0.4 (42%) 13.1 ± 0.5 (58%) 5.1 ± 0.3 3.6 ± 0.5 (9%) 14.8 ± 0.2 (91%) 7 4.3 ± 0.06 (30%) 14.6 ± 0.1 (70%) 5.5 ± 0.1 2.7 ± 0.3 (9%) 15.0 ± 0.2 (91%) 8 3.7 ± 0.2 (23%) 14.6 ± 0.2 (77%) 5.6 ± 0.09 2.4 ± 0.2 (8%) 14.4 ± 0.2 (92%) 3. Materials and Methods
Protoporphyrin IX, Pyropheophorbide-a, and Porfimer sodium (Photofrin®) were
purchased from Sigma (Saint-Louis, MO, USA), BOC Sciences (Shirley, NY, USA), and Oncothai (Lille, France), respectively, and used without further purification. The stock solution of PpIX and PPa was prepared in dimethylsulfoxide (DMSO), and PF in methanol (MeOH). FBS was purchased from Sigma (Saint-Louis, MO, USA). PBS was prepared by mixing the exact volume of 0.2 M sodium phosphate, dibasic dehydrate and 0.2 M sodium phosphate, monobasic, monohydrate, and pH was adjusted to 7.4. The stock solution of SOSG in methanol was prepared by dissolving 100 μg vial in 33.0 μL of methanol and sodium azide solution was prepared in water with concentration of 0.15 M.
3.1. Spectroscopic Measurements
UV-visible absorption spectra were recorded on a UV-3600 UV-visible double beam spectrophotometer (Shimadzu, Marne La Vallee, France). Fluorescence spectra were recorded on a Fluorolog FL3-222 spectrofluorimeter (Horiba JobinYvon, Longjumeau, France) equipped with 450 W Xenon lamp, a thermo-stated cell compartment (25 °C), a UV-visible photomultiplier R928 (Hamamatsu, Japan) and an InGaAs infrared detector (DSS-16A020L Electro-Optical System Inc, Phoenixville, PA, USA). The excitation beam was diffracted by a double ruled grating SPEX monochromator (1200 grooves/mm blazed at 330 nm). The emission beam was diffracted by a double-ruled grating SPEX monochromator (1200 grooves/mm blazed at 500 nm). The 1O2 phosphorescence
detection was measured with a HORIBA SpectraLED emitting at 415 nm, by a Multi-Channel Scaling (MCS) technique. The excitation pulse length was 102 μs and 600,000 pulses were averaged. 1O2 emission was detected through a double-ruled grating
SPEX monochromator (600 grooves/mm blazed at 1 μm) and a long-wave pass (780 nm). All spectra were measured in 4-face quartz cuvettes. All the emission spectra (fluorescence and 1O2 luminescence) were displayed with the same absorbance (less than
0.2) with the lamp and photomultiplier correction.
Fluorescence quantum yield (Φƒ) was calculated with tetraphenylporphyrin (TPP) in
toluene as reference (Φƒ = 0.11) [47], using the following Equation (1):
Φ = Φ × I I × DO DO × n n (1)
where Φf and Φfo, If and Ifo, DO and DOo, and n and no are the quantum yields,
fluorescence emission intensities, optical densities, and refraction indices of the sample and reference, respectively.
1O2 quantum yield (Φ∆) was measured with TPP in toluene (Φ∆ = 0.68), rose Bengal in
Φ∆= Φ∆ ×
I
I ×
DO
DO (2)
where ΦΔ and ΦΔo, I and Io, and DO and DOo are the luminescence quantum yields of
singlet oxygen, the luminescence intensities, and the optical densities of the sample and references, respectively.
3.2. Fluorescence and Luminescence Decays
Time-resolved experiments were performed using, for excitation, a pulsed laser diode emitting at 408 nm (LDH-P-C-400M, FWHM < 70 ps, 1 MHz) coupled with a driver PDL 800-D (both PicoQuant GmbH, Berlin, Germany) and for detection, an avalanche photodiode SPCM-AQR-15 (EG&G, Vaudreuil, Canada) coupled with a 550 nm long-wave pass filter as detection system. The acquisition was performed by a PicoHarp 300 module with a 4-channel router PHR-800 (both PicoQuant GmbH, Berlin, Germany). The fluorescence decays were recorded using the single photon counting method. Data were collected up to 1000 counts accumulated in the maximum channel and analyzed using Time Correlated Single Photon Counting (TCSPC) software Fluofit (PicoQuant GmbH, Berlin, Germany) based on iterative deconvolution using a Levensberg– Marquandt algorithm. 1O2 lifetime (τΔ) measurements were performed on a TEMPRO-01
spectrophotometer (Horiba Jobin Yvon, Palaiseau, France). The apparatus was composed of a pulsed diode excitation source SpectralLED-415 emitting at 415 nm, a cuvette compartment, a Seya–Namioka type emission monochromator (between 600 and 2000 nm) and a H10330-45 near-infrared photomultiplier tube with a thermoelectric cooler (Hamamatsu, Massy, France) for the detection. The system was monitored by a single-photon counting controller FluoroHub-B and the software DataStation and DAS6 (Horiba Jobin Yvon, Palaiseau, France).
4. Conclusions
This study focalized on three PSs that are used clinically (PpIX and PF) or for in vivo experiments (PPa). Our team proposed PPa coupled to folic acid to treat ovarian metastases by PDT (Patent WO/2019/016397).
By analyzing the photophysical properties of these three PSs in different conditions, we highlighted the fact that each PS is unique and reacts very differently depending on its chemical structure and concentration.
If the change of the medium polarity does not greatly affect the UV-visible absorption spectrum of PF, there is a drastic change for PpIX and PPa. In the literature, it is often claimed that PpIX should be excited at 630 nm in vitro or in vivo. This excitation wavelength is based on the absorption spectrum in ethanol. In FBS and PBS, which are aqueous media more similar to physiological media, the QI band is located at 641 nm.
Depending on the localization of the PS in the cells, the local viscosity can be very different. We could also observe that modifying the solvent viscosity did not greatly affect the maximal wavelengths of absorption of QI in PpIX and PF but it was blue-shifted for PPa for 10 nm (from 678 nm to 668 nm).
Temperature change slightly affected the UV-visible absorption spectra of PpIX and PF but drastically modified the UV-visible absorption of PPa in the range of 10 to 40 °C.
Finally, modifying pH also induced a shift of QI band for PPa of 25 nm (from 704 nm to 679 nm).
Perhaps the most interesting results are the Φ∆ obtained in different solvents.
Depending on the solvent, the values were totally different. In toluene, we could not detect any 1O2 whereas the Φ∆ were quite good for PpIX and PPa 0.68 and 0.49,
respectively. In EtOH, the Φ∆ was 0.92, 0.53, and 0.80 for PpIX, PPa, and PF, respectively.
If we switched to D2O, we could not detect any 1O2 ofPpIX or PPa and the Φ∆ was 0.15 for
PF. Moreover, in real-life applications, the PS is ideally in a cellular context. The presence of protein, lipid, and other biomolecules molecules will also affect the photophysics of
the PS. This raised the question of what type of experiments and which solvent should be used in the solution when performing in vitro studies.
Supplementary Materials: The following are available online at
www.mdpi.com/1424-8247/14/2/138/s1, Figure S1: Fluorescence decay of PpIX (A), PPa (B), and PF (C) in water/glycerol mixture (λexc = 408 nm, c = 3.1 μM). Figure S2: Fluorescence decay of PpIX (A),
PPa (B), and PF (C) in PBS at different concentrations (λexc = 408 nm). Figure S3: Fluorescence decay
of PpIX (A), PPa (B), and PF (C) in PBS at different temperatures (λexc = 408 nm, c = 3.1 μM). Figure
S4: Fluorescence decay of PpIX (A), PPa (B), and PF (C) in PBS under different pH (λexc = 408 nm, c =
3.1 μM). Table S1: Fluorescence emission bands (nm) of PpIX, PPa, and PF in different solvents (c =1.87 μM).
Author Contributions: Conceptualization, B.M., S.M., C.F., and P.A.; methodology, C.F.; software,
P.A; validation, P.A., C.F., and S.A.; formal analysis, B.M.; investigation, B.M.; resources, P.A. and C.F.; data curation, B.M.; writing—original draft preparation, B.M.; writing—review and editing, P.A., S.M., S.A., and C.F.; visualization, C.F.; supervision, C.F. and I.T.; project administration, C.F. and I.T; funding acquisition, C.F. and P.A. All authors have read and agreed to the published version of the manuscript.
Funding: This research was funded by ERASMUS+. Institutional Review Board Statement: Not applicable. Informed Consent Statement: Not applicable.
Data Availability Statement: The data presented in this study are available on request from the
corresponding author.
Acknowledgments: We would like to thank the program ERASMUS + (mobility for study) for the
financial support.
Conflicts of Interest: The authors declare no conflict of interest. References
1. Price, M.; Heilbrun, L.; Kessel, D. Effects of the oxygenation level on formation of different reactive oxygen species during photodynamic therapy. Photochem. Photobiol. 2013, 89, 683–686.
2. Castano, A.P.; Mroz, P.; Hamblin, M.R. Photodynamic therapy and anti-tumor immunity. Nat. Rev. Cancer 2006, 6, 535–545. 3. Sansaloni-Pastor, S.; Bouilloux, J.; Lange, N. The Dark Side: Photosensitizer Prodrugs. Pharmaceuticals 2019, 12, 148. 4. Abrahamse, H.; Hamblin, M.R. New Photosensitizers for Photodynamic Therapy. Biochem. J. 2016, 473, 347–364.
5. Stamati, I.; Kuimova, M.K.; Lion, M.; Yahioglu, G.; Phillips, D.; Deonarain, M.P. Novel Photosensitisers Derived from Pyropheophorbide-a: Uptake by Cells and Photodynamic Efficiency in Vitro. Photochem. Photobiol. Sci. 2010, 9, 1033–1041. 6. Bonneau, C.; Vever-Bizet, C. Tetrapyrrole photosensitisers, determinants of subcellular localisation and mechanisms of
photodynamic processes in therapeutic approaches. Exp. Op. Therap. Pat. 2008, 18, 1011–1025.
7. Mojzisova, H.; Bonneau, S.; Brault, D. Structural and physico-chemical determinants of the interactions of macrocyclic photosensitizers with cells. Eur. Biophys. J. 2007, 36, 943–953.
8. Kelbauskas, L.; Dietel, W. Internalization of Aggregated Photosensitizers by Tumor Cells: Subcellular Time-resolved Fluorescence Spectroscopy on Derivatives of Pyropheophorbide-a Ethers and Chlorin e6 under Femtosecond One- and Two-photon Excitation. Photochem. Photobiol. 2002, 76, 686–694.
9. Shiah, J.G.; Konák, C.; Spikes, J.D.; Kopecek, J. Influence of pH on aggregation and photoproperties of n-(2-hydroxypropyl) methacrylamide copolymer-meso-chlorin e6 conjugates. Drug Deliv. 1998, 5, 119–126.
10. Roeder, B.; Wabnitz, H. Time-resolved fluorescence spectroscopy of hematoporphyrin, mesoporphyrin, pheophorbide a and chlorin e6 in ethanol and aqueous solution. J. Photochem. Photobiol. B 1987, 1, 103–113.
11. Margalit, R.; Cohen, S. Studies of hematoporphyrin and hematoporphyrin derivative equilibria in heterogeneous systems. Porphyrin-liposome binding and porphyrin aqueous dimerization. Biochim. Biophys. Acta 1983, 736, 163–170.
12. Margalit, R.; Rotenberg, M. Thermodynamics of porphyrin dimerization in aqueous solutions. Biochem. J. 1984, 219, 445–450. 13. Eichwurzel, I.; Stiel, H.; Röder, B. Photophysical studies of the pheophorbide a dimer. J. Photochem. Photobiol. B 2000, 54, 194–
200.
14. Macdonald, J.I.; Dougherty, J.T. Basic principles of photodynamic therapy. J. Porphyr. Phthalocyanines 2001, 5, 105–129. 15. Niedre, M.J.; Yu, C.S.; Patterson, M.; Wilson, B.C. Singlet oxygen luminescence as an in vivo photodynamic therapy dose
16. Kohoutova, D.; Haidry, R.; Banks, M.; Butt, M.A.; Dunn, J.; Thorpe, S.; Lovat, L. Long-term outcomes of the randomized controlled trial comparing 5-aminolaevulinic acid and Photofrin photodynamic therapy for Barrett’s esophagus related neoplasia. Scand. J. Gastroenterol. 2018, 53, 527–532.
17. Schaffer, M.; Schaffer, P.M.; Vogesser, M.; Ertl-Wagner, B.; Rauch, J.; Oberneder, R.; Jori, G.; Hofstetter, A.; Dühmke, E. Application of Photofrin II as a specific radiosensitising agent in patients with bladder cancer—A report of two cases.
Photochem. Photobiol. Sci. 2002, 1, 686–689.
18. Schaffer, M.; Ertl-Wagner, B.; Schaffer, P.M.; Kulka, U.; Jori, G.; Dühmke, E.; Hofstetter, A. The Application of Photofrin II® as
a Sensitizing Agent for Ionizing Radiation—A New Approach in Tumor Therapy. Curr. Med. Chem. 2005, 12, 1209–1215. 19. Schaffer, M.; Ertl-Wagner, B.; Schaffer, P.M.; Kulka, U.; Jori, G.; Wilkowski, R.; Hofstetter, A.; Dühmke, E. Feasibility of
Photofrin II as a Radiosensitizing Agent in Solid Tumors—Preliminary Results. Onkologie 2006, 29, 514–519.
20. Kou, J.; Dou, D.; Yang, L. Porphyrin photosensitizers in photodynamic therapy and its applications. Oncotarget 2017, 8, 81591– 81603.
21. Schaffer, P.; Batash, R.; Ertl-Wagner, B.; Hofstetter, A.; Asna, N.; Schaffer, M. Treatment of cervix carcinoma FIGO IIIb with Photofrin II as a radiosensitizer: A case report. Photochem. Photobiol. Sci. 2019, 18, 1275–1279.
22. Schaffer, M.; Schaffer, P.M.; Corti, L.; Gardiman, M.; Sotti, G.; Hofstetter, A.; Dühmke, E. Photofrin as a specific radiosensitizing agent for tumors: Studies in comparison to other porphyrins, in an experimental in vivo model. J. Photochem.
Photobiol. B 2002, 66, 157–164.
23. Chang, C.J.; Cheng, S.M.; Nelson, J.S. Microvascular effects of Photofrin®-induced photodynamic therapy. Photodiagn. Photodyn. Ther. 2007, 4, 95–99.
24. Berger, Y.; Greppi, A.; Siri, O.; Neier, R.; Juillerat-Jeanneret, L. Ethylene glycol and amino acid derivatives of 5-aminolevulinic acid as new photosensitizing precursors of protoporphyrin IX in cells. J. Med. Chem. 2000, 43, 4738–4746.
25. Collaud, S.; Juzeniene, A.; Moan, J.; Lange, N. On the selectivity of 5-aminolevulinic acid-induced protoporphyrin IX formation. Curr. Med. Chem. Anticancer Agents 2004, 4, 301–316.
26. Moan, J.; Bech, Ø.; Gaullier, J.M.; Stokke, T.; Steen, H.B.; Ma, L.; Berg, K. Protoporphyrin IX accumulation in cells treated with 5-aminolevulinic acid: Dependence on cell density, cell size and cell cycle. Int. J. Cancer 1998, 75, 134–139.
27. Choudhary, S.; Nouri, K.; Elsaie, M.L. Photodynamic therapy in dermatology: A review. Lasers Med. Sci. 2009, 24, 971–980. 28. Guelluy, P.H.; Marie-Pierre, F.A.; Grammenos, A.; Lecart, S.; Piette, J.; Hoebeke, M. Optimizing photodynamic therapy by
liposomal formulation of the photosensitizer pyropheophorbide-a methyl ester: In vitro and ex vivo comparative biophysical investigations in a colon carcinoma cell line. Photochem. Photobiol. Sci. 2010, 9, 1252–1260.
29. Siwawannapong, K.; Zhang, R.; Lei, H.; Jin, Q.; Tang, W.; Dong, Z.; Lai, R.Y.; Liu, Z.; Kamkaew, A.; Cheng, L. Ultra-small Pyropheophorbide-a Nanodots for Near-infrared Fluorescence/Photoacoustic Imaging-guided Photodynamic Therapy.
Theranostics 2020, 10, 62–73.
30. Scolaro, L.M.; Castriciano, M.; Romeo, A.; Patanè, S.; Cefalì, A.; Allegrini, M.G. Aggregation Behavior of Protoporphyrin IX in Aqueous Solutions: Clear Evidence of Vesicle Formation. J. Phys. Chem. B 2002, 106, 2453–2459.
31. Delanaye, L.; Bahri, M.; Tfibel, F.; Fontaine-Aupart, M.; Mouithys-Mickalad, A.; Heine, B.; Piette, J.; Hoebeke, M. Physical and
chemical properties of pyropheophorbide-a methyl ester in ethanol, phosphate buffer and aqueous dispersion of small unilamellar dimyristoyl-L-α-phosphatidylcholine vesicles. Photochem. Photobiol. Sci. 2006, 5, 317–325.
32. Gomes, A.T.P.C.; Neves, M.G.P.M.S.; Cavaleiro, J.A.S. Cancer, Photodynamic Therapy and Porphyrin-Type Derivatives. An
Acad. Bras. Cienc. 2018, 90, 993–1026.
33. Kubát, P.; Lang, K.; Procházková, K.; Anzenbacher, P. Self-Aggregates of Cationic meso-Tetratolylporphyrins in Aqueous Solutions. Langmuir 2003, 19, 422–428.
34. Ding, H.; Sumer, B.D.; Kessinger, C.W.; Dong, Y.; Huang, G.; Boothman, D.A.; Gao, J. Nanoscopic micelle delivery improves the photophysical properties and efficacy of photodynamic therapy of protoporphyrin IX. J. Control Release 2011, 151, 271–277. 35. Al-Omari, S.; Ali, A. Photodynamic activity of pyropheophorbide methyl ester and pyropheophorbide-a in
dimethylformamide solution. Gen. Physiol. Biophys. 2009, 28, 70–77.
36. Teng, K.W.; Lee, S.H. Characterization of Protoporphyrin IX Species in Vitro Using Fluorescence Spectroscopy and Polar Plot Analysis. J. Phys.Chem. B 2019, 123, 5832–5840.
37. Zampini, G.; Planas, O.; Marmottini, F.; Gulías, O.; Agut, M.; Nonell, S.; Latterini, L. Morphology effects on singlet oxygen production and bacterial photoinactivation efficiency by different silica-protoporphyrin IX nanocomposites. RSC Adv. 2017, 7, 14422–14429.
38. Russell, J.A.; Diamond, K.R.; Collins, T.J.; Tiedje, H.F.; Hayward, J.; Farrell, T.; Patterson, M.S.; Fang, Q. Characterization of Fluorescence Lifetime of Photofrin and Delta-Aminolevulinic Acid Induced Protoporphyrin IX in Living Cells Using Single- and Two-Photon Excitation. IEEE J. Sel. Top. Quant. 2008, 14, 158–166.
39. Cubeddu, R.; Ramponi, R.; Bottiroli, G. Time-resolved fluorescencespectroscopy of hematoporphyrin derivatives in micelles.
Chem. Phys. Lett. 1986, 128, 439–442.
40. Foote, C.S.; Krasnovsky, A.A.; Fu, Y.; Selke, M.; Karney, W.L. Singlet oxygen dimol-sensitized luminescence and reactions of singlet oxygen with organometallics. In The Activation of Dioxygen and Homogeneous Catalytic Oxidation; Barton, D.H.R., Marttell, A.E., Sawyer, D.T., Eds.; Plenum Press: New York, NY, USA; London, UK, 1993; pp. 411–422.
41. Thorning, F.; Jensen, F.; Ogilby, P.R. Modeling the Effect of Solvents on Nonradiative Singlet Oxygen Deactivation: Going beyond Weak Coupling in Intermolecular Electronic-to-Vibrational Energy Transfer. J. Phys. Chem. B 2020, 124, 2245–2254. 42. Bregnhøj, M.; Westberg, M.; Minaev, B.F.; Ogilby, P.R. Singlet Oxygen Photophysics in Liquid Solvents: Converging on a
Unified Picture. Acc. Chem. Res. 2017, 50, 1920–1927.
43. Malik, S.; Khan, S.A.; Ahuja, P.; Arya, S.K.; Sahu, S.; Sahu, K. Singlet oxygen-mediated synthesis of malarial chemotherapeutic agents. Med. Chem. Res. 2013, 22, 5633–5653.
44. Sobczynski, J.; Tønnesen, H.H.; Kristensen, S. Influence of aqueous media properties on aggregation and solubility of four structurally related meso-porphyrin photosensitizers evaluated by spectrophotometric measurements. Die Pharmazie. 2013, 68, 100–109.
45. Siggel, U.; Bindig, U.; Endisch, C.; Komatsu, T.; Tsuchida, E.; Voigt, J.; Fuhrhop, J.H. Photophysical and Photochemical Properties of Porphyrin Aggregates. Ber. Bunsenges. Phys. Chem. 1996, 100, 2070–2075.
46. Inamura, I.; Uchida, K. Association Behavior of Protoporphyrin IX in Water and Aqueous Poly(N-vinylpyrrolidone) Solutions. Interaction between Protoporphyrin IX and Poly(N-vinylpyrrolidone). Bull. Chem. Soc. Jpn. 1991, 64, 2005–2007.
47. Giovanetti, R.; Alibabaei, L.; Petetta, L. Aggregation behaviour of a tetracarboxylic porphyrin in aqueous solution. J. Photoch.
Photobio. A. 2010, 211, 108–114.
48. Figueiredo, T.L.C.; Johnstone, R.A.W.; Sørensen, A.M.P.S.; Burget, D.; Jacques, P. Determination of Fluorescence Yields, Singlet Lifetimes and Singlet Oxygen Yields of Water-Insoluble Porphyrins and Metalloporphyrins in Organic Solvents and in Aqueous Media. Photochem. Photobiol. 1999, 69, 517–528.
49. Redmond, R.W.; Gamlin, J.N. A compilation of singlet oxygen yields from biologically relevant molecules. Photochem. Photobiol.