. . . .
. . . .
Coronary heart disease
Impact of soluble fms-like tyrosine kinase-1 and
placental growth factor serum levels for risk
stratification and early diagnosis in patients with
suspected acute myocardial infarction
Willibald Hochholzer
1, Tobias Reichlin
1,2, Claudia Stelzig
1, Kirsten Hochholzer
1,
Julia Meissner
1, Tobias Breidthardt
1, Miriam Reiter
1, Bettina Duehsler
1,
Heike Freidank
3, Katrin Winkler
4,5, Raphael Twerenbold
1, and Christian Mueller
1*
1
Department of Internal Medicine, University Hospital Basel, Petersgraben 4, 4031 Basel, Switzerland;2
Department of Cardiology, University Hospital Basel, Basel, Switzerland; 3
Department of Laboratory Medicine, University Hospital Basel, Basel, Switzerland;4
Servicio de Pneumologia, Hospital del Mar—IMIM, UPF, CIBERES, ISC III, Barcelona, Spain; and 5
Servicio de Urgencias, Hospital del Mar—IMIM, Barcelona, Spain
Received 21 April 2010; revised 31 August 2010; accepted 13 October 2010; online publish-ahead-of-print 7 December 2010
Aims Angiogenic factors play an important role in the development of atherosclerosis and show pronounced changes
during acute myocardial infarction (AMI). We analysed the impact of placental growth factor (PlGF) and its endogen opponent, soluble fms-like tyrosine kinase-1 (sFlt-1), on clinical outcome and the early diagnosis of AMI.
Methods and results
This multicentre study enrolled patients presenting with symptoms suggestive of AMI. The final diagnosis was adju-dicated by two independent physicians. Levels of sFlt-1 and PlGF were compared with results of a standard troponin T and a novel high-sensitive troponin (hsTnT) assay. Of the 763 patients enrolled, 132 were diagnosed with AMI. Multivariable Cox regression analysis demonstrated sFlt-1 .84 ng/L [hazard ratios (HR) 2.6, 95% confidence intervals (CI) 1.2 – 5.4, P ¼ 0.01] and PlGF .20 ng/L (HR 3.6, 95% CI 1.3 – 10.4, P ¼ 0.02) as predictors for mortality during 1-year follow-up, independent from information provided by troponin T and N-terminal pro-B-type natriuretic peptide (NT-proBNP). However, only sFlt-1 persisted as independent predictor for mortality when analysed together with hsTnT and NT-proBNP, and after adjusting for significant clinical parameters. For the diagnosis of AMI, the combination of troponin T and sFlt-1 improved the performance of troponin T alone and led to a negative predictive value of 98.3% already at time of presentation. However, sFlt-1 and PlGF added only limited diagnostic information when used together with hsTnT.
Conclusion Only sFlt-1 but not PlGF provides overall independent prognostic information in patients presenting with symptoms suggestive of AMI. After the introduction of hsTnT in clinical routine, sFlt-1 and PlGF can only add limited diagnostic information for the detection or exclusion of AMI. Clinical Trial Registration Information: ClinicalTrials.gov, NCT00470587
-Keywords Myocardial infarction † Diagnosis † Prognosis † Angiogenic factors † High-sensitive troponin
Introduction
Symptoms suggestive of an acute myocardial infarction (AMI) are among of the most common reasons why patients are seen at an
emergency department (ED).1Today, cardiac troponin is one of
the major cornerstones for risk stratification and diagnosis of patients in this setting due to its high specificity for myocardial injury, its high clinical sensitivity and also because it provides
important prognostic information.1–3 However, major limitations
of cardiac troponin are its low sensitivity for detection of AMI *Corresponding author. Tel:+41 61 3286549; Fax: +41 61 2655353, Email:chmueller@uhbs.ch
Published on behalf of the European Society of Cardiology. All rights reserved.&The Author 2010. For permissions please email: journals.permissions@oup.com. doi:10.1093/eurheartj/ehq429
within the first hours after onset of symptoms,1,4and its limited coverage of all prognostic aspects as demonstrated by comparison
with other biomarkers.5–7As a consequence, optimal risk
stratifi-cation of a large proportion of patients with suspected AMI at time of presentation is difficult, leading to extensive monitoring until
AMI can be excluded.8,9 Furthermore, 1 – 2% of patients who
have an AMI are misdiagnosed and sent home leading to adverse
outcomes.5Therefore, the need for biomarkers for risk
stratifica-tion and rapid diagnosis in patients with suspected AMI is an ongoing issue.
Recent investigations have given detailed insights into pathophy-siology of atherosclerosis and led to the development of novel
cardiac biomarkers.5,10Angiogenic factors are some promising
can-didates since recent data imply that they are not only important in the development and progression of atherosclerosis, but also seem
to be involved in the pathogenesis of AMI.11–17The vascular
endo-thelial growth factor receptor-1, also called fms-like tyrosine kinase-1 (Flt-1), is expressed on endothelial cells and
macro-phages.17It binds not only vascular endothelial growth factor but
also placental growth factor (PlGF), a platelet-derived protein, of which the biological functions are incompletely understood. Pla-cental growth factor appears to promote the inflammatory process of atherosclerosis, which includes the recruitment of
cir-culating macrophages and atherosclerotic intimal thickening.15,16
In patients with acute coronary syndrome, PlGF is increased regardless of the cardiac troponin concentration, which implies that it is a biomarker of ischaemic events such as plaque instability,
plaque disruption, or impending thrombosis.5,13 A potential
endogenous opponent of PlGF is soluble Flt-1 (sFlt-1), which rep-resents a type of Flt-1 without the transmembrane and intracellular
tyrosine kinase domain.12,17It is thought to be able to capture PlGF
and to reduce thereby the amount available to bind to the
recep-tor located on macrophages and endothelial cells.17An increase of
progenitor cells expressing Flt-1 was described in patients with
AMI,18 suggesting a potential early repair mechanism associated
with angiogenic signalling. As both sFlt-1 and PlGF, have also
demonstrated changing blood levels during ongoing AMI,11,14
they might be useful biomarkers for acute as well as long-term risk stratification.
Therefore, we analysed the prognostic and diagnostic impact of sFlt-1 and PlGF in a large cohort of patients presenting to the ED with symptoms suggestive of AMI as single markers as well as in addition to a contemporary cardiac troponin and a novel high-sensitive troponin (hsTnT) assay.
Methods
Study design and population
The Advantageous Predictors of Acute Coronary Syndrome Evaluation (APACE) trial is an ongoing prospective, observational multicentre study designed and co-ordinated by the University Hospital Basel. Patients presenting to the ED with symptoms suggestive of cardiac ischaemia at rest or minor exertion within the last 12 h were enrolled.
Patients had to be at least 18 years old and have given written informed consent. Patients with a positive troponin test prior to pres-entation, cardiogenic shock, terminal kidney failure requiring dialysis, or anaemia requiring transfusion were excluded. The study was carried
out according to the principles of the Declaration of Helsinki and approved by the local Ethics Committees.
Clinical and laboratory procedures
All patients underwent an initial clinical assessment including clinical history, physical examination, 12-lead electrocardiogram (ECG), con-tinuous ECG-monitoring, pulse oximetry, and standard blood tests including the local cardiac troponin assay. Evaluation and treatment of patients were left to the discretion of the attending physicians and were performed according to standard practice of the hospital and current guidelines.
Blood samples for determination of investigational biomarkers were collected at presentation to the ED into serum tubes and before start of therapy with heparin. Within 1 h, samples were care-fully processed to avoid changes in marker levels (e.g. by cell activation) and frozen at 2808C until assayed in a blinded fashion in two batches in a dedicated core laboratory. Troponin T was deter-mined using a one-step enzyme immunoassay based on electrochemi-luminescence technology (Roche Diagnostics, Germany), with a lower limit of detection of 0.01 mg/L. sFlt-1, PlGF, and hsTnT were measured with precommercial sandwich enzyme electrochemilumi-nescence immunoassays (Roche Diagnostics, Germany). The limit of detection for sFlt-1 was 10 ng/L with a maximum detectable value of 85 000 ng/L. The intra-assay coefficient of variation was 1.6% (63 ng/L) and 0.8% (589 ng/L), and the inter-assay coefficient of variation 4.3% (63 ng/L) and 2.3% (589 ng/L). For PlGF, the limit of detection was 3 pg/mL with a maximum detectable value of 10 000 ng/L. The intra-assay coefficient of variation was 1.1% (107 ng/L) and 1.2% (563 ng/L), and the inter-assay coefficient of variation 2.7% (107 ng/L) and 2.6% (563 ng/L; preliminary results pro-vided by Research and Development of Roche Diagnostics, Germany). High-sensitive troponin T had a limit of detection of 0.002 mg/L, a 99th-percentile cut-off point of 0.014 mg/L, and a coef-ficient of variation of ,10% at 0.013 mg/L.
Adjudicated final diagnosis and follow-up
The final diagnosis was independently adjudicated by two blinded phys-icians as previously described.19,20In brief, the physicians had access to all available medical records and data (including local cardiac troponin values, ECG, echocardiography, cardiac exercise testing, and coronary angiography) but were blinded to the results of investigational bio-markers. Acute myocardial infarction was defined as recommended in current guidelines and described previously.20Unstable angina was
diagnosed when a patient had normal troponin levels and typical angina at rest, a deterioration of previously stable angina, a positive result on a cardiac exercise test or cardiac catheterization showing coronary arteries with stenosis of 70% or more of the vessel diameter, or when the diagnosis was uncertain but follow-up information showed that the patient had an AMI or a sudden, unexpected cardiac death within 60 days after presentation.
To obtain a 12-month follow-up, all patients were contacted by phone after 6 and 12 months. For patients reporting cardiac symptoms, at least one ECG and clinical examination were performed at the out-patient clinic or by the referring physician. All information of sub-sequent hospital admissions or provided by the referring physician or outpatient clinic were adjucated by independent physicians and entered into the computer database.
Statistical analysis
This manuscript represents an exploratory analysis based on the data set of the APACE study. Due to the extreme skewness of markers, we
used cut-offs for 1-year mortality determined by a classification and regression trees (CART) model. To summarise differences in outcome between different biomarkers, we derived hazard ratios (HR) with associated 95% confidence intervals (CI) from the Cox pro-portional hazards model. All variables predictive for mortality in uni-variable analysis (P , 0.05) were included in our multiuni-variable models. We assessed the sensitivity and specificity of different biomarkers for the diagnosis of AMI by receiver operating characteristic (ROC) analysis. Logistic regression analysis was used to combine troponin T with novel markers. Receiver operating characteristic curves were compared using the method described by DeLong. To determine the place value and best cut-off of the novel biomarkers, we performed CART analyses for the diagnosis of AMI (CHAID algorithm, P-value adjustment by Bonferroni method). As a first step, we entered all avail-able biomarkers as continuous variavail-ables in our model. As a second step, we added all available baseline characteristics (Table1).
If not stated otherwise, continuous Gaussian variables are reported as mean + standard deviation and compared by one-way ANOVA. Non-Gaussian variables identified by Komolgorov – Smirnov test were described as median (inter-quartile range) and tested by the Mann – Whitney U test for two groups or the Kruskal – Wallis H test for more than two groups. Discrete variables are reported as counts (percentages), and we tested differences between groups with the
x2test or Fisher exact test when expected cell sizes were ,5. In the two-sided test, a P-value of ,0.05 was regarded as significant. Stat-istical analyses were performed using SPSS version 18.0 (SPSS Inc, Chicago, IL, USA).
Results
From April 2006 to April 2008, we enrolled 794 patients, 8 patients were excluded due to missing blood samples. From the remaining patients, results from troponin T and sFlt-1 testing at presentation were available in 763 patients. Baseline characteristics
of this cohort are presented in Table1. The mean age in our
popu-lation was 63 years, and 93% had at least one and 66% at least two cardiovascular risk factors. Acute myocardial infarction was diag-nosed in 132 (17%) patients; the proportion of ST-elevation AMI was 30%. Unstable angina was the final diagnosis in 119 (16%) indi-viduals. In the remaining 512 patients without AMI or unstable angina, the most common diagnoses were musculoskeletal and pleural pain as well as mental disorders.
Individuals with the diagnosis of AMI were significantly older, dis-played a higher proportion of arterial hypertension, history of a
. . . .
Table 1 Baseline characteristics
Whole cohort (n 5 763) AMI (n 5 132) No AMI (n 5 631) P-value
Age (years) 63 (50 – 75) 72 (59 – 80) 61 (49 – 74) ,0.001
Male sex 501 (66) 93 (71) 408 (65) 0.20
Cardiovascular risk factors
Arterial hypertension 462 (61) 94 (71) 368 (58) 0.006
Hyperlipidaemia 330 (43) 66 (50) 264 (42) 0.09
Diabetes mellitus 123 (16) 27 (21) 86 (15) 0.14
Current smoking 187 (25) 38 (29) 149 (24) 0.21
Body mass index (kg/m2) 26 (24 – 29) 26 (24 – 29) 26 (24 – 29) 0.90 Known coronary artery disease 264 (35) 46 (35) 218 (35) 0.95 Previous myocardial infarction 193 (25) 35 (27) 158 (25) 0.72
Previous revascularization 213 (28) 31 (24) 182 (29) 0.21
Known peripheral artery disease 48 (6) 13 (10) 35 (6) 0.06
Previous stroke 47 (6) 15 (11) 32 (5) 0.006
Impaired renal function (GFRa,60 mL/min) 94 (12) 31 (24) 63 (10) ,0.001 Medication at presentation
Aspirin 292 (38) 53 (40) 239 (38) 0.63
Thienopyridine 79 (10) 8 (6) 71 (11) 0.08
Beta-blocker 299 (39) 50 (38) 249 (40) 0.74
ACE inhibitor and/or ARB 303 (40) 57 (43) 246 (39) 0.37
Nitrate 88 (12) 19 (14) 69 (11) 0.26
Statin 262 (34) 43 (33) 219 (35) 0.64
ECG at presentation
Left bundle branch block 27 (4) 12 (9) 15 (2) ,0.001
ST-segment elevation 54 (7) 38 (29) 16 (3) ,0.001
ST-segment depression 74 (10) 27 (21) 47 (7) ,0.001
T-wave inversion 52 (7) 19 (14) 33 (5) ,0.001
Data are expressed as median (inter-quartile range) or number of patients (percentage) and compared by Mann – Whitney U or x2test. ACE, angiotensin-converting enzyme; ARB, angiotensin II receptor blocker.
a
previous stroke, and impaired renal function, and had more often ischaemic changes on ECG. Levels of biomarkers were significantly
higher in patients with AMI (Table2), and levels of sFlt-1 and PlGF
showed significant differences according to diagnosis (Figure 1).
One-year follow-up was completed in 99.2% of patients. The com-posite endpoint of death or non-fatal AMI was recorded in 73 patients (9.6%; 41 deaths and 41 AMI). While levels of troponin
T and hsTnT showed an excellent correlation (r2¼ 0.99; P ,
0.001), levels of sFlt-1 (r2¼ 0.02; P , 0.001), and PlGF (r2
¼ 0.03; P , 0.001) demonstrated only a weak correlation with troponin T.
Prognostic impact of soluble fms-like
tyrosine kinase-1 and placental growth
factor
Kaplan – Meier analysis according to cut-off of sFlt-1 (85 ng/L) determined by CART analysis demonstrated a low 1-year mortality
in patients with sFlt-1 ≤85 ng/L of 2.5% compared with 11.9% in
patients with a sFlt-1 level above the cut-off (P , 0.001).
Accord-ing to levels of PlGF at presentation (≤20 and .20 ng/L), the
1-year mortality was 1.5 and 7.4% (P , 0.001). Further Kaplan – Meier analyses using strata defined by cut-offs of N-terminal pro-B-type natriuretic peptide (NT-proBNP), troponin T, and hsTnT derived from CART analysis together with sFlt-1 and PlGF showed that both markers extend significantly the prognostic
information of the other markers (Figure 2). Univariable Cox
regression analysis confirmed sFlt-1 .85 ng/L (HR 5.3, 95% CI 2.7 – 10.2, P , 0.001) as well as PlGF (HR 7.6, 95% CI 2.7 – 21.6, P , 0.001) as predictors of mortality. In a multivariable analysis together with NT-proBNP .174 ng/L (HR 14.6, 95% CI 1.9 – 112.0, P ¼ 0.01) and troponin T .0.01 mg/L (HR 1.5, 95% CI 0.7 – 3.0, P ¼ 0.29), both markers demonstrated an independent prognostic value. The corresponding HR for sFlt-1 was 2.6 (95% CI 1.2 – 5.4, P ¼ 0.01) and for PlGF 3.6 (95% CI 1.3 – 10.4, P ¼ 0.02). Repeating the same analysis with hsTnT instead of troponin showed that only sFlt-1 (HR 2.6, 95% CI 1.3 – 5.00, P ¼ 0.006) but not PlGF (HR 2.5, 95% CI 0.9 – 7.1, P ¼ 0.08) persisted as an inde-pendent predictor for mortality. In a multivariable analysis together with all baseline characteristics predictive in univariable analysis for mortality, only sFlt-1 persisted as an independent predictor
(Table 3). Similar findings were obtained for Kaplan – Meier and
Cox analyses for mortality and non-fatal AMI (data not shown).
Diagnostic impact of soluble fms-like
tyrosine kinase-1 and placental growth
factor
Receiver operating characteristic analysis demonstrated that tropo-nin T and hsTnT had with an area under the curve (AUC) of 0.88 (95% CI 0.83 – 0.93) and 0.96 (95% CI 0.95 – 0.98), respectively, the best diagnostic performance regarding the diagnosis of AMI
(Figure3A). The AUC of sFlt-1 and PlGF was 0.70 (95% CI 0.64 –
Figure 1 Levels of soluble fms-like tyrosine kinase-1 and placental growth factor according to final diagnosis. STEMI, ST-elevation myocardial infarction; NSTEMI, non-ST-elevation myocardial infarction; UA, unstable angina; ACS, acute coronary syndrome. Box plots with Tukey whis-kers; horizontal bars indicate median; extremes of boxes show 25 and 75% confidence interval. Comparison between groups by Kruskal – Wallis test.
. . . .
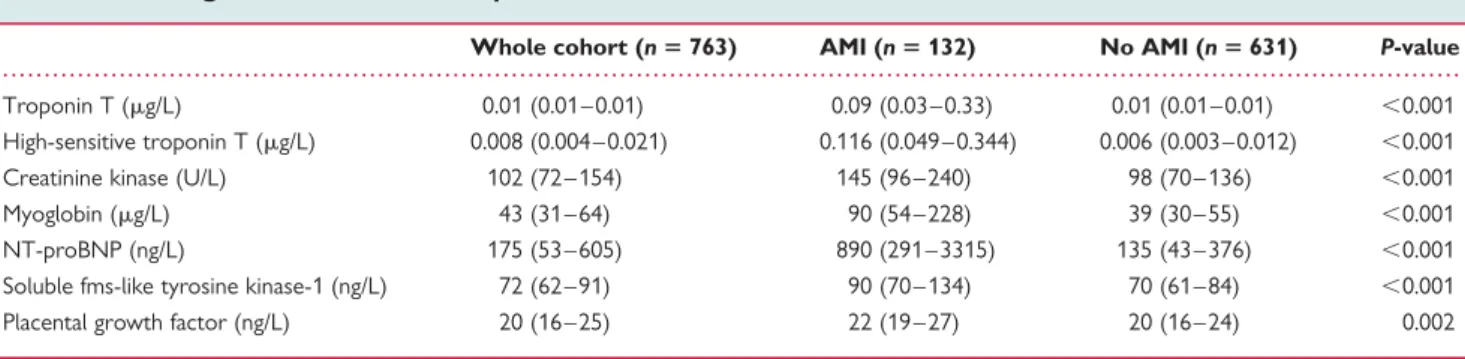
Table 2 Investigational biomarkers at presentation
Whole cohort (n 5 763) AMI (n 5 132) No AMI (n 5 631) P-value Troponin T (mg/L) 0.01 (0.01 – 0.01) 0.09 (0.03 – 0.33) 0.01 (0.01 – 0.01) ,0.001 High-sensitive troponin T (mg/L) 0.008 (0.004 – 0.021) 0.116 (0.049 – 0.344) 0.006 (0.003 – 0.012) ,0.001 Creatinine kinase (U/L) 102 (72 – 154) 145 (96 – 240) 98 (70 – 136) ,0.001 Myoglobin (mg/L) 43 (31 – 64) 90 (54 – 228) 39 (30 – 55) ,0.001 NT-proBNP (ng/L) 175 (53 – 605) 890 (291 – 3315) 135 (43 – 376) ,0.001 Soluble fms-like tyrosine kinase-1 (ng/L) 72 (62 – 91) 90 (70 – 134) 70 (61 – 84) ,0.001 Placental growth factor (ng/L) 20 (16 – 25) 22 (19 – 27) 20 (16 – 24) 0.002
0.76) and 0.60 (95% CI 0.54 – 0.66), respectively. The combination of troponin T and sFlt-1 achieved, with an AUC of 0.93 (95% CI 0.90 – 0.96), a considerably higher diagnostic performance than
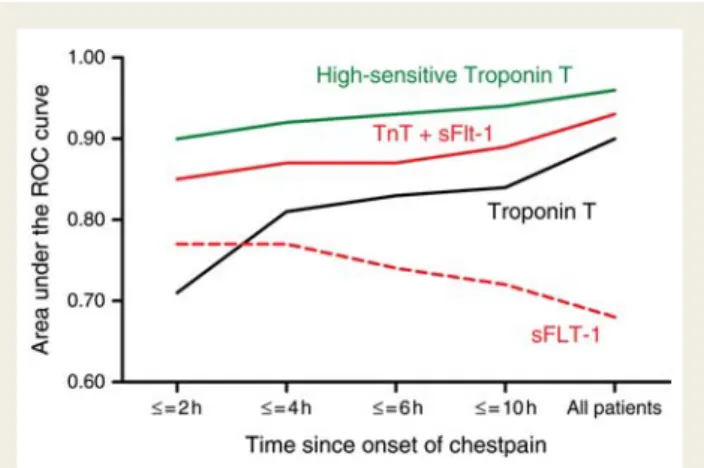
tro-ponin T alone (P ¼ 0.04; Figure 3B). The highest difference
compared with troponin T alone was found in patients presenting within 2 h after onset of symptoms (AUC 0.85 vs. 0.71; P ¼ 0.03) but the dual-marker strategy was also associated with a numerical higher AUC compared with the single-marker strategy
Figure 2 Mortality within 12-month follow-up. In the subgroup of troponin T ≤0.01 mg/L, P-value (by log-rank test) for comparison of soluble fms-like tyrosine kinase-1 strata was 0.03 and for placental growth factor strata 0.01. No significant difference in soluble fms-like tyrosine kinase-1 strata and placental growth factor strata in the subgroups of high-sensitive troponin T and N-terminal pro-B-type natriuretic peptide below cut-off. P-value was in all subgroups of N-terminal pro-B-type natriuretic peptide, troponin T, and high-sensitive troponin T above cut-off ,0.001.
in all strata of time (Figure 4). However, the AUC for hsTnT exceeded always the results of the combination of troponin T and sFlt-1, and also the combination of hsTnT with sFlt-1 did not further improve this result [AUC 0.96 (95% CI 0.95 – 0.98);
Table4].
To better assess the utility for clinical application of these novel biomarkers, we performed CART analyses to determine their place value and best cut-off. As a first step, we entered all available
biomarkers in our model (Figure5A). Troponin T with a cut-off of
0.01 mg/L was the best discriminator between patients with or
without AMI. In patients with troponin T ≤0.01 mg/L sFlt-1
emerged as second-best predictor for AMI. Patients with an
sFlt-1 level above 104 ng/L had an AMI 8.7 times more often com-pared with those below that cut-off. The negative predictive value
of an sFlt-1 level ≤104 ng/L combined with a troponin T level
≤0.01 mg/L for ruling out of AMI with one single blood test at
presentation was 98.3% (Table4). With this approach, AMI could
have been ruled out already at time of presentation in 509 (81%) of the 631 patients without the final diagnosis of AMI. In patients with troponin T .0.01 mg/L, a PlGF level below 22 ng/L increased the proportion of patients diagnosed with AMI to 91% compared with 73% with troponin T .0.01 mg/L alone. After entering all baseline variables into the model, we found a similar
distribution (Figure 5B). However, as second-best discriminator
between patients with or without AMI emerged the presence of ST-segment elevations both in patients with troponin T above and below the cut-off of 0.01 mg/L. Together with an sFlt-1 level ≤104 ng/L and a troponin T level ≤0.01 mg/L, patients without ST-segment elevations had a negative predictive value for AMI of 99%.
The CART analysis with hsTnT showed that sFlt-1 and PlGF can
add some diagnostic information (Figure6A). While hsTnT levels
≤0.011 mg/L excluded an AMI by 99%, levels between .0.011 and 0.031 mg/L that represent the area around the cut-off for diag-nosis of AMI could be more precisely specified with the use of sFlt-1. These findings consisted also in the CART analysis including
all baseline variables (Figure6B).
Since ST-segment elevations turned out to be the second-best discriminator for AMI, we performed a subgroup analysis excluding patients with ST-elevation AMI to test if the diagnostic perform-ance of the novel biomarkers stays the same. The AUC of troponin T was 0.91 (95% CI 0.87 – 0.96) in this subgroup, which was slightly better compared with the overall cohort. All other findings of the
ROC analyses stayed similar (Table 4). Due to the somewhat
higher sensitivity of troponin T in the subgroup without ST-elevation AMI, sFlt-1 was not found to add significant
infor-mation in patient with troponin T ≤0.01 mg/L and hsTnT
≤0.011 mg/L in our CART model (data not shown).
Figure 3 Receiver operating characteristic curves for the diagnosis of acute myocardial infarction. (A) Performance of high-sensitive troponin T, troponin T, sFlt-1, and placental growth factor. (B) Performance of troponin T compared with the combination of markers.
. . . .
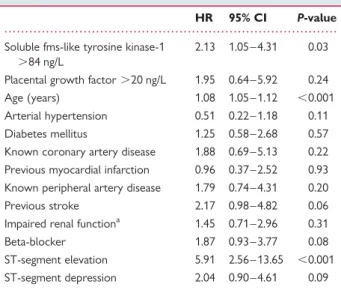
Table 3 Multivariate Cox regression analysis for
mortality during follow-up
HR 95% CI P-value Soluble fms-like tyrosine kinase-1
.84 ng/L
2.13 1.05 – 4.31 0.03 Placental growth factor .20 ng/L 1.95 0.64 – 5.92 0.24 Age (years) 1.08 1.05 – 1.12 ,0.001 Arterial hypertension 0.51 0.22 – 1.18 0.11 Diabetes mellitus 1.25 0.58 – 2.68 0.57 Known coronary artery disease 1.88 0.69 – 5.13 0.22 Previous myocardial infarction 0.96 0.37 – 2.52 0.93 Known peripheral artery disease 1.79 0.74 – 4.31 0.20 Previous stroke 2.17 0.98 – 4.82 0.06 Impaired renal functiona 1.45 0.71 – 2.96 0.31 Beta-blocker 1.87 0.93 – 3.77 0.08 ST-segment elevation 5.91 2.56 – 13.65 ,0.001 ST-segment depression 2.04 0.90 – 4.61 0.09
a
Impaired renal function defined as glomerular filtration rate ,60 mL/min (calculated using the MDRD formula).
Discussion
This study has demonstrated for the first time the prognostic impact of sFlt-1 in patients with suspected AMI. Furthermore, we could present the first evidence for the potential impact of sFlt-1 and
PlGF on decision making in patients with suspected AMI. We present in this manuscript three major findings: first, both markers provide important prognostic information that is independent from that of established blood markers (troponin T and NT-proBNP) in patients presenting with symptoms suggestive for AMI. Soluble fms-like tyrosine kinase-1, but not PlGF, shows independent prognos-tic information also after entering all baseline characterisprognos-tics in our model. Second, sFlt-1 demonstrates a significant improvement of diagnostic accuracy in combination with troponin compared with tro-ponin alone. This leads to a negative predictive value for the diagnosis of AMI of 98% with a single blood sample drawn at presentation in the ED that rises to 99% when used together with ECG results available at this point of time. Third, even when used together with a novel hsTnT assay, sFlt-1 but not PlGF provides independent prognostic information. However, due to the excellent sensitivity of hsTnT, sFlt-1 and PlGF can only add very limited diagnostic information for identification of patients with AMI, and in the subgroup of patients without ST-segment elevation AMI sFlt-1 does not further improve diagnosis of AMI.
It is important to note that, compared with many other trials investigating biomarkers in patients with suspected AMI, blood samples were drawn at the earliest point of time which was already at time of presentation to hospital, and not some time thereafter. This allows not only a direct transfer of our findings
. . . .. . . .. . . .. . . . . . . . . . . . . . . . . . . . . . . . . . . .
Table 4 Diagnostic performance of different assays and combinations at presentation
Sensitivity Specificity Negative predictive value
Positive predictive value Per cent (95% confidence interval)
Entire study population (n 5 763)
sFlt-1, 104 ng/L 42 (33 – 51) 85 (81 – 87) 87 (84 – 90) 36 (30 – 44) PlGF, 22 ng/L 38 (27 – 44) 73 (69 – 77) 81 (84 – 87) 16 (11 – 18) Roche troponin T fourth generation
Troponin T, 0.010 mg/L 83 (75 – 88) 94 (91 – 95) 96 (94 – 98) 73 (65 – 80) + sFlt-1, 104 ng/L 93 (87 – 97) 81 (77 – 84) 98 (97 – 99) 50 (44 – 57) + PlGF, 22 ng/L 89 (83 – 94) 70 (66 – 74) 96 (95 – 98) 38 (33 – 44) Roche high-sensitive troponin T
hs Troponin T, 0.011 mg/L 98 (93 – 99) 72 (68 – 76) 99 (98 – 100) 42 (37 – 48) + sFlt-1, 104 ng/L 98 (94 – 100) 65 (60 – 68) 100 (98 – 100) 36 (31 – 42) + PlGF, 22 ng/L 98 (93 – 99) 58 (54 – 62) 99 (97 – 100) 33 (28 – 38) Study population without patients with ST-elevation myocardial infarction (n 5 724)
sFlt-1, 104 ng/L 40 (30 – 50) 84 (81 – 87) 90 (88 – 93) 27 (20 – 36) PlGF, 22 ng/L 30 (21 – 41) 73 (69 – 76) 88 (84 – 90) 14 (10 – 20) Roche troponin T fourth generation
Troponin T, 0.010 mg/L 86 (77 – 92) 94 (91 – 95) 98 (96 – 99) 66 (57 – 74) + sFlt-1, 104 ng/L 92 (85 – 96) 81 (77 – 84) 99 (97 – 99) 41 (35 – 48) + PlGF, 22 ng/L 91 (83 – 96) 70 (66 – 74) 98 (96 – 99) 31 (26 – 37) Roche high-sensitive troponin T
hs Troponin T, 0.011 mg/L 97 (90 – 99) 72 (68 – 76) 99 (98 – 100) 34 (28 – 40) + sFlt-1, 104 ng/L 98 (91 – 100) 64 (60 – 68) 99 (98 – 100) 29 (24 – 34) + PlGF, 22 ng/L 97 (90 – 99) 58 (54 – 62) 99 (97 – 100) 25 (21 – 30)
Figure 4 Area under the receiver operating characteristic curves for the diagnosis of acute myocardial infarction according to time since onset of chest pain.
to clinical practice but also makes the implementation of our results at an early stage of clinical evaluation possible.
Our findings regarding the prognostic information of PlGF are in line with a substudy from the CAPTURE (c7E3 Fab Anti-Platelet
Therapy in Unstable Refractory Angina) trial, which has demon-strated that PlGF is an independent predictor for adverse outcome (death and non-fatal AMI) in patients with suspected
AMI.13 This study also demonstrated that PlGF can extend the
Figure 5 Classification and regression trees analyses for the diagnosis of acute myocardial infarction (A) Only biomarkers at presentation. (B) Including all variables available at presentation. Proportion of myocardial infarction displayed in black. Size of pie chart denotes the number of patients in this subgroup.
Figure 6 Classification and regression trees analyses for the diagnosis of acute myocardial infarction using a high-sensitive troponin T assay. (A) Only biomarkers at presentation. (B) Including all variables available at presentation. Proportion of myocardial infarction displayed in black. Size of pie chart denotes the number of patients in this subgroup.
prognostic information derived from the traditional markers, namely C-reactive protein and soluble CD40-ligand. However, in our study, only sFlt-1 but not PlGF demonstrated prognostic infor-mation independent from baseline characteristics or hsTnT.
The findings for sFlt-1 and also for PlGF in our study together with the diagnostic impact of sFlt-1 when used together with the contemporary troponin T assay might be explained by the compre-hensive involvement of both biomarkers in the development and progression of atherosclerotic disease. This is unique and unlike most biomarkers which are only involved in single processes such as inflammatory response, platelet activation, or cell necrosis. Furthermore, investigations in other diseases or syndromes such as
sepsis,21 acute lung injury,22 neoplasms,23 and preeclampsia24
demonstrated a wide involvement of angiogenic and associated markers in many conditions with inflammatory processes and/or hypoxaemia. Animal studies provided first evidence that thera-peutic inhibition of angiogenic pathways might be beneficial in
some of these conditions.22,23In human medicine, such therapies
might be beneficial in patients with cardiovascular diseases since
they have elevated levels of such markers.25 Placental growth
factor and sFlt-1 also show a significant increase in blood levels
in patients with AMI undergoing thrombolysis.11,14The results of
our study extend the previous findings as they transfer the knowl-edge achieved from basic and observational research to potential important clinical implications. However, despite the findings of our study, biomarkers should be used for risk stratification and diagnosis only in conjunction with a detailed clinical assessment that can only be made by a skilled clinician taking all available par-ameters into consideration and not by biomarker testing alone.
Several limitations merit consideration. First, levels of new bio-markers were not determined immediately, but after samples were frozen at 2808 for up to 2 years before being analysed in a batch without ever being thawed. It could be hypothesised that immediate measurement of biomarkers might have resulted in an even higher diagnostic accuracy. Second, blood cells contain certain proteins (e.g. PlGF) that might be released during sample preparation and might have biased our biomarker assessment. Third, the used assay detects bound and unbound sFlt-1. Since
vascular endothelial growth factor isoforms26 and PlGF bind to
sFlt-1, a confounding bias affecting the results of sFlt-1 cannot be excluded. Fourth, since this is a prospective observational study, we cannot quantify exactly the clinical benefit associated with the increase in early diagnostic and prognostic accuracy. Interventional studies are warranted to gain this important information.
In summary, sFlt-1 and PlGF can provide important prognos-tic information that is independent from that of troponin T and NT-proBNP, but only for sFlt-1, also independent from hsTnT. Soluble fms-like tyrosine kinase-1 demonstrated a significant improvement of diagnostic accuracy when used together with a contemporary troponin assay, leading to a negative predictive value for the diagnosis of AMI of 98% with a single blood sample drawn at presentation to the ED. However, due to the excellent sensitivity of hsTnT, sFlt-1, and PlGF will only add limited diagnostic information for identification of patients with AMI after the introduction of this novel assay.
Acknowledgements
We thank the emergency department staff for their committed support in the inclusion of study patients as well as the clinical lab-oratory team for excellent technical support.
Funding
This work was supported in part by research grants from the Swiss National Science Foundation (PP00B-102853), the Swiss Heart Foun-dation, Roche, and the Department of Internal Medicine, University Hospital Basel. W.H. was supported by the German Heart Foundation.
Conflict of interest: C.M. reported receiving speaker honoraria from Abbott, Biosite, Brahms, Roche, and Siemens.
References
1. Anderson JL, Adams CD, Antman EM, Bridges CR, Califf RM, Casey DE Jr, Chavey WE 2nd, Fesmire FM, Hochman JS, Levin TN, Lincoff AM, Peterson ED, Theroux P, Wenger NK, Wright RS, Smith SC Jr, Jacobs AK, Halperin JL, Hunt SA, Krumholz HM, Kushner FG, Lytle BW, Nishimura R, Ornato JP, Page RL, Riegel B. ACC/AHA 2007 guidelines for the management of patients with unstable angina/non ST-elevation myocardial infarction. Circulation 2007;116:e148 – e304.
2. Hochholzer W, Buettner HJ, Trenk D, Laule K, Christ M, Neumann FJ, Mueller C. New definition of myocardial infarction: impact on long-term mortality. Am J Med 2008;121:399 – 405.
3. McCann CJ, Glover BM, Menown IB, Moore MJ, McEneny J, Owens CG, Smith B, Sharpe PC, Young IS, Adgey JA. Novel biomarkers in early diagnosis of acute myo-cardial infarction compared with cardiac troponin T. Eur Heart J 2008;29: 2843 – 2850.
4. Macrae AR, Kavsak PA, Lustig V, Bhargava R, Vandersluis R, Palomaki GE, Yerna MJ, Jaffe AS. Assessing the requirement for the 6-hour interval between specimens in the American Heart Association Classification of Myocardial Infarc-tion in Epidemiology and Clinical Research Studies. Clin Chem 2006;52:812 – 818. 5. Apple FS, Wu AH, Mair J, Ravkilde J, Panteghini M, Tate J, Pagani F, Christenson RH, Mockel M, Danne O, Jaffe AS. Future biomarkers for detection of ischemia and risk stratification in acute coronary syndrome. Clin Chem 2005;51: 810 – 824.
6. Morrow DA, Braunwald E. Future of biomarkers in acute coronary syndromes: moving toward a multimarker strategy. Circulation 2003;108:250 – 252. 7. Laufer EM, Mingels AM, Winkens MH, Joosen IA, Schellings MW, Leiner T,
Wildberger JE, Narula J, Van Dieijen-Visser MP, Hofstra L. The extent of coronary atherosclerosis is associated with increasing circulating levels of high sensitive cardiac troponin T. Arterioscler Thromb Vasc Biol 2010;30:1269 – 1275. 8. Pope JH, Aufderheide TP, Ruthazer R, Woolard RH, Feldman JA, Beshansky JR,
Griffith JL, Selker HP. Missed diagnoses of acute cardiac ischemia in the emer-gency department. N Engl J Med 2000;342:1163 – 1170.
9. Selker HP, Beshansky JR, Griffith JL, Aufderheide TP, Ballin DS, Bernard SA, Crespo SG, Feldman JA, Fish SS, Gibler WB, Kiez DA, McNutt RA, Moulton AW, Ornato JP, Podrid PJ, Pope JH, Salem DN, Sayre MR, Woolard RH. Use of the acute cardiac ischemia time-insensitive predictive instru-ment (ACI-TIPI) to assist with triage of patients with chest pain or other symp-toms suggestive of acute cardiac ischemia. A multicenter, controlled clinical trial. Ann Intern Med 1998;129:845 – 855.
10. Libby P, Theroux P. Pathophysiology of coronary artery disease. Circulation 2005; 111:3481 – 3488.
11. Chung NA, Lydakis C, Belgore F, Blann AD, Lip GY. Angiogenesis in myocardial infarction. An acute or chronic process? Eur Heart J 2002;23:1604 – 1608. 12. Ferrara N, Gerber HP, LeCouter J. The biology of VEGF and its receptors. Nat
Med 2003;9:669 – 676.
13. Heeschen C, Dimmeler S, Fichtlscherer S, Hamm CW, Berger J, Simoons ML, Zeiher AM. Prognostic value of placental growth factor in patients with acute chest pain. JAMA 2004;291:435 – 441.
14. Iwama H, Uemura S, Naya N, Imagawa K, Takemoto Y, Asai O, Onoue K, Okayama S, Somekawa S, Kida Y, Takeda Y, Nakatani K, Takaoka M, Kawata H, Horii M, Nakajima T, Doi N, Saito Y. Cardiac expression of placental growth factor predicts the improvement of chronic phase left ventricular function in patients with acute myocardial infarction. J Am Coll Cardiol 2006;47:1559 – 1567. 15. Khurana R, Moons L, Shafi S, Luttun A, Collen D, Martin JF, Carmeliet P,
Zachary IC. Placental growth factor promotes atherosclerotic intimal thickening and macrophage accumulation. Circulation 2005;111:2828 – 2836.
16. Maglione D, Guerriero V, Viglietto G, Delli-Bovi P, Persico MG. Isolation of a human placenta cDNA coding for a protein related to the vascular permeability factor. Proc Natl Acad Sci USA 1991;88:9267 – 9271.
17. Shibuya M. Vascular endothelial growth factor receptor-1 (VEGFR-1/Flt-1): a dual regulator for angiogenesis. Angiogenesis 2006;9:225 – 230; discussion 231. 18. Vo¨o¨ S, Eggermann J, Dunaeva M, Ramakers-van Oosterhoud C, Waltenberger J.
Enhanced functional response of CD133+ circulating progenitor cells in patients early after acute myocardial infarction. Eur Heart J 2008;29:241 – 250. 19. Reichlin T, Hochholzer W, Stelzig C, Laule K, Freidank H, Morgenthaler NG,
Bergmann A, Potocki M, Noveanu M, Breidthardt T, Christ A, Boldanova T, Merki R, Schaub N, Bingisser R, Christ M, Mueller C. Incremental value of copep-tin for rapid rule out of acute myocardial infarction. J Am Coll Cardiol 2009;54: 60 – 68.
20. Reichlin T, Hochholzer W, Bassetti S, Steuer S, Stelzig C, Hartwiger S, Biedert S, Schaub N, Buerge C, Potocki M, Noveanu M, Breidthardt T, Twerenbold R, Winkler K, Bingisser R, Mueller C. Early diagnosis of myocardial infarction with sensitive cardiac troponin assays. N Engl J Med 2009;361:858 – 867.
21. Shapiro NI, Yano K, Okada H, Fischer C, Howell M, Spokes KC, Ngo L, Angus DC, Aird WC. A prospective, observational study of soluble FLT-1 and vascular endothelial growth factor in sepsis. Shock 2008;29:452 – 457.
22. Hamada N, Kuwano K, Yamada M, Hagimoto N, Hiasa K, Egashira K, Nakashima N, Maeyama T, Yoshimi M, Nakanishi Y. Anti-vascular endothelial growth factor gene therapy attenuates lung injury and fibrosis in mice. J Immunol 2005;175:1224 – 1231.
23. Schmidt K, Hoffend J, Altmann A, Strauss LG, Dimitrakopoulou-Strauss A, Engelhardt B, Koczan D, Peter J, Vorwald S, Eskerski H, Eisenhut M, Metz J, Kinscherf R, Haberkorn U. Transfer of the sFLT-1 gene in Morris hepatoma results in decreased growth and perfusion and induction of genes associated with stress response. Clin Cancer Res 2005;11:2132 – 2140.
24. Levine RJ, Maynard SE, Qian C, Lim KH, England LJ, Yu KF, Schisterman EF, Thadhani R, Sachs BP, Epstein FH, Sibai BM, Sukhatme VP, Karumanchi SA. Circu-lating angiogenic factors and the risk of preeclampsia. N Engl J Med 2004;350: 672 – 683.
25. Blann AD, Belgore FM, McCollum CN, Silverman S, Lip PL, Lip GY. Vascular endothelial growth factor and its receptor, Flt-1, in the plasma of patients with coronary or peripheral atherosclerosis, or Type II diabetes. Clin Sci (Lond) 2002; 102:187 – 194.
26. Roeckl W, Hecht D, Sztajer H, Waltenberger J, Yayon A, Weich HA. Differential binding characteristics and cellular inhibition by soluble VEGF receptors 1 and 2. Exp Cell Res 1998;241:161 – 170.