REGULAR ARTICLE
How do elevated [CO
2], warming, and reduced
precipitation interact to affect soil moisture
and LAI in an old field ecosystem?
Orla Dermody&Jake F. Weltzin&
Elizabeth C. Engel&Philip Allen&
Richard J. Norby
Received: 21 May 2007 / Accepted: 2 October 2007 / Published online: 2 November 2007
# Springer Science + Business Media B.V. 2007
Abstract Soil moisture content and leaf area index (LAI) are properties that will be particularly impor-tant in mediating whole system responses to the combined effects of elevated atmospheric [CO2],
warming and altered precipitation. Warming and drying will likely reduce soil moisture, and this effect may be exacerbated when these factors are combined. However, elevated [CO2] may increase
soil moisture contents and when combined with warming and drying may partially compensate for their effects. The response of LAI to elevated [CO2]
and warming will be closely tied to soil moisture status and may mitigate or exacerbate the effects of global change on soil moisture. Using open-top chambers (4-m diameter), the interactive effects of elevated [CO2], warming, and differential irrigation
on soil moisture availability were examined in the OCCAM (Old-Field Community Climate and Atmo-spheric Manipulation) experiment at Oak Ridge National Laboratory in eastern Tennessee. Warming consistently reduced soil moisture contents and this effect was exacerbated by reduced irrigation. How-ever, elevated [CO2] mitigated the effects of warming
and drying on soil moisture. LAI was determined using an AccuPAR ceptometer and both the leaf area duration (LAD) and canopy size were increased by irrigation and elevated [CO2]. Changes in LAI were
closely linked to soil moisture status. The climate of the southeastern United States is predicted to be warmer and drier in the future, and this research suggests that although elevated [CO2] will ameliorate
the effects of warming and drying, losses of soil moisture will cause declines in the LAI of old field ecosystems in the future.
Responsible Editor: Yan Li.
O. Dermody (*)
:
J. F. Weltzin:
E. C. Engel:
P. Allen Department of Ecology and Evolutionary Biology, University of Tennessee,Knoxville, TN 37919, USA e-mail: [email protected] R. J. Norby
Environmental Sciences Division, Oak Ridge National Laboratory, Oak Ridge, TN 37831, USA Present address:
E. C. Engel
Public Lands Institute, University of Nevada, Las Vegas, NV 89154, USA
Present address: O. Dermody
Pioneer Hi-Bred Switzerland S.A., DuPont Agriculture and Nutrition, via Cantonale, Galleria 3, CH-6928 Manno, Switzerland Present address:
J. F. Weltzin
USA National Phenology Network, National Coordinating Office, 1955 East 6th Street, Tucson, AZ 85719, USA
Keywords Climate change . Ecosystems .
Interactions . OCCAM (Old-Field Community Climate and Atmospheric Manipulation)
Introduction
Increased global CO2 concentrations, warming and
reduced water inputs are some of the most important aspects of global change currently affecting ecosys-tems (Hanson et al. 2005; Norby and Luo 2004; Prather et al. 2001). While much progress has been made on understanding how elevated atmospheric [CO2], warming and reduced precipitation alter
ecosystems when applied in isolation, much less is known about how interactions between these factors will affect plants, communities and ultimately eco-system functioning (Dermody 2006; Hanson et al. 2005; Shaw et al.2002). The response of ecosystems to elevated atmospheric [CO2], warming and altered
precipitation will be mediated in part by spatial and temporal variation in soil moisture, but predicting how soil water contents will respond to interacting global change factors is difficult (Dermody 2006; Emmett et al.2004; Norby and Luo2004). Warming reduces soil moisture primarily by increasing evapo-ration, and this will be exacerbated when combined with lower precipitation inputs (Diffenbaugh 2005; English et al. 2005; Norby and Luo 2004). By reducing stomatal conductance and transpiration at the stand level, elevated [CO2] has the opposite effect
(Ainsworth and Rogers 2007; Drake et al. 1997; Hsieh et al.2005; Nowak et al.2004). However, it is not clear whether elevated [CO2] will mitigate some
of the effects of warming and drying (Ainsworth and Rogers 2007; Carter et al. 1997; Tschaplinski et al. 1995) or if the effects of drying and warming on soil moisture content will be stronger than those of elevated [CO2] (Diffenbaugh2005; Fuhrer2003).
The plant canopy is the interface for the physio-logical and physical processes that control energy and water exchange between the atmosphere and terres-trial biosphere. Changes in the size of the canopy are often closely linked to soil moisture content (Murthy et al.2005). For example, limited soil moisture often leads to decreased maximum LAI and earlier senes-cence (Harper et al. 2005; Wand et al. 1999). Although evapotranspiration may be reduced, such declines in LAI may actually exacerbate soil moisture
losses, because of increased heat load and evaporation at the soil surface (Obrist et al. 2003; Wan et al. 2002). In elevated [CO2], lower light compensation
point, delayed senescence and increased number and size of leaves may all contribute to increased LAI (Dermody et al.2006; Ferris et al.2001; Hirose et al. 1996; Pearcy1983). The responses of LAI will in turn affect soil moisture contents e.g. greater LAI in elevated [CO2] may increase the surface for
evapo-transpiration (Phillips et al.2006); alternatively, losses of soil moisture in warm and dry conditions may be slowed if declines in LAI also occur (Wan et al.2002; Zavaleta et al.2003). Knowing how LAI will respond and feedback to alter soil moisture contents when elevated [CO2] and warming are combined with
reduced precipitation, is crucial to model future ecosystem productivity (Cowling and Field 2003; Ewert2004; Filella et al. 2004).
To determine how elevated [CO2], warming and
altered precipitation may interact to affect soil moisture content and LAI of ecosystems in the future, we placed open top chambers (OTCs) and rainout shelters over constructed, replicate old-field communities in eastern Tennessee, USA. The old-field ecosystem was chosen as a model system because of its stature, diversity and growth rate; old-fields, which encompass about 50,000 km2of the continental United States are also a dominant early successional ecosystem that represent a potentially significant pool for carbon storage (Caspersen et al. 2000; Schimel et al. 2001). We expected interactive effects to be important in driving the response of soil moisture and LAI to elevated [CO2], warming and reduced water inputs in this
system. Specifically, we expected that soil moisture content would decline in warm conditions, and that interactions between warming and drying would exacerbate losses of soil moisture, relative to warming alone. Because growth in elevated [CO2] generally
leads to reduced stomatal conductance (Ainsworth and Rogers2007), we expected that soil moisture contents in this system would be greater in elevated [CO2] and
the effects of warming and drying on soil moisture would be partially mitigated when combined with elevated [CO2]. We expected the responses of LAI to
elevated [CO2], warming and altered precipitation to
be tightly linked to those of soil moisture. Specifically, we predicted that high soil moisture contents and elevated [CO2] conditions would lead to the greatest
the canopy (leaf area duration, LAD) and thus the season long capacity for carbon gain to be greatest in well watered and elevated [CO2] conditions.
Materials and methods Site description
Research was conducted at the Old field Community, Climatic and Atmospheric Manipulation (OCCAM) experimental site at Oak Ridge National Laboratory (ORNL), Environmental Research Park in Oak Ridge, Tennessee (35° 54′ N; 84° 21′ W). At this site, precipitation is evenly distributed throughout the year with an annual mean of 1,322 mm; the mean July maximum temperature is 31.2°C and the mean January minimum temperature is −2.7°C. The soil is derived from floodplain alluvium, and is classified as Captina silt loam fine-silty, siliceous, mesic typic fragiudult, well drained, and is slightly acidic (Norby et al.1997). Experimental design and setup
Construction of plots was initiated in early summer 2002, when existing vegetation within each plot was killed with an application of glyphosate herbicide (Roundup (R) herbicide, Monsanto Company, Marys-ville, OH, 43041, mixed with water to manufacturer’s specifications). To create a split-plot for the water treatment, each plot was trenched to a depth of 75 cm around its perimeter and along its diameter in a north– south direction. To minimize lateral flow of sub-surface water and heat into and out of the plot, trenches were lined with 4-mil polyvinyl chloride (PVC) film, insulat-ing foam panels, and were backfilled with packed soil. Field soil within each trenched plot was otherwise left intact to maintain soil structure. Plots were planted with seven plant species common to old-field communities in the southeastern United States: Andropogon virginicus L., a C4 grass, the C3 grasses Dactylis glomerata L.
and Festuca pretense L., the nitrogen-fixing legumes Lespedeza cuneata (Dum. Cours.) G. Don and Trifo-lium pratense L., and the herbaceous dicots Plantago lanceolata L., a weak biennial at this site, and the perennial Solidago canadensis L. The initial planting density was approximately 31 plants/m2.
Open-top chambers were constructed of aluminum frames (4 m diameter, 2.2 m height) covered with
clear PVC panels; the double-walled panel on the lower half of each OTC was perforated on the inner wall with 2.5 cm holes, through which air of the appropriate temperature and [CO2] flowed (Norby
et al. 1997). Chambers were equipped with evapora-tive coolers coupled to in-line heating coils to main-tain desired temperatures. Temperature and [CO2]
control was achieved through a modification of methods described in Norby et al. (1997). The chamber material reduced PAR by approximately 30% (C. Campany pers. comm.). Rainout shelters over each OTC measured 6 m×5 m and were constructed of 6-mil PVC film stretched over 9 cm width, pressed steel greenhouse bows affixed to a steel frame, the shelters ranged in height from 2.2 m at their lowest point to approximately 3.3 m at their peak.
Warming and [CO2] treatments were initiated in
April 2003 and maintained 24 h d−1 throughout the year. Whole-plots received ambient and elevated [CO2] (ambient + 300 ppm), and ambient and
elevated temperatures (ambient + 3°C). Each whole-plot was split along its diameter into two 6.3 m2experimental units; each experimental unit, or plot, was assigned to one of two soil moisture treatments (‘wet,’ ‘dry’) created by differential irrigation. Each 6.3 m2 plot represented a unique soil moisture, [CO2], and warming treatment within
one of three blocks that were located to account for potential variations in environmental conditions across the field site (n = 3).
Mean air temperatures between 1st May 2004 and 30th September 2004 and for the same period in 2005, were 21.7±0.2 and 21.3±0.2°C in ambient temperature chambers and 24.5±0.2 and 23.5±0.2°C in warmed chambers. The difference between cham-ber air temperature and outside air temperature averaged 0.55±0.23 and 3.20±0.21°C in ambient and warmed chambers, respectively. The hourly-averaged temperature differentials were within 0.5°C of the mean, 74% of the time in ambient temperature chambers and 89% of the time in warmed chambers. The concentration of CO2within the chambers during
daylight hours averaged 396 ±3 ppm in ambient [CO2] chambers and 696 ±10.0 ppm in elevated
[CO2] chambers. The standard deviations represent
the variation across the six chambers within a [CO2]
treatment; the standard deviations of the hourly observations over 2 years were 29 and 72 ppm in ambient and elevated [CO2] chambers, respectively.
Irrigation treatments were initiated in June 2003 and were based on long-term mean weekly precipita-tion records from the Oak Ridge weather staprecipita-tion, modified by ±50% to create‘wet’ and ‘dry’ irrigation treatments. During the 2003 growing season, VWC at all soil depths differed little between wet and dry treatments; therefore, in September 2003, we modi-fied our irrigation protocol to include weekly addi-tions of 2 mm (dry) and 25 mm (wet) rainwater. Irrigation was performed with rainwater collected at the site in 10,000 liter tanks and applied to all plots using metered hoses and handheld sprinklers.
Measurement of soil moisture content
We used time domain reflectometry (TDR) to monitor soil volumetric water content (VWC) at six locations within each plot. Two probes with 15 cm long tines were installed vertically at the soil surface; these represent the integrated value of VWC from 0 to 15 cm. Two probes were also installed horizontally, each at depths of 30 and 55 cm along the outer perimeter of each plot. Soil VWC was recorded weekly during the growing season (i.e., March– October), and twice a month during the non-growing
Table 1 The effect of elevated [CO2], warming and watering on soil moisture content expressed as soil volumetric water content
(VWC) of an old-field mixed species community in the 2004 and 2005 water years (October–September)
Year Effect 0–15 cm 30 cm 55 cm
F-stat P F-stat P F-stat P
2004 [CO2] 2.29 0.18 2.95 0.14 0.58 0.47 warming 17.70 0.01 57.54 ≤0.0003 8.00 0.03 water 360.19 ≤0.0001 49.41 ≤0.0001 7.16 0.01 date 112.39 ≤0.0001 136.55 ≤0.0001 104.90 ≤0.0001 [CO2] × warming 0.15 0.71 0.23 0.65 0.36 0.57 [CO2] × water 1.44 0.23 0.17 0.68 3.31 0.07 warming × water 3.09 0.08 21.88 ≤0.0001 1.15 0.28
[CO2] × warming × water 5.01 0.03 4.10 0.04 1.48 0.22
[CO2] × date 1.70 0.07 0.24 0.99 0.85 0.59
warming × date 1.14 0.33 4.49 ≤0.0001 5.17 ≤0.0001
[CO2] × warming × date 0.28 0.99 0.56 0.86 0.46 0.93
water × date 3.54 ≤0.0001 5.04 ≤0.0001 1.68 0.07
[CO2] × water × date 0.16 1.00 0.12 1.00 0.18 1.00
warming × water × date 0.79 0.65 1.07 0.39 0.58 0.84
[CO2] × warming × water × date 0.46 0.93 0.09 1.00 0.08 1.00
2005 [CO2] 4.34 0.08 5.04 0.07 5.98 0.05 warming 15.59 0.01 40.93 ≤0.0007 17.71 0.01 water 172.40 ≤0.0001 28.25 ≤0.0001 4.36 0.04 date 140.22 ≤0.0001 210.85 ≤0.0001 152.97 ≤0.0001 [CO2] × warming 0.02 0.88 0.62 0.46 0.03 0.87 [CO2] × water 1.39 0.24 0.00 0.96 1.43 0.23 warming × water 1.41 0.24 42.62 ≤0.0001 6.01 0.01
[CO2] × warming × water 0.06 0.81 1.49 0.22 0.00 0.98
[CO2] × date 0.86 0.59 1.16 0.31 1.29 0.22
warming × date 1.51 0.12 2.36 0.01 3.71 ≤0.0001
[CO2] × warming × date 1.80 0.05 0.63 0.82 0.71 0.74
water × date 3.44 ≤0.0001 4.81 ≤0.0001 3.22 ≤0.0001
[CO2] × water × date 0.15 1.00 0.36 0.98 0.81 0.64
warming × water × date 1.17 0.30 1.30 0.21 1.41 0.16
[CO2] × warming × water × date 0.44 0.95 0.31 0.99 0.20 1.00
Each effect in the mixed model is shown with the corresponding F-statistic and P-value calculated from the repeated measures ANOVA (n=3). P≤0.1 are in bold text.
season (i.e., November–February). VWC data were averaged to obtain monthly mean soil VWC at each depth in each experimental plot. To obtain an estimate of the duration and amount of soil moisture from 0 to 15 cm, the area under the VWC plots was integrated to obtain VWCD (VWC duration), this is analogous to the leaf area duration (LAD).
Soil water recharge was defined as the increase in plot VWC between October and December, and drawdown was defined as the decrease in soil VWC between March and May. The rate of each of these processes was calculated as the slope of the decline between March and May (drawdown) or increase between October and December (recharge) in soil VWC.
Oct Feb Jun Oct Feb Jun Oct
10 20 30 40 ACAT ECAT ACET ECET
Oct Feb Jun Oct Feb Jun Oct
10 20 30 40 VWC (%) 10 20 30 40 30 cm 0 - 15 cm 55 cm Dry Wet 2004 2005 2004 2005
Fig. 1 The effect of elevated [CO2], warming and watering on
soil moisture content expressed as volumetric water content (VWC) of an old field mixed species community The three panels on the left side represent the dry plots and the three on the right represent the wet plots. The panels are arranged according to soil depth, with the top row corresponding to 0–
15 cm and the second and third rows to 30 and 55 cm below the surface, respectively. Measurements span the 2004 and 2005 water years (October–September). Each point represents the least squared mean, the corresponding standard error calculated from the repeated measures ANOVA is represented by a bar in the upper right hand corner of the top two panels
Measurement of leaf area index
LAI was measured monthly (in October 2003, between March and October 2004, and between March and November 2005) using an AccuPAR line-integrating ceptometer (Decagon Devices Ltd, USA). The AccuPAR calculates LAI from measure-ments of intercepted photosynthetically active
radia-tion. All measurements were performed within one hour of solar noon. In 2003 and 2004, we sub-sampled LAI at six locations within each plot on each sample date; in 2005, we reduced the number of sub-samples to four per plot. Leaf area duration (LAD) is a parameter that integrates both the duration and the size of the canopy; LAD was calculated for each experimental plot and for each year (2004,
EC - AC -6 -4 -2 0 2 4 EC - AC -6 -4 -2 0 2 4
Ambient air vs warming
EC - AC -6 -4 -2 0 2 4 AT - Dry ET - Dry AT - Wet ET - Wet ET - AT -6 -4 -2 0 2 4 55 cm Ambient vs elevated CO2 ET - AT -6 -4 -2 0 2 4 AC - Dry EC - Dry AC - Wet EC - Wet 0-15 cm ET - AT -6 -4 -2 0 2 4 30 cm
Fig. 2 The effect of elevated [CO2], warming and watering on
soil moisture content. The panels on the left represent the difference in soil VWC between ambient [CO2] and elevated
[CO2] (EC-AC) and the difference between ambient and
warmed conditions are represented (ET-AT) in the panels on
the right. The panels are arranged according to soil depth, with the top row corresponding to 0–15 cm and the second and third rows to 30 and 55 cm below the surface, respectively. Measurements span the 2004 and 2005 water years (October– September)
2005), as the area under the LAI curve, using the trapezoidal rule (SigmaPlot Version 10, Systat Soft-ware Inc., Point Richmond, CA, USA).
Statistical analysis
Repeated measures analysis of variance (PROC MIXED; SAS, The SAS Institute; Version 8.1, Cary, NC.) was used to test for treatment effects on soil moisture content and LAI. The effects of elevated [CO2], warming and water on LAD were analyzed in
a mixed model ANOVA. All analyses were conducted on the plot means. The levels of [CO2], warming and
water treatment were fixed effects, and blocks and the interaction between blocks, [CO2] and warming were
included as random effects. A block was defined as one full replicate of a unique water, [CO2], and
warming treatment (n=3). Post hoc linear contrasts were performed to elucidate treatment effects within interaction terms. Analyses were separated according to water year (October–September). To determine whether elevated [CO2], warming and reduced
pre-cipitation affected the rate of soil moisture drawdown and recharge, the slopes of the decline in soil moisture content between March and May (drawdown) or the increase in soil moisture content between October and December (recharge) were compared. To determine if
LAI was dependent on VWC across the year, linear correlations between LAD and VWCD were per-formed in SigmaPlot. Least squared means are presented in all figures and tables and the associated variances are the standard errors from mixed model ANOVAs. Differences between treatments were con-sidered significant at p≤0.1.
Results
Soil moisture content
Interactions between the effects of elevated [CO2],
reduced precipitation and atmospheric warming were important in determining soil moisture contents in 2004 and 2005, although the magnitude diminished with depth, and varied with time, (Table 1, Fig.1). The effects of warming and drying both alone and in combination led to consistently low soil moisture, whereas the greatest soil moisture contents were measured in elevated [CO2], wet and unwarmed
plots (Table1, Figs.1and2). There was a consistent trend towards greater soil moisture content in elevated [CO2] plots relative to those in ambient air
(Fig. 1), although this was not statistically signifi-cant. In 2004, elevated [CO2] significantly reduced Table 2 The effect of elevated [CO2], warming and watering on canopy size expressed as leaf area index (LAI) of an old field mixed
species community Effect 2004 2005 F-stat P F-stat P [CO2] 12.82 0.01 0.01 0.91 warming 1.11 0.33 0.01 0.92 water 79.02 ≤0.0001 59.33 ≤0.0001 date 92.55 ≤0.0001 250.46 ≤0.0001 [CO2] × warming 5.11 0.06 1.31 0.29 [CO2] × water 5.00 0.03 0.06 0.79 warming × water 0.68 0.41 10.01 0.0016
[CO2] × warming × water 1.01 0.32 0.54 0.46
[CO2] × date 1.25 0.28 5.35 ≤0.0001
warming × date 5.82 ≤0.0001 1.55 0.17
[CO2] × warming × date 2.12 0.05 1.16 0.32
water × date 3.96 ≤0.0001 1.73 0.12
[CO2] × water × date 0.85 0.53 0.47 0.79
warming × water × date 0.47 0.83 4.8 ≤0.0003
[CO2] × warming × water × date 1.05 0.39 1.38 0.22
Each effect in the mixed model is shown with the corresponding F-statistic and P-value (n=3) calculated from the repeated measures ANOVA. Effects significant at the P≤0.1 level are bolded
the effects of warming and drying on soil moisture content (Table 1, Fig. 1). However, when averaged across the year, the effects of warming on soil moisture were generally stronger than those of elevated [CO2] (Figs.1and2).
Soil moisture drawdown and recharge
Although elevated [CO2], warming and water were
important in driving the rate of soil moisture drawdown and recharge in the Spring and Fall, no interactions between the treatments were detected (Fig. 1; e.g. in 2003, 0–15 cm, Oct–Dec. [CO2] ×
warming × water, F-stat=1.33, P≤0.26, n=3). Ele-vated [CO2] reduced the rate of soil moisture
drawdown (e.g. 2005, 0–15 cm, F-stat=10.9, P≤ 0.01, n=3), whereas warming (e.g., 2005, 0–15 cm, F-stat=8.4, P≤0.01, n=3) and drying (e.g. 2005, F-stat=13.8, P≤0.001, n=3) had the opposite effect.
Although elevated CO2played a part in increasing
VWC, these effects did not alter the rates of soil
moisture recharge in the fall (e.g. 2004, 0–15 cm, F-stat=1.3, P≤0.35, n=3). Warming also had no effect on the rate of soil moisture recharge between 0 and 15 cm (e.g. 2004, 0–15 cm, F-stat=2.5, P≤0.17, n=3). However, drying increased the rate of recharge in both years (e.g. 2004, 0–15 cm, F-stat=22.2, P≤ 0.001, n=3).
Leaf area index
Interactions between water and [CO2] in 2004, and
water and warming in 2005, were important in driving variation in LAI (Table 2, Fig. 3). Watering consis-tently increased LAI and the greatest LAI values were measured in wet and elevated [CO2] plots, whereas
the lowest LAI was measured in the dry and warm plots (Fig.3). Not unexpectedly, the strength of these interactions varied with time, and the responses of LAI to water, warming and elevated [CO2] varied
both across the growing season and between 2004 and 2005 (Fig. 3, Table2).
Oct Apr Oct Apr Oct
Oct Apr Oct Apr Oct
0 2 4 6 8 0 2 4 6 8 AC EC LAI 2004 2005 Dry Wet 2005 2004 Warm Cool
Fig. 3 Leaf area index (LAI) for an old field mixed species community. Dry plots are on the left hand side and wet plots are on the right hand side. The top row corresponds to the plots at ambient temperatures while the warmed plots are in the bottom panels. Measure-ments span the 2004 and 2005 water years (October– September). Each point represents the least squared mean ± standard error (n=3) calculated from the repeated measures ANOVA
Leaf area duration and VWC duration
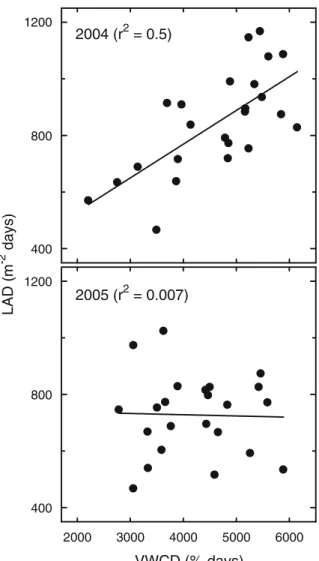
There was a strong relationship between LAD and VWCD in 2004 (Fig. 4). However, this response was not detected in 2005. Elevated [CO2] tended to increase
LAD [CO2] (ambient [CO2]: 743±21 m−2days; elevated
[CO2]: 823±21 m−2days, F-stat=−3.4, P≤0.009, n=3)
and drying reduced it (wet: 865±21 m−2 days; dry: 700±21 m−2days, F-stat=−5.2, P≤0.001, n=3). There was a trend towards greater VWCD in elevated [CO2]
however, this effect was not significant (ambient [CO2]:
5,072±303 days; elevated [CO2]: 5,440±303% days,
F-stat=2.1, P≤0.15, n=3). Warming reduced VWCD (warmed: 4,455±273% days; ambient temperature: 5,559±273% days, F-stat=15, P≤0.004, n=3) and drying had a similar effect (wet: 5,443±253% days; dry: 4,571±253% days, F-stat=21, P≤0.001, n=3).
Interactions between the treatments were important in determining the LAD and the difference in LAD between ambient and elevated [CO2] was greater in
warmed plots than in ambient temperature plots (LAD, ambient air and warm, 676±21 m−2 days, elevated CO2 and warm, 845±21 m−2 days, F-stat=−4, P≤
0.0001, n=3). Interactions between the treatments were not important in determining the VWCD.
Discussion
The interactive effects of elevated [CO2], warming
and reduced irrigation on soil moisture and LAI were complex, however, some consistent patterns emerged. Warming and drying reduced soil moisture, and interactions between these factors exacerbated their individual effects. However, declines in soil moisture in warm and dry conditions were mitigated by elevated [CO2]. While other factors were likely
important, the response of LAI to warming and elevated [CO2] closely corresponded to changes in
soil moisture content. Community level LAI was consistently low in warm and dry plots, however, in 2004, elevated [CO2] more than compensated for the
effects of warming and drying when these factors were combined. Although the effect varied between years, elevated [CO2] and irrigation increased both
LAI and LAD. The strongest effects of elevated [CO2]
and warming on soil moisture occurred during the growing season, suggesting that physiological (tran-spiration) processes played a large role in driving ecosystem response to elevated [CO2] and warming.
In 2004, when warming and drying were combined with elevated [CO2] their effects on soil moisture
were reduced. Stomatal conductance was measured on all species in 2004, and it was consistently lower on plants grown in elevated [CO2] relative to ambient
air (L.A. Souza, pers. comm.), this likely helped to mitigate the effects of warming and drying on soil moisture. While lower stomatal conductance is a common plant response to elevated [CO2] (Ainsworth
and Rogers 2007; Drake et al. 1997; Wand et al. 2004 (r2 = 0.5) VWCD (% days) LAD (m -2 days) 400 800 1200 2005 (r2 = 0.007) 2000 3000 4000 5000 6000 400 800 1200
Fig. 4 Leaf area duration (LAD) versus volumetric water content duration (VWCD) for an old field mixed species community. Dry plots are on the left hand side and wet plots are on the right hand side. Measurements span the 2004 and 2005 water years (October– September). The points are not separated by treatment and each point represents the LAD and VWCD for a single experimental unit
1999), subsequent increases in soil moisture content under elevated [CO2] are rarer (Richter and Semenov
2005; Savabi and Stockle 2001). Previous research has shown that interactions between atmospheric warming and reduced irrigation are especially detri-mental to soil water contents (Emmett et al. 2004; Filella et al. 2004; Richter and Semenov 2005); however, we extend these results by highlighting that expected reductions in transpiration will not compen-sate for soil moisture loss when warming and drying are combined with elevated [CO2].
It is likely that elevated [CO2] warming and drying
impacted soil moisture drawdown and recharge pri-marily through their effects on evapotranspiration. Lower stomatal conductance in plants grown in elevated [CO2] (L.A. Souza, pers. comm.), may have
caused slower drawdown of soil moisture in the spring. Warming and drying had the opposite effect and not unexpectedly these factors increased the rate of soil moisture drawdown (Emmett et al.2004; Mohseni and Stefan2001; Seneviratne et al.2002). Measurements of canopy green-up, estimated using normalized differ-ence vegetation index (NDVI) did not reveal any effects of elevated [CO2], warming or drying on early
season community phenology (E.C. Engel, unpub-lished data) which also supports a critical role for evapotranspiration in driving changes in soil moisture. Although not evident in 2005, elevated [CO2]
increased LAI, and fully mitigated the effects of warming and drying on canopy size in 2004. The inconsistent response of LAI to elevated [CO2] may
have been due in part to inter-annual variation in ambient temperatures. By suppressing photorespira-tion, elevated [CO2] lowers the light compensation
point (LCP) of photosynthesis, allowing leaves to maintain a positive carbon balance in deeper shade and thereby increasing LAI (Long and Drake 1991). The rate of photorespiration increases with tempera-ture, and because air temperatures were higher in March to June 2004 than 2005, the positive effects of elevated [CO2] on leaf level photosynthesis may
have been more pronounced. In an agroecosystem, Dermody et al. (2006) found that increased maximum LAI in elevated [CO2] was caused by a combination
of greater leaf retention deep in the canopy and increased leaf size. Such mechanisms may also have been important here, but in more complex systems like old-fields, inter annual variation in species abundance and overall resource availability often
prevent consistent increases in LAI under elevated [CO2] (Hirose et al.1996; Kammann et al.2005).
In the future, global change may render ecosystems more sensitive to the effects of invasive species (Chornesky et al.2005; Smith et al.2000), and many invasive plant species already present in old-fields have the potential to dramatically alter biogeochemical cycling across large land areas (Ehrenfeld 2003; Strayer et al.2006). The establishment and persistence of invasive plants in old-fields may be facilitated by features such as deep woody taproots, which confer a significant degree of drought tolerance (Blair and Fleer 2002). Here, we show how the interactive effects of atmospheric warming and lower precipitation led to decreased soil moisture content within 15 cm of the surface, even in association with elevated [CO2].
However, deeper in the soil, the effects of warming and drying on soil moisture content were less. When surface moisture is depleted, deep-rooted exotic plants may have a significant competitive advantage over shallow rooted native grasses and forbs (Blair and Fleer 2002; DiTomaso et al. 2003) and such an advantage may facilitate their persistence in the warmer and drier conditions predicted for the future.
Ecosystems across the globe are already being exposed to altered atmospheric composition, reduced precipitation and temperature. This research shows that the effects of warming and drying on soil moisture content are magnified when they are applied simultaneously. Additionally, soil moisture losses in warmer and drier conditions were not completely compensated for by growth in elevated [CO2]. The
effects of global change on LAI will be determined by many interacting factors however, changes in soil moisture content will be particularly important and the corresponding effects on LAI may have signifi-cant impacts on material and energy exchange between the land surface and atmosphere (Cowling 1999; Gamon et al. 1995). By linking the results of empirical studies like this one into more theoretical experiments, it may be possible to predict how local changes may scale across landscape scales to dramat-ically alter energy exchange and biogeochemical cycling (Rowell and Jones2006; Zeng et al.2005).
Acknowledgements The authors wish to thank Onike Mnvaza, Elizabeth Ferguson and Zachary Kirschenmann for valuable help with data collection. We would also like to thank Aimee Classen, Colleen Iversen, Hector Castro and David Westin for comments on an earlier draft of this manuscript. The
research was sponsored by US Department of Energy’s Office of Science, Biological and Environmental Research Program through Grant No. DE-FG02-02ER63366 to the University of Tennessee and conducted at Oak Ridge National Laboratory, which is managed by UT Battelle, LLC, for the US Department of Energy under Contract DE-AC05-00OR22725.
References
Ainsworth EA, Rogers A (2007) The response of photosynthesis and stomatal conductance to rising [CO2]: mechanisms
and environmental interactions. Plant Cell Environ 30: 258–270
Blair E, Fleer Z (2002) Early growth stages of Lespedeza cuneata are a factor in its ability to colonize in tallgrass prairies. Tillers 3:11–14
Carter EB, Theodorou MK, Morris P (1997) Responses of Lotus corniculatus to environmental change, effects of elevated CO2, temperature and drought on growth and
plant development. New Phytol 136:245–253
Caspersen JP, Pacala SW, Jenkins JC, Hurtt GC, Moorcroft PR, Birdsey RA (2000) Contributions of land-use history to carbon accumulation in US forests. Science 290:1148– 1151
Chornesky EA, Bartuska AM, Aplet GH, Britton KO, Cummings-Carlson J, Davis FW, Eskow J, Gordon DR, Gottschalk KW, Haack RA, Hansen AJ, Mack RN, Rahel FJ, Shannon MA, Wainger LA, Wigley TB (2005) Science priorities for reducing the threat of invasive species to sustainable forestry. Bioscience 55:335–348
Cowling SA (1999) Simulated effects of low atmospheric CO2
on structure and composition of North American vegeta-tion at the Last Glacial Maximum. Global Ecol Biogeogr 8:81–93
Cowling SA, Field CB (2003) Environmental control of leaf area production: implications for vegetation and land-surface modeling. Glob Biogeochem Cycles 17:1–14 Dermody O (2006) Mucking through multifactor experiments;
design and analysis of multifactor studies in global change research. New Phytol 172:598–600
Dermody O, Long SP, DeLucia EH (2006) How does elevated CO2or ozone affect the leaf-area index of soybean when
applied independently? New Phytol 169:145–155 Diffenbaugh NS (2005) Atmosphere-land cover feedbacks alter
the response of surface temperature to CO2forcing in the
western United States. Clim Dyn 24:237–251
DiTomaso JM, Kyser GB, Pirosko CB (2003) Effect of light and density on yellow starthistle (Centaurea solstitialis) root growth and soil moisture use. Weed Sci 51:334–341 Drake BG, Gonzalez Meler MA, Long SP (1997) More
efficient plants: a consequence of rising atmospheric CO2. Annu Rev Plant Physiol 48:609–639
Ehrenfeld J (2003) Effects of exotic plant invasions on soil nutrient cycling processes. Ecosystems 6:503–523 Emmett BA, Beier C, Estiarte M, Tietema A, Kristensen HL,
Williams D, Penuelas J, Schmidt I, Sowerby A (2004) The response of soil processes to climate change: results from manipulation studies of shrublands across an environmen-tal gradient. Ecosystems 7:625–637
English NB, Weltzin JF, Fravolini A, Thomas L, Williams DG (2005) The influence of soil texture and vegetation on soil moisture under rainout shelters in a semi-desert grassland. J Arid Environ 63:324–343
Ewert F (2004) Modelling plant responses to elevated CO2:
how important is leaf area index? Ann Bot 93:619–627 Ferris R, Sabatti M, Miglietta F, Mills RF, Taylor G (2001) Leaf
area is stimulated in Populus by free air CO2enrichment
(POPFACE), through increased cell expansion and pro-duction. Plant Cell Environ 24:305–315
Filella I, Penuelas J, Llorens L, Estiarte M (2004) Reflectance assessment of seasonal and annual changes in biomass and CO2 uptake of a Mediterranean shrubland submitted to
experimental warming and drought. Remote Sens Environ 90:308–318
Fuhrer J (2003) Agroecosystem responses to combinations of elevated CO2, ozone and global climate change. Agric
Ecosyst Environ 97:1–20
Gamon JA, Field CB, Goulden ML, Griffin KL, Hartley AE, Joel G, Penuelas J, Valentini R (1995) Relationships between NDVI, canopy structure, and photosynthesis in three Californian vegetation types. Ecol Appl 5:28–41 Hanson PJ, Wullschleger SD, Norby RJ, Tschaplinski TJ,
Gunderson CA (2005) Importance of changing CO2,
temperature, precipitation, and ozone on carbon and water cycles of an upland-oak forest: incorporating experimental results into model simulations. Global Change Biol 11:1402–1423
Harper CW, Blair JM, Fay PA, Knapp AK, Carlisle JD (2005) Increased rainfall variability and reduced rainfall amount decreases soil CO2flux in a grassland ecosystem. Global
Change Biol 11:322–334
Hirose T, Ackerly DD, Traw MB, Bazzaz FA (1996) Effects of CO2elevation on canopy development in the stands of two
co-occurring annuals. Oecologia 108:215–223
Hsieh CI, Kiely G, Birkby A, Katul G (2005) Photosynthetic responses of a humid grassland ecosystem to future climate perturbations. Adv Water Resour 28:910–916 Kammann C, Grunhage L, Gruters U, Janze S, Jager HJ (2005)
Response of aboveground grassland biomass and soil moisture to moderate long-term CO2 enrichment. Basic
Appl Ecol 6:351–365
Long SP, Drake BG (1991) Effect of the long-term elevation of CO2 concentration in the field on the quantum yield of
photosynthesis of the C3 sedge, Scirpus olneyi. Plant
Physiol 96:221–226
Mohseni O, Stefan HG (2001) Water budgets of two water-sheds in different climatic zones under projected climate warming. Clim Change 4:77–104
Murthy R, Barron-Gafford G, Dougherty PM, Engel VC, Grieve K, Handley L, Klimas C, Potosnak MJ, Zarnoch SJ, Zhang JW (2005) Increased leaf area dominates carbon flux response to elevated CO2 in stands of Populus
deltoides (Bartr.). Global Change Biol 11:716–731 Norby RJ, Luo YQ (2004) Evaluating ecosystem responses to
rising atmospheric CO2and global warming in a
multi-factor world. New Phytol 162:281–293
Norby RJ, Edwards NT, Riggs JS, Abner CH, Wullschleger SD, Gunderson CA (1997) Temperature-controlled open-top chambers for global change research. Global Change Biol 3:259–267
Nowak RS, Ellsworth DS, Smith SD (2004) Functional responses of plants to elevated atmospheric CO2– do photosynthetic
and productivity data from FACE experiments support early predictions? New Phytol 162:253–280
Obrist D, Verburg PSJ, Young MH, Coleman JS, Schorran DE, Arnone JA (2003) Quantifying the effects of phenology on ecosystem evapotranspiration in planted grassland meso-cosms using EcoCELL technology. Agric For Meteorol 118:173–183
Pearcy RW (1983) The light environment and growth of C3and
C4 tree species in the understory of a Hawaiian forest.
Oecologia 58:19–25
Phillips DL, Johnson MG, Tingey DT, Catricala CE, Hoyman TL, Nowak RS (2006) Effects of elevated CO2on fine
root dynamics in a Mojave Desert community: a FACE study. Glob Chang Biol 12:61–73
Prather M, Ehhalt D, Dentener F, Derwent R, Dlugokencky E, Holland E, Isaksen I, Katima J, Kirchhoff V, Matson P, Midgley P, Wang M (2001) Atmospheric chemistry and greenhouse gases. In: Houghton YDJT, Griggs DJ, Noguer M, van der Linder PJ, Dai X, Maskell K, Johnson CA (eds) Climate change 2001: the scientific basis. Contribu-tion of Working Group I to the Third Assessment Report of the Intergovernmental Panel on Climate Change. Cam-bridge University Press, CamCam-bridge, pp 183–240 Richter GM, Semenov MA (2005) Modelling impacts of
climate change on wheat yields in England and Wales– assessing drought risks. Agric Syst 84:77–97
Rowell DP, Jones RG (2006) Causes and uncertainty of future summer drying over Europe. Clim Dyn 27:281–299 Savabi MR, Stockle CO (2001) Modeling the possible impact
of increased CO2and temperature on soil water balance,
crop yield and soil erosion. Environ Model Software 16:631–640
Schimel DS, House JI, Hibbard KA, Bousquet P, Ciais P, Peylin P, Braswell BH, Apps MJ, Baker D, Bondeau A, Canadell J, Churkina G, Cramer W, Denning AS, Field CB, Friedlingstein P, Goodale C, Heimann M, Houghton RA,
Melillo JM, Moore B, Murdiyarso D, Noble I, Pacala SW, Prentice IC, Raupach MR, Rayner PJ, Scholes RJ, Steffen WL, Wirth C (2001) Recent patterns and mechanisms of carbon exchange by terrestrial ecosystems. Nature 414: 169–172
Seneviratne SI, Pal JS, Eltahir EAB, Schar C (2002) Summer dryness in a warmer climate: a process study with a regional climate model. Clim Dyn 20:69–85
Shaw MR, Zavaleta ES, Chiariello NR, Cleland EE, Mooney HA, Field CB (2002) Grassland responses to global environmental changes suppressed by elevated CO2.
Science 298:1987–1990
Smith SD, Huxman TE, Zitzer SF, Charlet TN, Housman DC, Coleman JS, Fenstermaker LK, Seemann JR, Nowak RS (2000) Elevated CO2increases productivity and invasive
species success in an arid ecosystem. Nature 408:79–82 Strayer DL, Eviner VT, Jeschke JM, Pace ML (2006)
Understanding the long-term effects of species invasions. Trends Ecol Evol 21:645–651
Tschaplinski TJ, Stewart DB, Hanson PJ, Norby RJ (1995) Interactions between drought and elevated CO2on growth
and gas-exchange of seedlings of 3 deciduous tree species. New Phytol 129:63–71
Wan S, Luo Y, Wallace LL (2002) Changes in microclimate induced by experimental warming and clipping in tallgrass prairie. Global Change Biol 8:754–768
Wand SJE, Midgley GF, Jones MH, Curtis PS (1999) Responses of wild C4and C3grass (Poaceae) species to
elevated atmospheric CO2concentration: a meta-analytic
test of current theories and perceptions. Global Change Biol 5:723–741
Zavaleta ES, Thomas BD, Chiariello NR, Asner GP, Shaw MR, Field CB (2003) Plants reverse warming effect on ecosystem water balance. Proc Natl Acad Sci U S A 100:9892–9893 Zeng N, Qian HF, Roedenbeck C, Heimann M (2005) Impact
of 1998–2002 midlatitude drought and warming on terrestrial ecosystem and the global carbon cycle. Geophys Res Lett 32
![Table 1 The effect of elevated [CO 2 ], warming and watering on soil moisture content expressed as soil volumetric water content (VWC) of an old-field mixed species community in the 2004 and 2005 water years (October – September)](https://thumb-eu.123doks.com/thumbv2/123doknet/14871296.639992/4.820.73.764.397.956/elevated-watering-moisture-expressed-volumetric-community-october-september.webp)
![Fig. 1 The effect of elevated [CO 2 ], warming and watering on soil moisture content expressed as volumetric water content (VWC) of an old field mixed species community The three panels on the left side represent the dry plots and the three on the right re](https://thumb-eu.123doks.com/thumbv2/123doknet/14871296.639992/5.820.163.667.253.905/elevated-warming-watering-moisture-expressed-volumetric-community-represent.webp)
![Fig. 2 The effect of elevated [CO 2 ], warming and watering on soil moisture content. The panels on the left represent the difference in soil VWC between ambient [CO 2 ] and elevated [CO 2 ] (EC-AC) and the difference between ambient and warmed conditions](https://thumb-eu.123doks.com/thumbv2/123doknet/14871296.639992/6.820.158.666.258.909/elevated-watering-moisture-represent-difference-elevated-difference-conditions.webp)