HAL Id: hal-01628899
https://hal.archives-ouvertes.fr/hal-01628899
Submitted on 6 Nov 2017
HAL is a multi-disciplinary open access
archive for the deposit and dissemination of
sci-entific research documents, whether they are
pub-lished or not. The documents may come from
teaching and research institutions in France or
abroad, or from public or private research centers.
L’archive ouverte pluridisciplinaire HAL, est
destinée au dépôt et à la diffusion de documents
scientifiques de niveau recherche, publiés ou non,
émanant des établissements d’enseignement et de
recherche français ou étrangers, des laboratoires
publics ou privés.
Fredrik Eriksen, Renaud Toussaint, Antoine L. Turquet, Knut J. Måløy, Eirik
G. Flekkøy
To cite this version:
Fredrik Eriksen, Renaud Toussaint, Antoine L. Turquet, Knut J. Måløy, Eirik G. Flekkøy. Pneumatic
fractures in confined granular media. Physical Review E , American Physical Society (APS), 2017, 95
(6), pp.062901. �10.1103/PhysRevE.95.062901�. �hal-01628899�
Fredrik K. Eriksen,∗ Renaud Toussaint, and Antoine L. Turquet
Institut de Physique du Globe de Strasbourg,
Universit´e de Strasbourg/EOST,
Centre National de la Recherche Scientifique, Strasbourg, France
Knut J. M˚aløy and Eirik G. Flekkøy
PoreLab, Department of Physics, University of Oslo, Oslo, Norway
(Dated: November 6, 2017)
We perform experiments where air is injected at a constant overpressure Pin, ranging from 5 to
250 kPa, into a dry granular medium confined within a horizontal linear Hele-Shaw cell. The setup allows us to explore compacted configurations by preventing decompaction at the outer boundary, i.e. the cell outlet has a semi-permeable filter such that beads are stopped while air can pass. We study the emerging patterns and dynamic growth of channels in the granular media due to fluid flow, by analyzing images captured with a high speed camera (1000 images/s). We identify 4 qualitatively different flow regimes, depending on the imposed overpressure, ranging from no
channel formation for Pin below 10 kPa, to large thick channels formed by erosion and fingers
merging for high Pinaround 200 kPa. The flow regimes where channels form are characterized by
typical finger thickness, final depth into the medium and growth dynamics. The shape of the finger tips during growth is studied by looking at the finger width w as function of distance d from the tip.
The tip profile is found to follow w(d) ∝ dβ, where β = 0.68 is a typical value for all experiments,
also over time. This indicates a singularity in the curvature d2d/dw2 ∼ κ ∼ d1−2β
, but not of the
slope dw/dd ∼ dβ−1, i.e. more rounded tips rather than pointy cusps, as they would be for the case
β > 1. For increasing Pin, the channels generally grow faster and deeper into the medium. We show
that the channel length along the flow direction has a linear growth with time initially, followed by a power law decay of growth velocity with time as the channel approaches its final length. A closer
look reveal that the initial growth velocity v0 is found to scale with injection pressure as v0∝ P
3 2 in,
while at a critical time tcthere is a cross-over to the behavior v(t) ∝ t−αwhere α is close to 2.5 for all
experiments. Finally, we explore the fractal dimension of the fully developed patterns. For example
for patterns resulting from intermediate Pinaround 100-150 kPa, we find that the box-counting
di-mensions lie within the range DB∈ [1.53, 1.62], similar to viscous fingering fractals in porous media.
PACS numbers: 83.60.Wc, 81.05.Rm, 47.20.Ma
I. INTRODUCTION
Several processes in engineering, industry and earth sciences involve pneumatic (gas) or hydraulic (liquid) fracturing of the soil, which occurs when fluids in the ground are driven to high enough pressures to deform, fracture and generate porosity in the surrounding soil or rock. For example in environmental engineering, pneu-matic or hydraulic fracturing is done to enhance the re-moval of hazardous contaminants in the vadose zone (soil remediation) [1, 2], for soil stabilization injection to en-sure a solid foundation for structures [3], or in packer tests for project planning, risk assessment and safe con-struction of dams and tunnels [4]. In industry, hydraulic fracturing is done to enhance oil and gas recovery [5–7], CO2 sequestration [8], water well- and geothermal
en-ergy production [9–11]. Related natural processes such
∗Also at PoreLab, Department of Physics, University of Oslo,
Oslo, Norway; Correspondence: [email protected]
as subsurface sediment mobilization are studied in earth sciences, where sand injectites, mud diapirs and mud vol-canoes are formed due to pore-fluid overpressure [12–17]. For example, the Lusi mud volcano in Indonesia is the biggest and most damaging mud volcano in the world [18], having displaced 40 000 people from their homes, and has been active since May 2006. There is an on-going debate about how it was triggered, i.e. whether it formed naturally by an earthquake or geothermal process [19–22], or that it is a man-made consequence of a nearby drilling operation by a company probing for natural gas [23].
Fluid injections into granular media has been exten-sively studied in laboratory experiments and simulations, where a common method to simplify the problem is to confine the experiment within a quasi-2-dimensional ge-ometry, i.e. a Hele-Shaw cell. In [24, 25], the decom-paction, fluidization regimes, and coupling between air and granular flow was studied in dry granular media in open circular and rectangular cells during air injection at different overpressures. Similar behavior was seen for
liquid saturated granular material injected with the same liquid [26], so it is reasonable to assume that studies of pneumatic fracturing also have qualitative relevance to hydraulic fracturing. The two cases are similar in the sense that no interface tension and viscosity difference exist between the invading and interstitial fluids. In sys-tems where gravity is felt significantly, as in inclined or vertical systems, the density of the fluid is a notable dif-ference, and buoyancy forces on the grains are significant for liquids, but usually negligible for gases. In horizon-tal layers and thin compacted systems, where gravity is perpendicular to the system and plays no major role on the horizontal motion of such quasi two-dimensional sys-tems, the main difference in an experiment where a liquid is used instead of a gas is that the compressibility is lower such that the overpressure imposed at the boundary dif-fuses much faster [27]. However, near the invading chan-nels, the pressure gradients are found to be qualitatively similar in both cases [28], leading to similar growth mech-anisms for the channels [26]. Further, the compressibility felt in water on the scale of a ∼ 100 m reservoir is similar to the compressibility felt in air on the scale of a ∼ 1 m ex-periment, and therefore the effect of pressure diffusion is included when air is used in ∼ 1 m model reservoirs. An-other difference is that for a given pore pressure gradient and grain configuration (permeability), the fluid velocity between the grains is inversely proportional to the vis-cosity force. The stress thresholds allowing to overcome friction with the confining plates depends mainly on the solid fraction, and does not change in order of magni-tude between cases where the interstitial fluid is a gas or a liquid [26]. Consequently, for similar channel geome-tries and grain packings, the pressure difference between inlet and outlet that lead to grain motion are similar in the two systems. However, the grain mobility is observed to be essentially inversely proportional to the pore fluid viscosity, i.e. the observed dynamics are similar in terms of a reduced time corresponding to time multiplied by the pore fluid viscosity [26]. The patterns observed are also close to each other [26]. The patterns formed during fluid injection into a granular medium, and evolution of the fluid-solid interface, have been found to resemble Dif-fusion Limited Aggregation patterns (DLA) and viscous fingering [29], a fingering instability that occurs when a less viscous liquid is injected into a porous medium containing a more viscous liquid with which it cannot mix [30]. As mentioned in [25], the main difference be-tween the viscous- and granular fingering instabilities is the absence of interfacial tension in the granular case. For example, the stabilizing forces in viscous fingering are surface forces, while in granular fingering it is the build-up of friction between particles and against the con-finement. However, both instabilities are driven by the pressure gradient across the defending medium, which is largest on the longest finger tips, making more advanced fingers grow on expense of the less advanced ones. A no-table difference between air injection into a dry granular medium and a saturated one is that the overpressure
ini-tially diffuses into the packing in the dry case, while it is already a steady-state Laplace field over the defending liquid in the saturated case. This difference arises from the compressibility of the defending phase.
Further, during air injection into liquid saturated gran-ular media and suspensions, the characteristics of emerg-ing patterns and behavior of the media depend on injec-tion rate, and the competiinjec-tion between mobilized fricinjec-tion and surface forces [31–44]. For example, one observes flow regimes such as two phase flow in rigid porous me-dia [40–44], capillary fracturing, stick-slip bubbles and labyrinth patterns [31–39]. In the opposite case, dur-ing liquid injection into dry granular media [45], for a given imposed flux, the flow behavior goes from stable invasion towards saturated granular fingers for increas-ing flow rate and viscosity of the invadincreas-ing fluid. These fingering patterns are thought to form due to the per-meability contrast between the channels empty of grains and the granular medium, and are in this sense similar to viscous fingering, with a lower viscous pressure drop in empty channels than in the porous medium, as in classi-cal viscous fingering systems where the viscosity contrast leads to a similar effect, i.e. where the invading fluid has a lower viscosity than the invaded one [30, 42, 46]. An important difference with classical viscous fingering is the presence of solid stresses and solid friction in the granular material. This is a stabilizing phenomenon absent from systems with two Newtonian fluids: A threshold arising from friction with the system boundaries has to be over-come in viscous fluid drag to allow for grain motion. The same trend is shown in numerical studies for gas injection into granular media containing the same gas [47].
Granular fingering instabilities have also been studied in closed vertical cells, where gravity drives the flow as heavier beads fall down from a granular layer at the top of a lighter fluid layer [48–53]. When the beads detach at the front, they form fingers of falling granular mate-rial surrounding finger-like bubbles of rising fluid. These fingers are found to coarsen over time until they reach a typical wavelength depending on the interstitial fluid and bead size.
Typically, in all processes involving fluid injection into granular media, there are flow regimes where the medium has either solid-like behavior or fluid-like behavior. This is one of the special properties of granular materials, which also show gas-like behavior in some cases [54].
In this paper, we present an experimental study on flow regimes and pattern formation during air injection into confined granular media, while the surrounding deforma-tion and pore-pressure evoludeforma-tion is studied in a related article [28]. More specifically, we inject air at constant overpressure into a dry granular medium inside a Hele-Shaw cell, where air escapes at the outlet while beads cannot. The motivation of this setup is to study the gran-ular Saffman-Taylor instability in compacting grangran-ular media, and the coupling between compaction and flow. A similar, but smaller system has been studied in numer-ical simulations by Niebling et al. [47, 55]. During air
injection at different overpressures they found that frac-tures grow faster, longer, as well as coarsen with increas-ing injection pressure. There, the fracture propagation velocity is roughly constant initially and scales with the square root of the injection pressure. Further, by vary-ing the interstitial fluid viscosity, two flow regimes were identified; one with finely dispersing bubbles and large scale collective motion of particles, the other one with build-up of a compaction front and fracturing. These flow regimes depend, respectively, on whether the par-ticles are primarily accelerated by the imposed pressure gradient in the fluid, or interactions through particle con-tacts. This in turn depends on the diffusivity of the inter-stitial fluid pressure in the granular medium. We analyze our findings in light of these results, to investigate what is similar and what is different in our roughly 10 times larger cell with the same cell gap. As opposed to sim-ilar experiments, with open outer boundary conditions, after the flow compacts the medium there is no decom-paction. We thus expect the material behavior (at high enough overpressure to displace beads) to have a transi-tion from fluid-like to solid-like during experiments, and that eventual invasion patterns will initially resemble vis-cous fingering in the fluid-like regime, crossing over to stick-slip fracture propagation as the medium becomes more solid-like, until it reaches a final structure as the compacted medium has reached a completely solid-like behavior. What is less obvious, is how the flow patterns in this system change with the injection pressure. By varying the imposed overpressure, we identify and de-scribe the different flow regimes. Due to the confined nature of the experiment, it is thought to be a labo-ratory analog to pneumatic and hydraulic fracturing of tight rock reservoirs where the free boundary at the sur-face is very distant from the injection zone. Therefore, new insight into this problem may have industrial appli-cations in addition to increase the understanding of flow and transformations in porous media.
It is also worth to mention a closely related project [56], where acoustic emissions recorded during the ex-periments are analyzed. There, it is shown that different stages of the invasion process can be identified acousti-cally in terms of characteristic frequencies and distinct microseismic events.
II. METHODS
A. Experimental setup
The experimental setup is a linear Hele-Shaw cell, par-tially filled with Ugelstad spheres [57], i.e. dry, non-expanded polystyrene beads with a diameter of 80µm ± 1 %. The cell is made out of two rectangular glass plates (80×40×1 cm in length, width and thickness re-spectively) clamped together on top of each other with an aluminum spacer controlled separation of 1 mm. A cell volume (76×32×0.1 cm) is formed between the plates by
2bj00Side0view
2aj00Top0view
High Speed0 Camera Thickness0of0granular0medium0=010mm Granular0medium 800μm0beads Semi-permeable0outl et Inlet0 hole Impermeable0boundary Air Impermeable0boundary Impermeable0boundary 700cm 320cm Air0injection Air0outletFIG. 1. Sketch of the experimental setup. (a) Top-down
view of the prepared cell: The granular medium is confined inside the cell by three impermeable boundaries and an air-permeable boundary on the outlet side. The granular medium is placed against the outlet boundary such that it has a linear interface against a region empty of beads on the sealed inlet
side, where pressurized air can be injected. (b) Side view
of the setup showing the high speed camera placed above. The glass plates are clamped together with aluminum framing while the cell gap is controlled with spacers, which are not shown here.
an impermeable sealing tape as shown in figure 1, with one of the short sides left open (outlet). Next, beads are filled into the cell by pouring them through the open side until the packing occupy about 90 % of the cell volume, followed by closing the open side with a semi-permeable filter (a 50µm steel mesh) to keep beads inside the cell while allowing air to escape. The cell is then flipped ver-tically to place the granular medium against the semi-permeable outlet by using gravity, resulting in a volume packing fraction of approximately ρs = 0.44 ± 0.04,
as-sumed to be more or less uniform across the medium (in a quasi-2D system of ∼ 10 beads thickness, the con-fining plates cause a frustrated system with lower pack-ing fraction [58], as observed previously in similar sys-tems where ρs = 0.44 [24] and ρs = 0.42 [47]). This
leaves a volume empty of beads on the sealed side of the cell, opposite to the semi-permeable outlet, with a lin-ear air-solid interface. An inlet hole on the sealed side
(b) (c) (a)
20 cm
FIG. 2. Example of image processing. (a): The initial granular medium, (b): A snapshot during the experiment, (c): The resulting binary image where the pattern has been segmented. The segmentation is done by setting all pixels having 30 % less grayscale intensity in a snapshot compared to the initial image to the value 1 while the other pixels are set to the value 0.
of the cell is connected to a pressurized air tank which lets us inject air at a constant and maintained overpres-sure, Pin= Pabs,in− P0(absolute pressure - atmospheric
pressure), ranging from 5 to 250 kPa. This will force air to move through the granular medium, towards the semi-permeable outlet, where Pabs,out = P0 = 100 kPa,
or in terms of overpressure above the atmospheric one, Pout= 0.
During experiments, the prepared cell is positioned horizontally. A selected overpressure is set at the pres-sure tank outlet and verified by a Honeywell prespres-sure sensor with an accuracy of ±4 kPa. The tubing between the pressure tank and the cell inlet is equipped with an electronic valve such that the air injection is started with a digital trigger signal. Positioned above, with a top-down view of the cell, a Photron SA5 high speed camera is started with the same trigger signal, recording the air invasion at a framerate of 1000 images/s and a resolu-tion of 1024×1024 pixels (1 pixel ≈ 0.7 mm in the cell). Light from a 400 W Dedolight studio lamp provides uni-form and flicker-free illumination onto the white beads of the medium. A small fraction of the beads (< 10 %) are dyed black with ink to create tracer particles that are used for tracking frame-to-frame deformation in the granular medium, which is studied in another article [28] (note that in figures 2, 3 and 6, there are some darker areas creating patterns in the initial packing. This is due to a higher concentration of dyed beads, which is re-lated to the initial preparation process and the packing method. It does not seem to have any influence on the experiments). The experiments are run for 10 s, but typ-ically the fracturing and/or compaction of the granular medium takes less than 5 s.
B. Image processing
In analysis of the images from the high speed camera, we investigate flow regimes, characteristics and evolution of the fingering patterns formed. We perform image pro-cessing with Matlab to obtain the information contained in the images. Quantitative analysis of the invasion pat-terns is done by converting the grayscale raw data into bi-nary images, i.e. images with either black or white pixels, where the white pixels (value=1) represent the pattern and the black pixels (value=0) represent the background,
or the bead-filled region. We obtain such binary image sequences from the raw data by thresholding each frame with the initial image, such that the pixels having a value less than 30% of the corresponding initial value becomes white and the rest remain black, as shown in figure 2 (c). In addition, once a pixel is invaded (and made white) it will remain white for the rest of the experiment to cor-rect for mobilized beads flowing inside channels, which occurs due to erosion and fingers merging in some exper-iments. From the binary images we extract information such as invasion depth over time, average finger thickness as function of depth, and fractal dimensions.
III. RESULTS
Depending on injection pressure (and friction related to packing fraction) we observe the granular medium to exhibit either a solid-like behavior, or a transition from fluid-like to solid-like behavior during air injection. In the solid-like regime, there is no apparent deformation (bead displacements), and the air is reaching the cell outlet by seeping through the network of pores between beads. On the other hand, in the fluid-like regime we observe sig-nificant deformation, where beads are displaced by an amount corresponding to several bead sizes, by momen-tum exchange between air molecules and beads. At suf-ficient overpressure the granular medium has a behavior much like a viscous liquid being invaded by air, as the flow opens up channels empty of beads, a Saffman-Taylor like instability [30] resulting in dendritic invasion patterns. A stabilizing mechanism of this flow instability is the build-up of friction and stress chains between beads dur-ing compaction, so due to the boundary conditions in our experiments we always end up with a solid-like medium towards the end of an experiment. Since the channels empty of beads display patterns with finger-like features, and that the air-solid interface expands similarly to a fin-gering instability, we refer to the branches of the chan-nels as fingers when we characterize the patterns. At the same time, the fingers have a long and slender morphol-ogy which is fracture-like, and during growth frictional ”bonds” between the compacting grains and the con-fining plates are broken in order to open the channels. Therefore we consider the channel growth as fracturing, although there are no cohesive bonds broken as in the
TABLE I. The flow categories with related pressure values;
mean overpressure within two standard deviations Pin± 2σ,
as well as the number of experiments N analyzed per category.
Category Pin± 2σ [kPa] N 1 9 ± 5 3 2 26 ± 18 5 3a 64 ± 50 5 3b 110 ± 44 6 4a 134 ± 43 10 4b 213 ± 50 4
traditional sense of fracturing.
A. Flow regimes
To explore the various flow regimes we have systemat-ically varied the air injection pressure within the range of 5 kPa to 250 kPa, and we have identified 4 quali-tatively different flow regimes occurring in this range. Within certain flow regimes, the pattern characteristics gradually change with increasing injection pressure, so we have grouped the experimental results into six cat-egories defined by final pattern characteristics and how the channels expand. The categories are chosen in order to obtain average results from similar experiments, and are defined in the list below. Typical final structures are shown for each category in figure 3, and the associated range of injection pressure is listed in table I. Videos of channels formed in categories 3a,b and 4a,b are found in the supplementary material [60–63].
• Category 1 - No deformation:
The porous medium appears rigid (solid-like), with no significant bead displacement or invasion pat-tern formed. This is flow regime #1, where the pore pressure gradient does not overcome the threshold for bead displacement which arise from granular stress, friction between the beads and bead-plate friction.
• Category 2 - Initial compaction without channels: The medium is initially compacted during a col-lective displacement of beads towards the outlet side, without the formation of invasion channels. This is flow regime #2, where the pore pressure gradient is initially high enough to overcome the granular stress threshold arising from the friction with the plates. Then, as the pore pressure dif-fuses into the medium, the pore pressure gradient drops below the bead displacement threshold and the deformation stops before channels are formed. During the short time beads are displaced, they are primarily moved by the pore pressure gradient, i.e. stress from the fluid injection transmitted through solid contacts (compacting zone) does not signifi-cantly extend beyond the influence of the
overpres-sure (skin depth), leading to collective bead dis-placement rather than the formation of fractures [47].
• Categories 3a and 3b - Thin branched channels are formed:
After the initial compaction, a dendritic invasion pattern is formed with an average finger thickness less than 2 cm. This is flow regime #3, where the pressure gradient is high enough to deform the medium, also after the compacting zone reaches beyond the influence of the pore pressure gradi-ent. This leads to random perturbations in the air-solid interface and fracture channels begin to form [47]. At later times, the channel growth stops as the medium is compacted, i.e. the solid stress and friction increase such that the bead displacement threshold eventually becomes too large for further deformation. In this flow regime, the channels be-come longer with increasing injection pressure, so we define arbitrarily (in order to perform statisti-cal analyses on groups of experiments) category 3a as when the final length of the channel is less than 50% of L = 70 cm, the initial length of the granular medium, and category 3b as when the final length of the channel is more than 50% of L.
• Categories 4a and 4b - Branched channels are formed and eroded:
After the initial compaction, a long dendritic inva-sion pattern is formed (as in category 3b) with a main channel thicker than the branch fingers, due to erosion inside the channel. This is flow regime #4, where the high pressure gradients at the most advanced channel tips cause a large enough fluid flux inside the channels to re-mobilize beads along with the flow. The width of the main channel increases by erosion (i.e. motion of beads non-perpendicular to the channel interface, but with a major tangential component along it). For higher pressures, side channels and branches may also merge into the main channel. In this case, the high flow velocity in the main channel might reduce the fluid pressure slightly such that adjacent channels grow into it. In this flow regime, the degree of ero-sion increases gradually with increasing injection pressure, so we define two categories. Category 4a is defined as when there is only erosion, where the average finger thickness of the final structure is typ-ically between 2 cm and 4 cm. The erosion is not persistent, and rarely occurs more than 15 cm be-hind the most advanced tip. Category 4b is defined as when there is both erosion and channels merging, where the average finger thickness of the final struc-ture is typically more than 4 cm. Erosion and chan-nel merging is observed to occur even at distances of 30-40 cm behind the most advanced tip. Again, the erosion is not persistent and stops around the point when the channel structure reaches 90 % of
20 cm
P
in= 6 kPa
Cat. 1
Cat. 2
P
in= 30 kPa Cat. 3a
P
in= 50 kPa
Cat. 3b
P
in= 100 kPa Cat. 4a
P
in= 150 kPa Cat. 4b
P
in= 200 kPa
FIG. 3. Typical final structures per category, where the granular medium is gray and areas empty of beads are black, showing
that for increasing Pin the fingers become longer and thicker. A full-size figure of the patterns shown here is found in the
supplementary material [59].
its final length.
As one can expect due to the heterogeneous nature of the grain packings, and the variability of the grain assem-bly between experiments, a significant dispersion of the resulting patterns is observed for experiments at similar imposed pressures, and consequently, the pressure ranges for the categories overlap (see table I). The distribution of new growth dA behind the longest fingers at differ-ent intervals is shown in figure 4 for typical experimdiffer-ents in the categories 3a,b and 4a,b. The new growth dA refers to the change in channel area between two succes-sive snapshots. The new growth in figure 4 is found by subtracting successive binary images A of the patterns pixel by pixel, i.e. dA = A(t + ∆t) − A(t), where ∆t is the time between snapshots where the channels grow by 10 % increments of their final lengths (this method of selecting ∆t is done in order to determine where the channels are growing at different stages, and thus to plot distributions of dA with comparable space integrals at different times of the experiment, since the growth rate decreases at later times). In the plots, the distribution of new growth over the distance d behind the most advanced finger is represented by a normalized value ndA(d), which
is the mass of the new growth dA at the depth d, divided by the width of the cell such that ndA(d) is a
dimen-sionless number ∈ [0, 1] indicating the fraction of the cell width at position d that contains new growth. For cate-gories 3a,b and 4a the growth typically extends in a re-gion of 10-15 cm behind the most advanced tip, whereas for category 4b the growth extends along the whole chan-nel length. The category 4b chanchan-nels have a rapid and large volume change compared to the other ones, with a high air flow velocity resulting in erosion along the entire channel. In addition, the rapid expansion could let the channel pressure remain somewhat lower than Pinduring
growth, such that when it stops the pressure rises to Pin.
If it is so, pressure gradients could form at the solid-air interface far behind the most advanced finger explaining the small growth there. The displacement of the granular
medium outside the channels is similar for all categories; Beads are pushed in front of the channels and compacted until the system is jammed. Beads are also pushed out from the side of the advancing channel tips, opening up for branches.
In the rest of the paper, we focus on the categories 3a,b and 4a,b, which are in flow regimes #3 and #4 where invasion channels are formed. For these flow regimes, we discuss the typical characteristics of the patterns formed and their growth dynamics.
Cat. 3b
DistanceLbehindLfingerLtip,LdL[cm]
0
10
20
30
40
50
60
0
0.1
0.2
0.3
0.4
0.5
0.6
0.7
0.8
0.9
1
Cat. 3a
LocalLgr
owthL/LcellLwidth,Ln
dAL 0L-L10LA 10L-L20LA 20L-L30LA 30L-L40LA 40L-L50LA 50L-L60LA 60L-L70LA 70L-L80LA 80L-L90LA 90L-L100LA 0L-L10LA 10L-L20LA 20L-L30LA 30L-L40LA 40L-L50LA 50L-L60LA 60L-L70LA 70L-L80LA 80L-L90LA 90L-L100LACat. 4a
DistanceLbehindLfingerLtip,LdL[cm]
0
10
20
30
40
50
60
0
0.1
0.2
0.3
0.4
0.5
0.6
0.7
0.8
0.9
1
LocalLgr
owthL/LcellLwidth,Ln
dAL 0L-L10LA 10L-L20LA 20L-L30LA 30L-L40LA 40L-L50LA 50L-L60LA 60L-L70LA 70L-L80LA 80L-L90LA 90L-L100LACat. 4b
0L-L10LA 10L-L20LA 20L-L30LA 30L-L40LA 40L-L50LA 50L-L60LA 60L-L70LA 70L-L80LA 80L-L90LA 90L-L100LADistanceLbehindLfingerLtip,LdL[cm]
0
10
20
30
40
50
60
0
0.1
0.2
0.3
0.4
0.5
0.6
0.7
0.8
0.9
1
LocalLgr
owthL/LcellLwidth,Ln
dALDistanceLbehindLfingerLtip,LdL[cm]
0
10
20
30
40
50
60
0
0.1
0.2
0.3
0.4
0.5
0.6
0.7
0.8
0.9
1
LocalLgr
owthL/LcellLwidth,Ln
dALFIG. 4. Distribution of new growth over the distance behind the most advanced finger tip, at different intervals, during typical experiments in categories 3a,b and 4a,b. The new growth is measured on intervals between successive snapshots where the channel length grows 10 % of the final channel length for each snapshot. The large initial new growth (0 % - 10 %) in all plots corresponds to the initial bulge that forms before the channeling instability begins. The plots indicate the depth of the active growth zone, which goes from very narrow for category 3a (the growth is focused on the most advanced tips), to the whole channel length for category 4b.
B. Finger characteristics
In figure 5 we see the average finger thickness w of the final structures as function of depth x into the granular medium, measured from the initial boundary position. The average finger thickness of a pattern at a given depth into the granular medium is found by intersecting the bi-nary image of the pattern with a line perpendicular to the average flow direction at that depth, and count the total number of white pixels intersected. In other words, the total width of the pattern is measured followed by dividing it by the number of connected pixel groups, i.e. the number of fingers. This is done for each experiment and the results are averaged within each category. We see that the patterns in categories 3a and 3b have roughly
the same thickness, averaging around 1.4 cm and is more or less constant as function of depth. We do not observe erosion inside these channels, so a finger thickness around 1.4 cm seems typical when there is no erosion. The cat-egory 4a patterns show initially thicker fingers along the first half of the structures, here with an average thickness of 3.3 cm, which then decreases down towards the typ-ical thickness seen for categories 3a and 3b. The larger initial finger thickness is due to erosion inside the main channel, meaning that beads near the channel walls are re-mobilized in the flow direction after the initial growth, making the channel grow perpendicular to it. As average thicknesses here suggest, this effect typically increase the channel width by an amount of around 2 cm. The cate-gory 4b patterns typically have thick fingers throughout
Depthkintokmedium,kxk[cm]
0
10
20
30
40
50
60
70
Avg.kfinger
kthickness,kw
k[cm]
0
5
10
15
20
25
30
Cat.k3a Cat.k3b Cat.k4a Cat.k4bFIG. 5. Average finger thickness w as function of depth x into the medium for the final structures, averaged per category where channels occur. We see that for the structures in Cat. 4a (erosion) and Cat. 4b (erosion and finger merging) the fingers are thicker - all the way up to the finger tip for Cat. 4b.
their entire length up to the tips, with an average of 5.3 cm. This thickness is achieved both by erosion inside the main channel, and with fingers merging together. Af-ter fingers merge and trap clusAf-ters of beads, these beads are mobilized in the flow direction. In general we see an increase in finger thickness and length for increasing pres-sures. Some examples of both erosion and finger merging are shown in figure 6 for an experiment with Pin = 200
kPa.
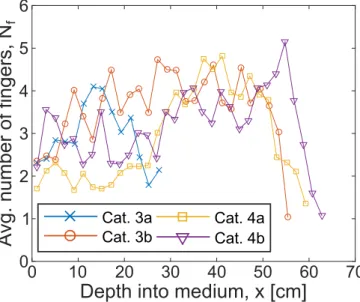
The plot in figure 7 shows the average number of fin-gers Nfas function of depth x into the medium (found as
the number of connected pixel groups on vertical cross-sections, as explained for figure 5) for the final struc-tures in each category. For patterns in the categories 3a and 3b, the number of fingers increase at lower depths than for patterns in the categories 4a and 4b, where there is a more pronounced initial region with fewer fin-gers, crossing over to more fingers during the last half of their length. This could indicate that channels with few branches form when the friction is low compared to the driving force ∝ ∇P , with a cross-over to the patterns branching out with more fingers as the friction is becom-ing comparable to the drivbecom-ing force due to compaction. The sudden drop in Nf at the deepest parts of the
pat-terns is due to the finite size of the structures, where only a few of the longest fingers reach.
To get a description of the shape of finger tips, we look at how the finger thickness w grow as function of distance d from the finger tip, which is found to follow a power law within the length of the tip region [29] (where the finger thickness increase with d before it saturates):
t = 480 ms
t = 680 ms
t = 370 ms
t = 425 ms
20 cm
t = 280 ms
t = 125 ms
t = 150 ms
t = 175 ms
t = 200 ms
t = 250 ms
280 370 425 480 680
5 cm
125 150 175 200 250
5 cm
time [ms]
time [ms]
FIG. 6. Snapshots from an experiment with Pin= 200 kPa,
showing examples of erosion and finger merging. The green rectangle indicates the area cut out and enlarged in the bot-tom right inset: Here we see erosion inside the channel as beads (gray area) are removed over time. The white arrows point at fingers that will merge into the main channel in the following snapshot, carving out trapped clusters of beads which are then mobilized in the flow direction. A full-size version of this figure is found in the supplementary material [64].
w(d) ∝ dβ. (1)
When w is plotted as a function of d in a log-log plot, the slope β for w(d) within the tip region reveal informa-tion about the shape of the tip; it has a more rounded shape for β < 1, while it has a pointy cusp-shape for β > 1. We have averaged w(d) over time for each exper-iment, i.e. obtaining the average finger tip shape during flow in each experiment. Figure 8 (a) shows a log-log plot of the finger thickness as function of distance from the finger tip, averaged per category. The collapsed av-erage slopes from all experiments seem to fall along the same line with β = 0.68, indicating more rounded finger tips with the same shape in all experiments. However, a purely round profile would give β = 0.5, so the fact
Depthfintofmedium,fxf[cm]
0
10
20
30
40
50
60
70
Avg.fnumb
erfofffinger
s,fN
f0
1
2
3
4
5
6
Cat.f3a Cat.f3b Cat.f4a Cat.f4bFIG. 7. The average number of fingers Nfas function of depth
x into the granular medium, averaged over the final patterns in the same category. The plot indicates that for increasing injection pressure, an initial region with fewer fingers extends
deeper into the medium before an increase in Nf towards the
final depth. This suggests more branching of the channels as
the beads become harder to displace. The sudden drop in Nf
close to the tips is due to the finite size of the patterns.
that we measure a bigger value means that there still is a singularity in curvature towards the tip - even if it is not a spike shape. The singularity can be shown as follows, where
w ∼ dβ ⇒ d ∼ wβ1 ⇒ dd
dw ∼ w
1
β−1, (2)
gives the slope of the front. From this we find the expression for the curvature as,
κ ∼ d
2d
dw2 ∼ w 1
β−2 (or d1−2β). (3)
If β > 0.5, β1 − 2 < 0 and κ diverges at the tip where w (and d) → 0. At the same time, if β < 1, the slope does not diverge at d = 0, and yields a more rounded profile.
We have not observed any cusps as reported in [29] with β = 1.43 ± 0.2, consistent with theory on fluid fin-gering in the zero-surface tension limit. The evolution of β over time is plotted in figure 8 (b), which shows that for all experiments, β fluctuates around the estimated value β = 0.68 over time, indicating that the tip shapes does not seem to change significantly during the different stages of the experiments.
log
10(d/w
b)
-2 -1.5 -1 -0.5 0 0.5log
10(w/w
b)
-1.4 -1.2 -1 -0.8 -0.6 -0.4 -0.2 0 0.2 Cat. 3a Cat. 3b Cat. 4a Cat. 4b a 4a b 4 b(a)
(b)
Slope
, β
Slope = 0.68FIG. 8. (a) The finger thickness w plotted in a log-log plot as function of the distance d from the finger tip. The data shown is the average of about 50 measurements in time for each experiment, averaged again for each category. The data
is collapsed by the finger thickness at the base of the tips wb
found as the average finger thickness where w has reached a more or less constant level, which seems to be a typical length scale for the tip region. The average slope at different times during several experiments is β = 0.68, indicating a more rounded shape of the tips. In the inset: Snapshot of typical finger tips together with profiles corresponding to β = 0.68 (yellow lines). (b) The slope β averaged per category as function of time during experiments. The plot shows that the slope for the tip profile fluctuates around β = 0.68 over time during the experiments, suggesting that the tips are more rounded than cusp-like at all times.
C. Fractal analysis
By looking at the invasion patterns, we notice that they have self-similar features, e.g. a smaller branch re-semble the whole larger pattern. To characterize this fea-ture we analyze fractal dimensions of the final patterns in
three different ways. The box-counting dimension DB is
found for each final structure by covering the binary im-age with boxes, i.e. dividing the imim-age into equal squares of sides s, and count the number N of squares that con-tain a white pixel as function of box size s. For a fractal, the relationship between the number of boxes covering the pattern and their size follow a power law
N (s) ∝ s−DB, (4)
such that the box-counting dimension DB is found as
the negative value of the slope of N (s) in a log-log plot [31, 46, 65, 66]. By obtaining box-counting data over a range of sizes s, we estimate DB from the slope of
lin-ear fits between an upper cutoff s = 32 cm (cell width) and a lower cutoff s = 1 cm (typical for thinner fingers). In addition, we obtain the box-counting dimension DF
of the front (air-solid interface). This is found in the same way as the box dimension, but with binary images where only pixels on the perimeter of the patterns are white. Finally, we estimate local fractal dimensions DL
as function of depth along the structures. To get the lo-cal fractal dimension at a given depth, we intersect the structure at that depth with a vertical line (perpendic-ular to the flow direction) and do a 1-dimensional box counting along that line, i.e. divide the line into pieces of equal length l and count the number N of line seg-ments containing white pixels as function of l. Again, for a fractal we have the power law
N (l) ∝ l−DL, (5)
and we find the local fractal dimensions at given depths from slopes of linear fits between l = 16 cm and l = 1 cm. To compare DLwith DBwe use one of Mandelbrot’s
rules of thumb [66, 67]. It states that the codimension of an intersected set equals the sum of the codimensions of the individual intersecting sets, here given by
E2− DL= (E2− E1) + (E2− D)
⇓
D = DL+ 1,
(6)
where D is the fractal dimension of the pattern, E1= 1
is the dimension of the line intersecting it, and E2= 2 is
the dimension of the image plane containing the sets. The box-counting dimensions are averaged per flow category and plotted in figure 9. We see that the box dimension for the less developed category 3a patterns is DB = 1.41. For categories 3b and 4a, the box dimensions
are DB= 1.54 and DB= 1.53 respectively. For category
4b patterns, we observe DB = 1.63. Patterns in
cate-gory 3b and 4a have box dimensions within the range of fractal dimensions found for viscous fingers in saturated porous media, i.e. D = 1.53 - 1.62 [31, 46, 68].
log
10(yBoxysizey)y[cm]
-0.5 0 0.5 1 1.5 2log
10(yBoxycoun
tsy)
0 0.5 1 1.5 2 2.5 3 3.5 4 Cat.y3a Cat.y3b Cat.y4a Cat.y4bCategory
3a 3b 4a 4b
yD
B1
1.2
1.4
1.6
1.8
2
FIG. 9. Average box-counting slopes per category, the lower and upper limits are indicated with the vertical lines and mark the typical thickness of the thinnest fingers (1 cm) up to the
cell width (32 cm). In the inset: Box-counting fractal
di-mensions DB averaged per category, the error bars show 2
standard deviations. Patterns in categories 3b and 4a with
DB = 1.53 and DB = 1.54 are within the range of earlier
measured fractal dimensions for viscous fingers in saturated porous media (between the dashed lines). The less developed
patterns in category 3a is below this range, with DB = 1.41,
and the thicker category 4b patterns are close above with
DB = 1.63. The solid line indicates DB = 1.71 for Diffusion
Limited Aggregation patterns.
log
10(yBoxysizey)y[cm]
-0.5
0
0.5
1
1.5
2
log
10(yBoxycoun
tsy)
0
0.5
1
1.5
2
2.5
3
3.5
4
Cat.y3a Cat.y3b Cat.y4a Cat.y4bCategory
3a 3b 4a 4b
yD
F1
1.2
1.4
1.6
1.8
2
FIG. 10. Average box-counting slopes of the air-solid inter-face of the final structures per category, the lower and upper limits are indicated with the vertical lines and mark the typi-cal thickness of the thinnest fingers (1 cm) up to the cell width
(32 cm). In the inset: Box-counting fractal dimensions DF
of the solid-air interface per category. The error bars show 2 standard deviations.
Depth+into+granular+medium,+x+[cm]
0
10
20
30
40
50
60
70
Local+dim
ension
,+D
L+S+1
1
1.2
1.4
1.6
1.8
2
log
10C+Box+size+b+[cm]
-1 -0.5 0 0.5 1 1.5log
10C+Box+coun
t+b
0 0.5 1 1.5 2 2.5 Cat.+3a Cat.+3b Cat.+4a Cat.+4b x=10+cm x=20+cm x=30+cm x=40+cm Slope+at+10+cm Slope+at+20+cm Slope+at+30+cm Slope+at+40+cmFIG. 11. Top: Local fractal dimensions (DL+ 1) as function
of depth into the medium for the final structures averaged per category. We see that the patterns in all categories have more or less constant and well defined local dimensions as functions of depth. The main parts of the patterns in categories 3a,b and 4a have local dimensions corresponding to established val-ues for viscous fingers in saturated porous media (between the dashed lines). For patterns in category 4b, the local dimen-sions correspond to values closer to the fractal dimension for DLA patterns and flow patterns in a saturated Hele-Shaw cell (solid line). Bottom: Examples of local box-counting slopes at different depths of the same experiment.
Figure 10 shows the results of box-counting the air-solid interface of the final structures, averaged per cat-egory. We see that categories 3a,b and 4a have inter-face dimensions DF = 1.40, 1.52, 1.48 respectively which
are close to their corresponding box-counting dimensions, while category 4b patterns have DF = 1.41 which is
about 0.2 less than the corresponding box dimension. This can be interpreted in terms of finger thickness, i.e. the front becomes more similar to the structure for de-creasing finger thickness.
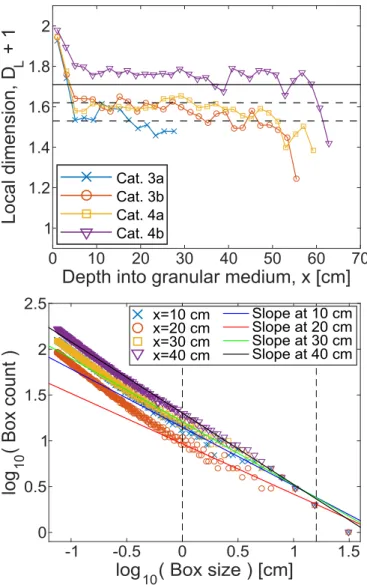
Figure 11 shows the local fractal dimensions DL as
function of depth into the granular medium. For all flow categories, the curves show a more or less constant be-havior over most of the depths (the initial high dimension is due to a larger initial area empty of beads, and the fi-nal lower dimension is due to finite size effects of the patterns), which indicates that the patterns have con-sistent local fractal dimensions over a range of x. The categories 3a,b and 4a patterns have typical local dimen-sions of 1.53, 1.58, 1.60, respectively. This is within the range of dimensions seen for viscous fingers in saturated porous media (D = 1.53 - 1.62), while for the category 4b patterns the local dimension is higher with a typical value of 1.76, which is closer to the dimensions seen for DLA clusters and viscous fingers in an empty saturated Hele-Shaw cell (D = 1.71).
D. Growth dynamics
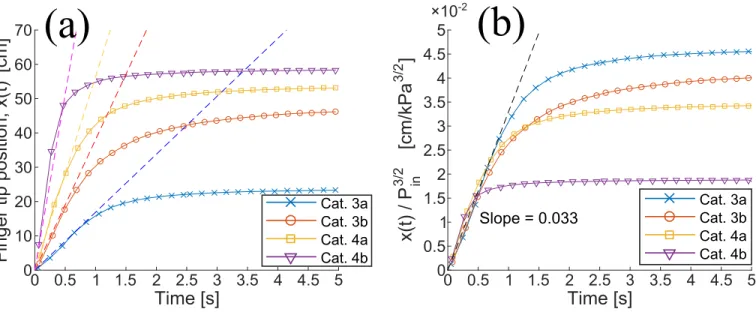
In figure 12 (a), the finger tip position averaged per category is plotted as function of time, which is found by recording the maximum depth of the patterns in the binary images at each snapshot. We see that for all ex-periments, the channel length grows linearly with time initially before it decelerates towards a final length, and that both the growth velocity and final depth of the in-vasion structures increase with increasing injection pres-sure. The initial constant growth rate seems to scale with the injection pressure as P32
in. In figure 12 (b), the finger
tip positions per category is divided by P32
into show that
they fall along the same line initially. In the simulations done by Niebling et al. [47, 55] of a similar, but smaller system they too observe an initial linear growth velocity crossing over to decay over time, however we here observe the initial growth velocity to scale with Pinas v ∝ P
3/2 in
instead of v ∝ Pin1/2 as found in these simulations. In figure 13 (a), the log-log plot of the finger tip velocity v(t)/(Pin3/2) as function of time indicates that when the finger tip velocity begins to decrease, it follows a power law equation with time, v(t) ∝ t−α, where α = 2.5 ± 0.2.
Timeb[s]
0 0.5 1 1.5 2 2.5 3 3.5 4 4.5 5Finger
btipbposition,bx(t)
b[cm]
0 10 20 30 40 50 60 70(a)
(b)
Cat.b3a Cat.b3b Cat.b4a Cat.b4b Cat.b3a Cat.b3b Cat.b4a Cat.b4b5
4.5
4
3.5
3
2.5
2
1.5
1
0.5
×10
-2FIG. 12. (a) The finger tip position x(t) as function of time, averaged for all experiments per category. The curves typically have an initial linear growth with time which crosses over to a decay with time. The patterns grow faster and longer for
increasing injection pressure, and the initial linear growth is found to scale proportionally with Pin3/2as indicated by the dashed
lines. (b) The finger tip positions x(t) divided by P 3 2
in, showing that the initial growth fall along the same line. The injection
pressures are Pin= 64, 110, 134 and 213 kPa, for category 3a,b and 4a,b respectively.
log
105(t),5Time5[s]
-1 -0.8 -0.6 -0.4 -0.2 0 0.2 0.4 0.6 0.8 1log
105(v(t)/P
in 3/2),5[cms
-1kPa
-3/2]
-5 -4.5 -4 -3.5 -3 -2.5 -2 -1.5 -1 -0.5 Slope5=5-2.5(a)
(b)
Cat.53a Cat.53b Cat.54a Cat.54b Cat.53a Cat.53b Cat.54a Cat.54bFIG. 13. (a) Log-log plot of the finger tip velocity v(t) as function of time, averaged per category. The data is collapsed along the ordinate axis by dividing v(t) by P
3 2
in, where Pin= 64, 110, 134 and 213 kPa, for category 3a,b and 4a,b respectively. The
initial constant plateau corresponds to the period with linear growth over time, which then crosses-over to a declining slope close to -2.5 (dashed line) for all the categories. The slopes show that the decay in growth velocity follows a power law equation
with time. (b) The curves of normalized finger tip velocity v(t∗)/v0 are collapsed along the time axis by scaling the time as
t∗ = t · (v0/xf) = R · (t/tc), where xf is the final channel length. The knee point of the curves, R ≈ 0.6, is marked by the
E. Scaled growth model
As we have shown in figures 12 and 13, the growth of the channel length is linear with time initially until it crosses over to decay towards a final channel length. More specifically, the growth velocity is constant initially, before it crosses over to a power law decay with time. The constant initial velocity v0is found to scale with injection
pressure Pinas v0= C · P 3 2 in, (7) where C ≈ 10−32 cm/(s·kPa 3
2) is found from the initial
part of the collapsed curves v(t)/P32
in along the ordinate
axis in figure 13 (a). By inserting the value for C into equation (7), we can instead collapse the curves along the ordinate axis with v(t)/v0resulting in dimensionless and
normalized units for the velocity. In order to collapse the curves along the time axis, we define a critical time t = tc
as the time when the growth velocity crosses over from being constant to follow a power law decay with time. At the critical time, the finger tip position can be described mathematically as
xc= x(tc) = v0· tc, (8)
which gives the relation
tc = xc v0 = xc C · P32 in (9)
for the critical time.
Since we can easily measure xf, the final length of the
channel, we check if xc can be described as a typical
fraction R of xf, such that xc= R · xf, which gives
tc = R · xf C · P 3 2 in = R ·xf v0 . (10) By plotting v(t∗)/v0 as function of t∗ = t · (v0/xf) =
R · (t/tc) in a log-log plot, we do indeed find that the
curves collapse along the time axis with a crossover point corresponding to R ≈ 0.6 (read from the knee point in figure 13 (b)). Since we now have the constants C and R, we can calculate v0 and tc for individual experiments
by inserting the respective Pinand xf into equations (7)
and (10). Figure 14 shows log-log plots of v0 = v(t0)/v0
as function of t0 = t/tc for individual experiments with
injection pressures in the range of 50 - 250 kPa, which follow the same dimensionless curve given by the function
fv(t0) =
(
1, if t0≤ 1
t0−α, if t0> 1, where α = 2.5. (11)
Similarly, we collapse the fingertip position x0 = x(t0)/xc and plot it as function of t0= t/tc for the same
individual experiments, also shown in figure 14 (Note that the data is from single experiments, i.e. not the average values as in figure 13, explaining the increased amount of noise). Here, the collapsed data follow the curve given by the function
fx(t0) = ( t0, if t0≤ 1 1 1−αt 01−α+ α α−1, if t 0> 1, (12)
which is obtained by integrating each part of equation (11), requiring that fx(t0> 1) → 1 when t0 → 1. Further,
fx(∞) = α/(α − 1) = xf/xc = 1/R, giving R = (α −
1)/α = 0.6, which fits very well with our observation in figure 13 (b). By substituting α into equation (10) we get, tc= α − 1 α · xf C · P32 in . (13)
With equations (7 - 13) we propose a description of the fundamental dynamics of the system. Since we have experimentally estimated α and equation (7) relating the initial growth velocity to injection pressure, we can es-timate the evolution of the channel length during the invasion for a given injection pressure and final channel length.
t'
0
5
10
15
x'
0
0.2
0.4
0.6
0.8
1
1.2
1.4
1.6
log
10t'
-1
-0.5
0
0.5
1
1.5
log
10v'
-2.5
-2
-1.5
-1
-0.5
0
0.5
50 kPa 100 kPa 150 kPa 200 kPa 250 kPa fx(t/tc) 50 kPa 100 kPa 150 kPa 200 kPa 250 kPa fv(t/tc)FIG. 14. Left: The collapsed finger tip positions x0 = x(t0)/v0· tc as function of t0 = t/tc, for individual experiments with
various injection pressure. The dotted vertical line indicates the cross-over at t0= 1, and the dashed curve shows the proposed
function fx(t0). Right: Log-log plot of the collapsed finger tip velocities v0 = v(t0)/v0 as function of t0 = t/tc for the same
individual experiments. The dotted vertical line indicates the cross-over at t0= 1, and the dashed curve shows the proposed
function fv(t0). Recall that the parameters used for the collapse are given by the injection pressure, as v0 = C · P
3 2 in and tc= ((α − 1)/α) · (xf/v0(Pin)), where C = 10− 3 2 cm/(s·kPa 3 2) and α = −2.5.
IV. DISCUSSION AND CONCLUSION
The channel formations seen in our experiments result in patterns very similar to other natural patterns aris-ing from Laplacian growth, e.g. DLA clusters, viscous fingers in empty Hele-Shaw cells, manganese dendrites, or lightning bolts. In such systems, ramified structures expand at a rate proportional to the gradient of a Lapla-cian (∇2φ = 0) potential field. This type of patterns is
in the DLA universality class, where a fractal dimension of D = 1.71 is expected [42, 46]. However, the fractal dimensions found for our patterns mainly take values of D ∈ [1.53 − 1.60], which is more similar to viscous fingers in porous Hele-Shaw cells [42, 46]. It has been estab-lished that flow in porous media is better described by another Laplacian model, i.e. the Dielectric Breakdown Model (DBM), where the interfacial growth rate is pro-portional to the pressure gradient of a power η higher than 1, i.e. v ∝ (∇P )η, where η = 2 for viscous fingers
in porous media [42, 46]. In our system the potential field is the overpressure in the medium, which diffuses into the medium initially (not Laplacian). However, nu-merical simulations show that the diffusing pressure field quickly approaches the Laplace solution outside finger tips (after 0.4-0.5 s), and in the entire cell on the order of a second [28]. In addition, we observe a feature of the channel growth which is typical for Laplacian growth sys-tems, i.e. there is an active growth zone outside a frozen structure, due to screening of the potential gradient by the most advanced parts of the structure.
The resulting channels in our experiments are
differ-ent than channels formed in similar systems having open outer boundaries, such as in [24–26]. In the open systems, the channels are generally much smoother and does not have more than 1-2 branches, while in the closed system we see ramified structures. This is thought to be a conse-quence of the outer boundary conditions which directly influence how the medium can be deformed. In both systems, the beads are compacted and pushed in front of the growing channel, but in the open system there is also a decompaction front moving inwards from the open outlet, easing the further displacement of beads. On the other hand, in the closed system, after the compaction front hits the outer boundary (which happens between t = 150 − 300 ms [28]) further deformation is more dif-ficult due to compaction. Thus, the local configuration of the pressure field on the tips could play a larger role on where the channels grow in this case. In addition, the overpressures imposed for channeling in our experiments (Pin = 40-250 kPa) are one order of magnitude larger
than the ones for these open systems (Pin= 2-20 kPa).
Although the cells in [24, 26] are smaller than ours, the one in [25] is of comparable dimensions.
The average fluid drag per unit area on the granular medium of height h is given by ∇P · h, and the average threshold for bead displacement is given by [25]
σyield= µ(1 − φ)ρgh = µρsρgh, (14)
where µ is the Coulomb friction coefficient, ρsis the solid
fraction of the granular medium, ρ is the density of the bead material, and g is the acceleration of gravity.
Equa-tion (14) is found by considering the weight and fricEqua-tion of the granular medium on the bottom plate while ne-glecting forces transmitted through solid contacts, i.e. in-plane stress and friction at the top plate, which is reasonable for the initial medium. Then, we have the requirement for bead displacement as
∇P · h ≥ σyield ⇒ ∇P ≥ µρsρg, (15)
which indicates that the pressure gradient necessary to deform the initial granular medium increases with the friction coefficient, solid fraction and the bulk density of beads. In a system where the injected fluid can be considered compressible (like air in our experiment), the overpressure diffuses into the medium with a diffusion constant [28, 47] D = κ (1 − ρs)cµf = d 2(1 − ρ s)2 180ρscµf , (16)
where κ is the permeability estimated with the Carman-Kozeny expression, d is the bead diameter, c is the fluid compressibility and µf is the fluid viscosity. By assuming
a solid fraction close to 0.5 for the initial medium, we see that the diffusivity of the overpressure is related to the bead size as
D ∼ d
2
cµf
. (17)
Thus, the bead size and cell length influence whether the fluid injection acts as a body force on the medium or more like a surface force on the air-solid interface, i.e. channels do not form with large enough beads or short enough cell because the effective range of the pres-sure gradient (skin depth) exceeds the system length, such that beads are primarily displaced by the fluid [47]. Smaller beads or longer cells lead to a more localized skin depth such that beads are primarily displaced through solid contacts (the zone of mobilized beads eventually exceeds the skin depth) and channels form.
Further, the cell length limits the maximum length of eventual channels formed [28] (longer cells accommodate longer channels). A wider cell leads to an increase in the average number of fingers [47], but not necessarily an in-crease in the finger width [25, 26]. However, the channels could become thicker with increased cell width for flow category 4b since a higher number of fingers could merge together. A decrease in cell gap has a similar effect as an increase in cell width, which leads to a higher number of fingers, and an increase in the cell gap above 2 mm usu-ally introduces 3D effects where the fluid tends to flow mostly in the top layer of the granular medium, and to displace grains preferentially there.
For the growth dynamics, the dependency of v0on Pin,
and the exponent α could be system dependent, i.e. the
InjectionmpressurebmP
inmymP
Catb1m[kPa]
0
50
100
150
200
250
Finalmcha
nnelmlen
gthbmx
fm[cm]
0
10
20
30
40
50
60
70
Individualmexperiments Averagempermpressure (PinmymPCatb1)0.68 xmaxbavg Cellmboundary 0.46 (PinmymPCatb1)FIG. 15. The final channel length xf is plotted as function
of Pin− Pcat,1, where Pcat,1= 9 kPa is the average injection
pressure for category 1, where xf = 0. We see that there
is a rather scattered (due to randomness in the initial bead configuration from experiment to experiment), but increasing
trend in xf for increasing Pin, but also that the final
chan-nel length for the highest injection pressures is limited by the
closed outer boundary. The fit (Pin− Pcat,1)0.68 was found
from the averaged xf per pressure for Pin∈ [20, 150] kPa and
suggest a power-law relationship. Alternatively, the linear fit
0.46 · (Pin− Pcat,1) fits equally well. The average limiting line
xmax,avgwas found by averaging xf over the experiments with
Pin ≥ 200 kPa, to indicate the influence of the cell
bound-ary. Thus, the results from our experiments indicate that xf
increase more or less proportionally with Pinuntil a limiting
length xmax,avg≈ 59 cm is reached due to the presence of the
outer boundary.
parameters could depend on e.g. bead size and confine-ment. Thus, it is of interest to investigate further how the dynamics are changing in various confined granular media, and see how the Eqs. (7 - 13) apply in those cases. The dependency of xf on Pinis also of interest to
inves-tigate further, such that if system dependent parameters are known, the expected result of an air injection could be estimated by the injection pressure alone. A brief dis-cussion of what we could find from our experiments is presented in figure 15. Another interesting feature found to be common for all experiments in the system is the typ-ical profile of the finger tips, corresponding to a growth in finger thickness w as function of distance d behind the tip as w ∝ dβ where β = 0.68 on average.
As shown in figure 11, the fractal dimension of the channels is found to be fairly stable along the main part of the structures, even for the thick fingers in category 4b. The local box-counting method indicates that when there is little or no erosion, as is the case for categories 3a,b and 4a, the final structures end up with typical fractal dimensions between D = 1.53 and 1.60. This range is similar to the one observed for viscous fingers in saturated porous media, i.e. D = 1.53 - 1.62,
sug-gesting that the channels formed in our experiments are in the DBM universality class of patterns where the in-terface expands at a rate proportional to (∇P )2. The
thicker category 4b structures have a fractal dimension of D = 1.76, which is closer to DLA-patterns and viscous fingering in empty saturated Hele-Shaw cells (D = 1.71). However, the higher fractal dimension is probably also an effect of box-counting inside the main channel which is rather space filling compared to the system size, and this makes the box-counting slopes for category 4b more un-certain than for thinner fingers. Furthermore, the global box-counting dimensions DB are slightly lower than the
locally estimated fractal dimensions, which could be a fi-nite size effect since less developed outer parts are also taken into account. However, for the most developed and best preserved channels (Cat. 3b and 4a), we find that DB = 1.53 and 1.54, which is still in good agreement with
the fractal dimensions for viscous fingers in porous me-dia. Finally, the fractal dimensions of the front is found to lie between DF = 1.41 and 1.52 for all categories. This
indicates that even if the structures themselves appear to change with increasing injection pressure, the roughness
of the air-solid interface seems to be more or less the same.
ACKNOWLEDGMENTS
This project has received funding from the Euro-pean Unions Seventh Framework Programme for re-search, technological development and demonstration un-der grant agreement no. 316889, ITN FlowTrans, from the University of Strasbourg through an ”Espoirs” grant, from the CNRS-INSU through an ”ALEAS” grant, and from the LIA France Norway D-FRACT. This work was partly supported by the Research Council of Nor-way through its Centres of Excellence funding scheme, project number 262644. We thank Alain Steyer and Miloud Talib for their technical support with experi-mental equipment. We would also like to thank Emily Brodsky, Daniel Koehn, Piotr Szymczak, Christine Put-nis, Ulrich Kelka, Stephen Centrella, Amir Sagy, Monem Ayaz, Anke Lindner, Harold Auradou, Bjørnar Sandnes and Øistein Johnsen for nice and fruitful discussions.
[1] S. S. Suthersan. Remediation Engineering: Design Con-cepts. Boca Raton, FL: CRC Press LLC, 1999. pp. 237-54.
[2] L. L. Goodroad and J. R. Schuring. Potential of pneu-matic fracturing to enhance in situ remediation technolo-gies. In: Waste Management 1994 Symposium. Tucson, AZ: WM SYMPOSIA, INC., 1994.
[3] S. Kazemian, B. B. K. Huat, A. Prasad, and M. Barghchi. A review of stabilization of soft soils by injection of
chem-ical grouting. Aust. J. Basic & Appl. Sci. 4(12), pp.
5862-68, 2010.
[4] R. Z. Moayed, E. Izadi, and M. Fazlavi. In-situ stress measurements by hydraulic fracturing method at gotvand dam site, iran. Turkish J. Eng. Env. Sci. 36, pp. 179-94, 2012. doi:10.3906/muh-1104-9.
[5] C. T. Montgomery and M. B. Smith. Hydraulic fractur-ing: history of an enduring technology. J. Pet. Technol. 62:2632, 2010. doi:10.2118/1210-0026-jpt.
[6] Department of Energy. Hydraulic fracturing whitepaper. EPA 816-R-04-003, Appendix A, 2004.
[7] G.C. Naik. Tight gas reservoirs - an unconventional
natural energy source for the future. Available online at: www.pinedaleonline.com/socioeconomic/pdfs/tight gas.pdf (Accessed 05, 2016), 2003.
[8] S. M. Johnson and J. P. Morris. Hydraulic fracturing
mechanisms in carbon sequestration applications. In:
43rd U.S. Rock Mechanics Symposium and 4th U.S.-Canada Rock Mechanics Symposium. Asheville, NC: American Rock Mechanics Association, 2009.
[9] W. H. Williamson and D. R. Wooley. Hydraulic Frac-turing to Improve the Yield of Bores in Fractured Rock. Canberra, ACT: Australian Government Publishing Ser-vice, 1980.
[10] F. Rummel and O. Kappelmayer. The falkenberg
geothermal frac-project: concepts and experimental
re-sults. Hydraul. Fract. Geotherm. Energy 5:5974, 1983. doi:10.1007/978-94-009-6884-4 4.
[11] Clark L. Energy company plans to frack
vol-cano. In: Wired Science. Available online at:
www.wired.com/wiredscience/2012/10/newberry-volcano-fracking (Accessed 05, 2016), 2012.
[12] A. Hurst, J. Cartwright, and Duranti D. Fluidization structures produced by upward injection of sand through a sealing lithology. In: Van Rensbergen P., Hillis R.R., Maltman A.J. and Morley C.K., editors. Subsurface Sed-iment Mobilization. London: Geological Society, Special Publications 216, pp. 123-38, 2003.
[13] H. Løseth, L. Wensaas, B. Arntsen, and M. Hovland. Gas and fluid injection triggering shallow mud mobiliza-tion in the hordaland group, north sea. In: Van Rensber-gen P., Hillis R.R., Maltman A.J. and Morley C.K., edi-tors. Subsurface Sediment Mobilization. London: Geolog-ical Society, Special Publications 216, pp. 139-57, 2003. [14] P. Van Rensbergen, J. Poort, R. Kipfer, M. De Batist,
M. Vanneste, J. Klerkx, and et al. Near-surface
sed-iment mobilization and methane venting in relation to hydrate destabilization in southern lake baikal, siberia. In: Van Rensbergen P., Hillis R.R., Maltman A.J. and Morley C.K., editors. Subsurface Sediment Mobilization. London: Geological Society, Special Publications 216, pp. 207-21, 2003.
[15] A. R. Talukder, M. C. Comas, and J. I. Soto. Pliocene to recent mud diapirism and related mudvolcanoes in the alboran sea(western mediterrenean). In: Van Rensber-gen P., Hillis R.R., Maltman A.J. and Morley C.K., edi-tors. Subsurface Sediment Mobilization. London: Geolog-ical Society, Special Publications 216, pp. 443-59, 2003.
[16] N. Pralle, M. K¨ulzer, and G. Gudehus. Experimental
evi-dence on the role of gas in sediment liquefaction and mud-volcanism. In: Van Rensbergen P., Hillis R.R., Maltman