Publisher’s version / Version de l'éditeur:
ASHRAE Transactions, 112, pt. 2, pp. 1-13, 2006-06-01
READ THESE TERMS AND CONDITIONS CAREFULLY BEFORE USING THIS WEBSITE. https://nrc-publications.canada.ca/eng/copyright
Vous avez des questions? Nous pouvons vous aider. Pour communiquer directement avec un auteur, consultez la
première page de la revue dans laquelle son article a été publié afin de trouver ses coordonnées. Si vous n’arrivez pas à les repérer, communiquez avec nous à [email protected].
Questions? Contact the NRC Publications Archive team at
[email protected]. If you wish to email the authors directly, please see the first page of the publication for their contact information.
Archives des publications du CNRC
This publication could be one of several versions: author’s original, accepted manuscript or the publisher’s version. / La version de cette publication peut être l’une des suivantes : la version prépublication de l’auteur, la version acceptée du manuscrit ou la version de l’éditeur.
Access and use of this website and the material on it are subject to the Terms and Conditions set forth at
A Thermal and moisture property database for common building and
insulation materials
Kumaran, M. K.
https://publications-cnrc.canada.ca/fra/droits
L’accès à ce site Web et l’utilisation de son contenu sont assujettis aux conditions présentées dans le site LISEZ CES CONDITIONS ATTENTIVEMENT AVANT D’UTILISER CE SITE WEB.
NRC Publications Record / Notice d'Archives des publications de CNRC:
https://nrc-publications.canada.ca/eng/view/object/?id=63105660-f433-4b32-a1e0-7c2df4372c94 https://publications-cnrc.canada.ca/fra/voir/objet/?id=63105660-f433-4b32-a1e0-7c2df4372c94
A Thermal and moisture property database for common
building and insulation materials
N R C C - 4 5 6 9 2
K u m a r a n , M . K .
A version of this document is published in / Une version de ce
document se trouve dans: ASHRAE Transactions, v. 112, pt. 2, June
2006, pp. 1-13
A Thermal and Moisture Property Database for Common
Building and Insulation Materials
Mavinkal K Kumaran, Ph. D.
Institute for Research in Construction National Research Council Canada Ottawa, Ontario K1A 0R6
Canada
Abstract:
An ASHRAE Research Project (RP-1018) that has been concluded at the Institute for Research in Construction, the National Research Council of Canada, has resulted in a unique database on many hygrothermal properties of many common building and insulation materials that are currently used in North America. The properties that are determined include thermal conductivity, equilibrium moisture content, water vapor transmission characteristics, water absorption coefficient, moisture diffusivity and airflow characteristics. The experimental and analytical procedures used in the research project are all based on either International Standards or on well-documented and peer-reviewed approaches. The materials that have been investigated in the project include: several wood-based products, such as oriented strand board, plywood, wood fiberboard and composite wood siding; masonry products, such as clay brick, mortar and aerated concrete; five species of lumber; cladding products, such as stucco, fiber cement board and the exterior coatings of EIFS systems; seven insulation products; six sheathing membranes; interior gypsum board, primer and a latex paint; a natural stone, a cement-based sheathing board and vinyl wallpaper.
This paper lists the basic information on all materials that are investigated. It also summarizes the principles of the experimental procedures. Illustrative examples of the information that have been generated in the research project are presented. Results from statistical analyses are highlighted.
A Thermal and Moisture Property Database for Common
Building and Insulation Materials
Mavinkal K Kumaran, Ph. D.
Institute for Research in Construction National Research Council Canada Ottawa, Ontario K1A 0R6
Canada
Introduction:
With the advent of high power personal computers, hygrothermal computer models have become powerful tools for building physicists and building practitioners alike. Significant advances were made during the past two decades in the development of hygrothermal models that are now useful in assessing the real time responses of building envelope assemblies to the variations in weather parameters and indoor environments. One major Task in the International Energy Agency Annex 24 (Hens 1996) evaluated many hygrothermal models with diverse capabilities from European and Scandinavian Countries and North America. More recent developments are documented in an ASTM Manual (Trechsel 2001). All these models require a set of very reliable inputs to yield meaningful results. Among these inputs include the properties of the building materials.
The information on material properties available in literature (Kumaran 1996; Trechsel 1994, 2001) is useful as a starting point in the application of hygrothermal models, but not adequate for various reasons. Building materials evolve continuously and the properties may change significantly. Another problem was that none of these previous works addressed all relevant hygrothermal properties of all products either. Usually the information is assembled from various sources. Even some of the most well planned works are incomplete and often become outdated.(Tveit 1966; Hansen 1986; Burch et al. 1992; Richards et al. 1992). Hence the need for a systematic investigation on the properties of all current building materials was recognized and ASHRAE Research Project 1018 was formulated in this context. The original scope of the project was to “generate a set of reliable and representative data on the hygrothermal properties of 25 common building materials”.
The project is now completed at the Institute for Research in Construction. This has resulted in detailed information on various hygrothermal properties of more than 35 building products. The properties that are determined include thermal conductivity, equilibrium moisture content, water vapor transmission characteristics, water absorption coefficient, moisture diffusivity and airflow characteristics. The experimental and analytical procedures used in the research project are all based on either International Standards or on well-documented and peer-reviewed approaches.
This paper lists the basic information on all products that are investigated. It also summarizes the principles of the experimental procedures. Illustrative examples of the information that have been generated in the research project are presented. Results from statistical analyses, albeit rather limited by the available information, are highlighted.
General Descriptions of the Building Products:
Relevant information on all the products included in the project is given below. The information includes the physical details of the products, as these are available in the market, bulk densities, thickness and if available details on the raw materials used in the manufacture. 1. Aerated Concrete: The test samples are taken from 1’ X 1’ X1.5’ blocks of the material.
The bulk density is (460 ± 15) kg m-3.
2. Interior Gypsum Board: This product is available as 4’ X 8’ boards at a nominal
thickness of ½”. A paper layer is adhered to the major surfaces. Labels on the product say the following: Manufactured to exceed standards Can/CSA-A82.27 and ASTM C 36. The bulk density is (625 ± 7) kg m-3.
3. Oriented Strand Board-1: This product is available as 4’ X 8’ boards at a nominal
thickness of ½”. The strands of this product are manufactured from poplar and aspen. The bulk density is (650 ± 30) kg m-3.
4. Oriented Strand Board-2: This product is available as 4’ X 8’ boards at a nominal
thickness of 3/8”. The strands of this product are manufactured from balsam, poplar and trembling aspen. The bulk density is (660 ± 30) kg m-3.
5. Oriented Strand Board-3: This product is available as 4’ X 8’ boards at a nominal
thickness of 7/16”. The strands of this product are manufactured from birch, poplar and aspen. The bulk density is (650 ± 30) kg m-3.
6. Plywood-1: This product is available as 4’ X 8’ boards at a nominal thickness of ¾”. It is certified as conforming to Canadian plywood manufacturing standard CSA O151 Canadian Softwood Plywood. The bulk density is (445 ± 5) kg m-3.
7. Plywood-2: This product is available as 4’ X 8’ boards at a nominal thickness of ½”. It is certified as conforming to Canadian plywood manufacturing standard CSA O121 Douglas Fir Plywood. The bulk density is (470 ± 5) kg m-3.
8. Plywood-3: This product is available as 4’ X 8’ boards at a nominal thickness of 5/8”. It is certified as conforming to Canadian plywood manufacturing standard CSA O121 Douglas Fir Plywood. The bulk density is (550 ± 5) kg m-3.
9. Woodfibre Board: This product is available as 4’ X 8’ boards at a nominal thickness of 7/16”. Both major surfaces are coated black(bituminous). The bulk density is (320 ± 10) kg m-3.
10. Eastern White Cedar: The specimens used for various tests are taken from 1”(nominal thickness) X 8” X 8’ planks. The bulk density is (360 ± 20) kg m-3.
11. Western Red Cedar: The specimens used for various tests are taken from 1”(nominal
thickness) X 8” X 8’ planks. The bulk density is (350 ± 20) kg m-3.
12. Spruce: The specimens used for various tests are taken from 1”(nominal thickness) X 8” X 8’ planks. The bulk density is (400 ± 50) kg m-3.
13. Eastern White Pine: The specimens used for various tests are taken from 1”(nominal thickness) X 8” X 8’ planks. The bulk density is (460 ± 60) kg m-3.
14. Southern Yellow Pine: The specimens used for various tests are taken from 1”(nominal thickness) X 8” X 8’ planks. The bulk density is (500 ± 40) kg m-3.
15. Composite Wood Siding: This product is available as 4’ X 8’ boards at a nominal
thickness of 7/16”. The material is made out of high-density woodfibre board and one major surface is coated with a paint at a fraction of a mm thickness. The bulk density is (740 ± 30) kg m-3.
16. Clay Brick: The brick is manufactured in Canada and is identified as Charleston Brick. Test specimens are prepared from a production batch of 72 mm X 78 mm X 250 mm bricks. The bricks are light reddish brown in colour and referred to as Extruded Clay Brick. The bulk density is (1980 ± 30) kg m-3.
17. Mortar: The mortar is from a masonry cement mortar mix, type N: 1 part by volume of masonry cement type N and 2¼ to 3 parts by volume of aggregate. The bulk density is (1600 ± 30) kg m-3.
18. Stucco: This is a regular Portland stucco mix. The bulk density is (1985 ± 30) kg m-3. 19. Fibre Cement: This product is available as 4’ X 8’ boards at a nominal thickness of 5/16”.
The bulk density is (1380 ± 40) kg m-3.
20. Cement Board: This product is available as 4’ X 8’ boards at a nominal thickness of ½”. This is used as an exterior sheathing member in EIFS type walls. The bulk density is (1130 ± 50) kg m-3.
21. Limestone: This product is called the Georgian Bay Limestone, available as slabs of various sizes. The bulk density is (2500 ± 100) kg m-3.
22. Low Density Glass Fibre Batt Insulation: Batt at a nominal thickness of 4”. The bulk density is (11.5 ± 1.5) kg m-3. The fibers are held together using a binder.
23. Cellulose Fibre Insulation: All test specimens are prepared from samples blown from a commercial cellulose insulation product as per the manufacturer’s direction. The product is prepared from recycled newspaper as the starting material using a dry fiberization technology. The fire retardant and fungicide are also applied as dry raw materials during the production process. The applied density of the insulation is (30 ± 4) kg m-3.
24. Expanded Polystyrene Insulation: This product meets CAN/ULC-S701-01 requirements for Type 1 expanded polystyrene insulation. The bulk density is (14.8 ± 0.2) kg m-3.
25. Extruded Polystyrene Insulation: A commercial product available as 4’ X 4’ boards at a nominal thickness of 4”. The product meets CAN/CGSB/ONGC: 51.20-M87 and is Type 4. The bulk density is (28.6 ± 0.2) kg m-3.
26. Sprayed Polyurethane Foam Insulation: Test specimens are taken from a 4’ X 4’
sample prepared using a commercial product by spraying three passes at a total thickness of 6”. The bulk density is (39 ± 2) kg m-3.
27. Polyisocyanurate Board Insulation: Test specimens are taken from a 4’ X 8’ board at a nominal thickness of 3”. The facers were removed from both major surfaces before specimens were prepared for all tests. The bulk density is (26.5 ± 0.2) kg m-3.
28. Low-Density Sprayed Polyurethane Foam Insulation: Test specimens are taken from
a 4’ X 4’ sample prepared using a commercial product sprayed at 8 to 10” height. The bulk density is 6.5 to 8.5 kg m-3.
29. #15 Felt: Mass per area is approximately 515 g m-2. The thickness is (0.72 ± 0.03) mm. 30. 10 Minute Paper: Mass per area is approximately 170 g m-2. The thickness is (0.20 ±
0.01) mm.
31. 30 Minute Paper: Mass per area is approximately 200 g m-2. The thickness is (0.22 ± 0.01) mm.
32. 60 Minute Paper: Mass per area is approximately 280 g m-2. The thickness is (0.34 ± 0.01) mm.
33. Spun Bonded Polyolefin: Mass per area is approximately 65 g m-2. The thickness is from 0.14 to 0.15 mm.
34. Spun Bonded Polyolefin with Crinkled Surface: Mass per area is approximately 67 g m-2. The thickness is about 0.1 mm.
35. Vinyl Wallpaper: Mass per area is approximately 170 g m-2. The thickness is (0.205 ± 0.008) mm.
36. Primer and Two Coats of a Latex Paint on Gypsum Board: Negligible thickness
change for the gypsum board due to the coatings.
37. EIFS Base & Finish Coats: The base coat is polymer cement and the finish coat is “Latex Acrylic”. The combined thickness is approximately 4.5 mm and bulk density is approximately 1140 kg m-3.
The properties reported include, thermal conductivity, sorption-desorption isotherms, water vapor permeance or permeability, moisture diffusivity, water absorption coefficient and air permeance or permeability. Attempts to measure liquid permeability directly were not successful, within the scope of the project. A method to evaluate this property
from the information on desorption isotherm and moisture diffusivity was documented in one of the project reports and values given for many of the products investigated here (NRC Report, 2000).
Principles of the Experimental Procedures:
Well-developed experimental procedures or international standard test procedures exist to determine the properties mentioned above. The principles of the experimental procedures that are used to determine the hygrothermal properties of building materials in the present investigation are given below. Heat capacity data that are listed in the final report (NRC Report 2002) are those taken from the International Energy Agency Annex 24 report (Kumaran 1996). Density data reported are the averages of the densities of many test specimens (conditioned to laboratory environment, approximately 21 °C and 50 % RH) for each material, calculated from direct measurements on the weight and on the geometric dimensions that are used to characterize each test specimen. Further details on each experimental procedure and data analyses may be found in the NRC Report No. B-1115.3 (1999).
Thermal Conductivity of Dry Materials
The heat conduction equation is directly used to determine the thermal conductivity of dry materials. Equipment that can maintain a known unidirectional steady state heat flux (under known constant boundary temperatures) across a flat slab of known thickness is used for the measurements. The most commonly used equipment is the guarded hot plate apparatus or the heat flow meter apparatus. ASTM Standards C 177, Standard Test Method for Steady-State Heat flux Measurements and Thermal Transmission Properties by Means of the Guarded-Hot-Plate Apparatus and C518, Standard Test Method for Steady-State Heat flux Measurements and Thermal Transmission Properties by Means of the Heat Flow Meter Apparatus are widely used for this purpose. The latter is used in the present investigation. Similar standards are available from the International Standards Organization and the European Union. In the ASTM Standards, the heat conduction equation is written for practical applications as:
λ = Q⋅l/(A⋅ΔT) (1)
Where,
Q = Heat flow rate across an area A l = Thickness of test specimen
ΔT = Hot surface temperature – Cold surface temperature
The thermal conductivity calculated according to (1) is called apparent thermal conductivity. It is a function of the average temperature of the test specimen.
Sorption/Desorption Isotherm
For sorption measurements, the test specimen is dried at an appropriate drying temperature to constant mass. While maintaining a constant temperature, the dried specimen is placed consecutively in a series of test environments, with relative humidity increasing in stages, until equilibrium is reached in each environment. Equilibrium in each environment is confirmed by periodically weighing the specimen until constant mass is reached. From the measured mass changes, the equilibrium moisture content at each test condition can be calculated and the adsorption isotherm drawn.
The starting point for the desorption measurements is from an equilibrium condition very near 100% RH. While maintaining a constant temperature, the specimen is placed consecutively in a series of test environments, with relative humidity decreasing in stages, until equilibrium is reached in each environment. Equilibrium in each environment is confirmed by periodically weighing the specimen until constant mass is reached. Finally, the specimen is dried at the appropriate temperature to constant mass. From the measured mass changes, the equilibrium moisture content at each test condition can be calculated and the desorption isotherm drawn.
A new CEN standard 89 N 337 E is under development for the determination of “Hygroscopic Sorption Curve.” ASTM standard C1498 addresses the same procedure.
Desorption Isotherm above 95 % RH from Pressure Plate Measurements:
The test specimens are saturated with water under vacuum. Those are then introduced in a pressure plate/membrane apparatus that can maintain pressures up to 100 bar for several days. The plates/membrane in perfect hygric contact with the specimens extract water out of the pore structure until an equilibrium state is established. The equilibrium values for moisture contents in the specimens and the corresponding pressures (measured as the excess over atmospheric pressure; the negative of this value is referred to as the pore pressure while the absolute value is the suction) are recorded. The equilibrium pressure, ph, can be converted to a
relative humidity, ϕ, using the following equation:
h
p
ρRT
M
ln
ϕ
=
−
(4) Where,M = the molar mass of water R = the ideal gas constant
T = the thermodynamic temperature and ρ = the density of water
A Nordtest Technical Report (Hansen 1998) briefly describes a procedure for pressure plate measurements and reports the results from an interlaboratory comparison. Measurements
done by five laboratories on Baumberger sandstone and Sander sandstone are listed in the report. The results are statistically analyzed and comments are made on the difficulty to assign uncertainties to the derived results. No standard procedure is yet developed for the pressure plate measurements.
Water Vapor Permeability/Permeance
The vapor diffusion equation is directly used to determine the water vapor permeability of building materials. The measurements are usually done under isothermal conditions. A test specimen of known area and thickness separates two environments that differ in relative humidity (RH). Then the rate of vapor flow across the specimen, under steady-state conditions (known RH’s as constant boundary conditions), is gravimetrically determined. From these data the water vapor permeability of the material is calculated as:
δp = Jv⋅l/(A⋅Δp) (2)
Where,
Jv = Water vapor flow rate across an area A
l = Thickness of the specimen
Δp = Difference in water vapor pressure across the specimen surfaces
Often, especially for membranes and composite materials, one calculates the water vapor permeance, δl , of a product at a given thickness from the above measurements as:
δl = Jv/(A⋅Δp) (3)
ASTM Standard E96, Test Methods for Water Vapor Transmission of Materials, prescribes two specific cases of this procedure- a dry cup method that gives the permeance or permeability at a mean RH of 25 % and a wet cup method that gives the permeance or permeability at a mean RH of 75 %. A new CEN Standard 89 N 336 E is being developed in the European Union based on ISO standard. More recently a number of technical papers that deal with various technical aspects, limitations and analyses of the experimental data of these procedures have appeared in the literature (Hansen and Lund 1990; Lackey et al. 1997; Kumaran 1998).
Water Absorption Coefficient:
One major surface of each test specimen is placed in contact with liquid water. The increase in mass as a result of moisture absorption is recorded as a function of time. Usually, during the initial part of the absorption process a plot of the mass increase against the square
root of time is linear. The slope of the line divided by the area of the surface in contact with water is the water absorption coefficient (Kumaran 1999)1.
A CEN Standard 89 N 370 E on the determination of water absorption coefficient is now available. The use of water absorption coefficient together with capillary saturation moisture content to derive information on an average moisture diffusivity for building products is explained in the Reference, Kumaran (1999).
Moisture Diffusivity:
Moisture diffusivity, Dw, defines the rate of movement of water, Jl , within a material,
induced by a water concentration gradient according to the following equation: Jl = - ρ
0
Dw grad u (5)
Where, ρ0
= density of the dry material
u = moisture content expressed as mass of water / dry mass of material
In the experimental procedure, liquid water in contact with one surface of a test specimen is allowed to diffuse into the specimen. The distribution of moisture within the specimen is determined as a function of time at various intervals until the moving moisture front advances to half of the specimen. Gamma spectroscopy is used as the experimental technique. The data are analyzed using the Boltzmann transformation (Bruce and Klute 1956, Kumaran et al. 1989, Marchand and Kumaran 1994) to derive the moisture diffusivity as a function of moisture content.
There is no standard test procedure for the determination of moisture diffusivity. There are many publications in the literature that describe the technical and experimental details (Marchand and Kumaran 1994, Descamps 1997, Pel 1995).
Air Permeability/ Permeance:
Test specimens with known areas and thickness are positioned to separate two regions that differ in air pressure and the airflow rate at a steady state and the pressure differential across the specimen are recorded. From these data the air permeability, ka is calculated as:
ka = Ja⋅l/(A⋅Δp) (6)
Where,
Ja = Air flow rate across an area A
l = Thickness of the specimen
Δp = Difference in air pressure across the specimen surfaces
1
Often, especially for membranes and composite materials, one calculates the air permeance, Ka , of a product at a given thickness from the above measurements as:
Ka = Ja/(A⋅Δp) (7)
ASTM Standard C 522, Standard Test Method for Airflow Resistance of Acoustical Materials prescribes a method based on this principle. Bomberg and Kumaran (1986) have extended the method for general application to building materials.
Comments on the uncertainty of the results:
From the description given above, it may be seen that the basic physical quantities that need to be measured in each of the test procedure are quantities such as mass, length, time, temperature, and voltage. At the Institute the instruments that are used to record these basic quantities are traceable to the Canadian National Standards. Mass can be measured within a milligram, length within a fraction of a millimeter, time differences within a second, temperature within a few centi-Kelvin and voltage within few micro-Volt. Other physical quantities such as relative humidity and air pressure are maintained and measured within few tenths of percentages. These are also traceable to the Canadian National Standards. But these high precisions that are attainable do not mean that the physical quantities measured are known within a few fractions of one per cent. The basic inhomogeneity of all building products introduces uncertainties in the derived hygrothermal properties that are far greater than the uncertainties in the measurements of the basic physical quantities. The magnitudes of these uncertainties depend on the building product under investigation. This aspect is clearly brought out in the final report of the ASHRAE Project 1018.
The measurements on one particular test specimen in a particular test method may yield the property for that specimen well within a percent. For example the water vapor transmission for one test specimen can be determined well within a percent, as is evident from the project report. But when all the measurements on all the test specimens used are combined to designate the water vapor permeability (or permeance) of the product, the uncertainty may be as large as 30 % (see for example the results on aerated concrete in this paper). If the product is reasonably homogeneous, such as a building membrane, the uncertainty may be less that 10 %. If results from more than one test laboratory are used to designate the property for a given product line the uncertainty may still increase.
Thus it is futile to say that such and such a test procedure can yield the corresponding material property within a given uncertainty. The result depends on the extent of inhomogeneity of the building product under investigation. Therefore in the final report of the project, wherever possible, the uncertainty of each listed material property is individually assigned for each material.
Illustrative Examples: Properties of Aerated Concrete:
Illustrative examples are given below to show the details that have been reported in the final project report. Primary data, test conditions, uncertainties of measurements and, wherever applicable, error analyses are documented in the report. Not all methods are applicable to all materials and often not all properties are relevant to all materials. Aerated concrete is one of the products that had gone through the entire sets of measurements. So it serves as a good example to demonstrate the details of all experimental and analytical results.
Thermal Conductivity:
Measurements are according to ASTM Standard C518; 30 cm X 30 cm specimens are used in these measurements. The temperatures of the plates are maintained within 0.02 °C for these measurements, for 12 h period to confirm steady state.
Table 1. Thermal Conductivity of Aerated Concrete. Specimen Thickness
mm
Hot Surface Temperature °C
Cold Surface Temperature °C
Conductivity W m-1 K-1
24.24 31.51 9.75 0.121
24.24 11.45 -2.44 0.119
Note: The heat flow meter apparatus is built to measure the heat transmission characteristics of insulating materials and for those materials the measurement uncertainties are within 2 %; aerated concrete is more conductive than traditional insulation and the large heat fluxes measured may give measurement uncertainties as high as 5 %.
Sorption – Desorption Measurements2:
Either eight specimens, 40 mm X 40 mm X 20 mm each or three specimens 40 mm X 40 mm X 6 mm each are used in these measurements; the numbers in parentheses indicate the
experimental uncertainties.
Table 2. Sorption data for Aerated Concrete.
RH, % Temperature, °C Moisture Content, kg kg-1
100, vacuum saturation Lab at 22 (1) 1.72(0.01), eight specimens
88.1 (1) 23.0 (0.1) 0.050 (0.002), three specimens
71.5 (1) 23.0 (0.1) 0.021 (0.001), three specimens
0.6 (1) 23.0 (0.1) 0.011 (0.001), three specimens
2
In the hygroscopic range, the measurements are done using the proposed procedure for ASTM Standard C1498, which in turn is based on CEN 89 N 337 E, “Hygroscopic Sorption Curve”; at the higher range the pressure plate method is used. Details of the pressure plate method are given by: Hansen, M. H., "Retention Curves Measured Using Pressure Plate and Pressure Membrane," Nordtest Technical Report 367, Danish Building Research Institute, 1998, p 63.
Table 3. Desorption data for Aerated Concrete.
RH, % Temperature, °C Moisture Content, kg kg-1
99.99 (0.01) Lab at 22 (1) 0.92 (0.13), eight specimens
99.98 (0.01) Lab at 22 (1) 0.81 (0.09), eight specimens
99.96 (0.01) Lab at 22 (1) 0.77 (0.07), eight specimens
99.93(0.01) Lab at 22 (1) 0.75 (0.06), eight specimens
99.85 (0.01) Lab at 22 (1) 0.72 (0.05), eight specimens
99.78(0.01) Lab at 22 (1) 0.70 (0.05), eight specimens
99.71 (0.01) Lab at 22 (1) 0.68 (0.04), eight specimens
99.47 (0.01) Lab at 22 (1) 0.64 (0.04), eight specimens
99.34(0.01) Lab at 22 (1) 0.61 (0.02), eight specimens
99.19(0.01) Lab at 22 (1) 0.57 (0.02), eight specimens
98.97(0.01) Lab at 22 (1) 0.54 (0.02), eight specimens
88.1 (1) 23.0 (0.1) 0.063 (0.001), three specimens
71.5 (1) 23.0 (0.1) 0.022 (0.001), three specimens
50.6 (1) 23.0 (0.1) 0.011 (0.001), three specimens
Water Vapor Transmission (WVT) Rate measurements3:
For each test condition, 3 circular specimens, each 15 cm in diameter, are used.
Table 4. Dry Cup Measurements on Aerated Concrete Specimens: The numbers in parentheses indicate the experimental uncertainties for RH and temperature and standard errors for WVT rate, obtained from statistical analyses of the data at a steady state.
Specimen Thickness mm Chamber RH % Chamber Temperature °C WVT Rate kg m-2 s-1 20.11 50.6 (1) 22.9 (0.1) 1.09E-06 (5.5E-09) 20.56 50.6 (1) 22.9 (0.1) 1.14E-06 (5.6E-09) 20.44 50.6 (1) 22.9 (0.1) 1.03E-06 (4.0E-09) 20.11 71.5 (1) 22.7 (0.1) 1.69E-06 (6.0E-09) 20.56 71.5 (1) 22.7 (0.1) 1.79E-06 (3.3E-09) 20.44 71.5 (1) 22.7 (0.1) 1.63E-06 (5.3E-09) 20.11 88.1 (1) 23.3 (0.1) 2.18E-06 (6.5E-09) 20.56 88.1 (1) 23.3 (0.1) 2.30E-06 (4.4E-09) 20.44 88.1 (1) 23.3 (0.1) 2.23E-06 (5.6E-09) 3
Measurements are done as described by: Lackey, J. C., Marchand, R. G., and Kumaran, M. K., “A Logical Extension of the ASTM Standard E96 to Determine the Dependence of Water Vapor Transmission on Relative Humidity,” Insulation Materials: Testing And Applications: Third Volume, ASTM STP 1320, R. S. Graves and R. R. Zarr, Eds, American Society for Testing and Materials, West Conshohocken, PA, 1997, pp 456-470.
Table 5. Wet Cup Measurements on Aerated Concrete Specimens: The numbers in parentheses indicate the experimental uncertainties for RH and temperature and standard errors for WVT rate, obtained from statistical analyses of the data at a steady state.
Specimen Thickness mm Chamber RH % Chamber Temperature °C WVT Rate kg m-2 s-1 20.29 71.7 (1) 22.7 (0.1) 1.30E-06 (1.7E-08) 20.34 71.7 (1) 22.7 (0.1) 1.40E-06 (1.4E-08) 20.11 71.7 (1) 22.7 (0.1) 1.49E-06 (1.5E-08) 20.29 87.8 (1) 23.2 (0.1) 1.13E-06 (1.5E-08) 20.34 87.8 (1) 23.2 (0.1) 9.60E-07 (1.0E.08) 20.11 87.8 (1) 23.2 (0.1) 9.69E-07 (1.0E.08)
The average thickness of still air in the cups in both series is 11 mm Derived Water Vapor Permeability4
From the data listed in Tables 4 and 5 one can derive the dependence of the water vapor permeability on relative humidity for this aerated concrete (Kumaran 1998). An example is given below.
Table 6. The dependence of water vapor permeability of Aerated Concrete on relative humidity. RH, % Permeability kg m-1 s-1 Pa-1 RH, % Permeability kg m-1 s-1 Pa-1 10 1.12E-11 60 2.76E-11 20 1.33E-11 70 3.34E-11 30 1.59E-11 80 4.07E-11 40 1.91E-11 90 5.00E-11 50 2.29E-11 100 6.21E-11
The relation between WVT rate and Chamber RH (Kumaran 1998) that is used for deriving the values in Table 6 is shown in Figure 1.
4
The analysis is done as for plywood described in : Kumaran, M. K., “An Alternative Procedure for the Analysis of Data from the Cup Method Measurements for Determination of Water Vapor Transmission Properties”, Journal of Testing and Evaluation, JTVEA, Vol. 26 , pp. 575-581, 1998.
Rank 1 Eqn 8002 [Exponential] y=a+bexp(-x/c)
r2=0.993 DF Adj r2=0.992 FitStdErr=1.17e-07 Fstat=965
a=-7.41e-07 b=7.54e-07 c=-61.21 0 20 40 60 80 100
CHAMBER RH, %
0 5e-07 1e-06 1.5e-06 2e-06 2.5e-06 3e-06 3.5e-06W V
T R
a
te
, k
g
m
-2s
-1Figure 1. All data are interpreted as dry cup measurements; RH inside the cup is “zero” and chamber RH is the RH outside the cup.
The numeric summary of the analyses is listed below. The commercial software package called TabbleCurve2 is used for the curve fit. The terminology below is from the package.
The equation5 that represents the relation between x = chamber RH and y = WVT rate is (Exponential) y = a + b exp(-x/c)
r2 , Coefficient of Determination = 0.993 Fit Std Error = 1.7E-07
F-value = 965
Parameter. Value Std Error t-value 90% Confidence Limits a -7.41e-07 2.1e-07 -3.5 -1.12e-06 -3.69e-07 b 7.54e-07 1.9e-07 4.0 4.23e-07 1.08e-06 c -61.2 7.5 -8.1 -74.5 -47.9
5
The WVT should continuously vary with the chamber RH within the range of 0 to 100 % RH. The reason for this may be found in Reference, Kumaran (1998)
From the above statistics, the estimated uncertainty in the derived value of the permeability may be up to 28 %.
One may find another mathematical expression to obtain a better fit to the experimental data than that is shown in Figure 1. For example, a cubic equation (such as y = a + bx + cx2 + dx3) gives apparently a better fit to the experimental data than that is given by the exponential equation in Figure 1. However, the first derivative of this “apparently better fit” results in excursions which in turn result in a decrease in the vapor permeability with increasing relative humidity, through certain range of RH values, below 50 % RH. It is difficult to explain such a dependency. Therefore, in the final report of ASHRAE RP-1018, the behavior of the first derivative of the mathematical expression was also taken into account before the mathematical expression was chosen for the derivation of the dependency of water vapor permeability of each material on RH. The first derivative of the exponential equation in Figure 1 is free from any excursions. The user of the raw data in Tables similar to 4 and 5 have the freedom to choose any analytical expression that best fits the experimental data, but must be cautious about the behavior of the first derivative.
Water Absorption Coefficient6:
Five test specimens, 5 cm X 5 cm X 5 cm each, were used in these measurements. Water is maintained at (22 ± 1) °C. The numbers in parentheses give the standard deviations.
Table 2.7. Water absorption data for Aerated Concrete. Square Root of time, s½ Water Absorption kg m-2 7.75 0.93 (0.13) 13.42 1.24 (0.17) 17.32 1.41 (0.21) 24.49 1.73 (0.25) 30.00 1.96 (0.29) 38.73 2.29 (0.34) 45.83 2.55 (0.37) 54.77 2.87 (0.44) 64.81 3.20 (0.47) 73.48 3.48 (0.53) 81.24 3.71 (0.56) 91.65 4.05 (0.62) 101.00 4.31 (0.69)
Linear regression using all the data from the first linear part of the absorption process for the five specimens gives:
Water Absorption Coefficient for the major surfaces = 0.036 ± 0.002 kg m-2 s-½.
6
The procedure used is based on: CEN/TC 89/WG 10 N95 – Determination of water absorption coefficient, 1994-07-07.
Moisture Diffusivity:
Gamma ray method (Kumaran and Bomberg 1985) is used to measure the distribution of moisture in three test specimens, 5 cm X 23 cm X 2.4 cm each, during the moisture uptake through the edge. The principle of the methodology is described by Kumaran et al. (1989). Marchand and Kumaran (1994) have reported the procedure used for the data reduction.
The running average method that is described by Marchand and Kumaran (1994) gives the characteristic curve shown in Figure 2, for this aerated concrete. Several hundreds of data pairs obtained on the three test specimens, in 36 sets of measurements over a period of seven days are included in the analysis.
0 50 100 150 200 250 300 0 0.0001 0.0002 0.0003 0.0004 0.0005 0.0006
Running Avg. Boltzmann Variable, m s-½
Running Avg. Moisture Content, kg m
-3
Figure 2. The characteristic curve for aerated concrete resulted from moisture uptake and distribution measurements.
The moisture diffusivity derived from the above characteristic curve is given in Table 8. Table 8. The dependence of moisture diffusivity of Aerated Concrete on moisture content.
Moisture Content kg kg-1 Diffusivity m2 s-1 Moisture Content kg kg-1 Diffusivity m2 s-1 0.087 8.72E-09 0.326 3.44E-09 0.109 5.47E-09 0.348 3.64E-09 0.130 4.32E-09 0.370 3.91E-09 0.152 3.76E-09 0.391 4.29E-09 0.174 3.44E-09 0.413 4.81E-09 0.196 3.26E-09 0.435 5.56E-09 0.217 3.16E-09 0.457 6.71E-09 0.239 3.12E-09 0.478 8.71E-09 0.261 3.13E-09 0.500 1.3E-08 0.283 3.19E-09 0.522 2.89E-08 0.304 3.29E-09 0.543 5.15E-08
The area enclosed by the characteristic curve in Figure 2 is ~ 0.033 kg m-2 s-½ and this value is very close to the water absorption coefficient = 0.036 kg m-2 s-½that was directly
determined. This should be the case and the correspondence between the two shows the internal consistency of the two methods. However, the uncertainty in the derived moisture diffusivity is estimated to be as high as 30 to 50 %.
The diffusivity derived from moisture distribution data during a water uptake process may not quantitatively describe a drying process for all building materials. However, earlier works at the Institute for Research in Construction show that for a cement-based sheathing board7 and for several OSB test specimens under various boundary conditions (Maref et al. 2002) the drying process is reasonably well described using the diffusivity that has been derived from a water uptake process.
For the present investigation, two series of drying experiments were conducted on this same aerated concrete. Both series of investigations suggest that the diffusivity determined from a “wetting process” describes the “drying process” with reasonable accuracy. Further details are given in the project final report8.
7
See Appendix I of the final project report.
8
Air Permeability:
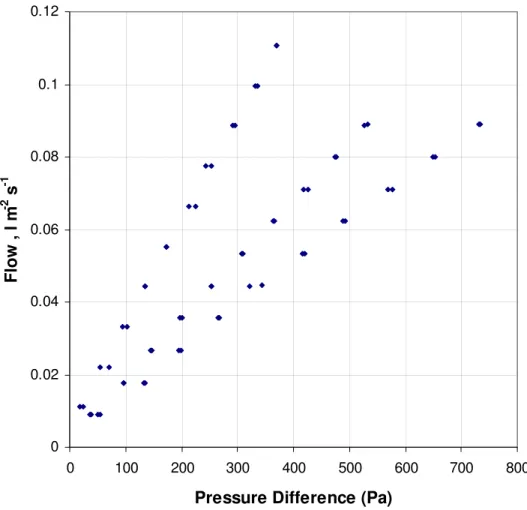
Bomberg and Kumaran (1986) have reported the principle of the method used in these measurements. Three circular test specimens (thickness 20.29 mm, 20.56 mm, 20.34 mm), each approximately 15 cm in diameter, are used in these measurements. The measurements are conducted at a temperature = (22 ± 1) ° C. All data obtained from two series of measurements on each specimen are shown in Figure 3.
0 0.02 0.04 0.06 0.08 0.1 0.12 0 100 200 300 400 500 600 700 800
Pressure Difference (Pa)
Flow , l m
-2 s
-1
Figure 3. The dependence of airflow rate on pressure difference for aerated concrete; as commented earlier, the material inhomogeneity results in three separate series of results on three separate test specimens. This in turn introduces more than 50 % uncertainty in the assigned air permeability of this aerated concrete.
For the range of pressure differences between 25 Pa and 700 Pa, the flow rate linearly varies with the pressure difference, for each test specimen. If each set is independently analyzed, the following three values are obtained for the air permeabilities:
4.2E-09 kg m-1 Pa-1 s-1 with a linear correlation coefficient equal to 0.997, 3.0E-09 kg m-1 Pa-1 s-1 with a linear correlation coefficient equal to 0.994 and 7.4E-09 kg m-1 Pa-1 s-1 with a linear correlation coefficient equal to 0.991.
The mean of these three values is 4.9E-09 kg m-1 Pa-1 s-1. From the deviation of each test specimen from this mean value, within a confidence interval of 95 % (this was the default value that was used for each of the three linear regressions), one may assign (4.9 ± 2.6) E-09 kg m-1 Pa-1 s-1 for the air permeability of this aerated concrete.
Outcome of ASHRAE Research Project 1018:
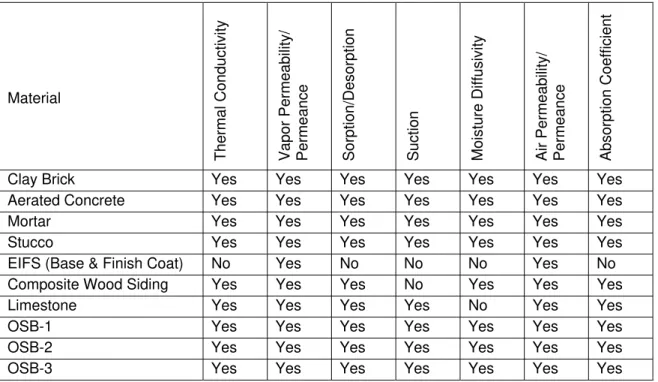
All applicable test procedures were applied to all the materials listed earlier. The summary of the information generated can be found in Table 9. A “yes” entry in any location in the table indicates the corresponding information has been generated and reported. A “no” entry indicates that the test method was not applicable. This may be due to lack of response or very slow response such that it was not practicable to generate the information. A vacant location indicates that the measurement was not planned in the project proposal.
Table 9. The Matrix to show the available information from ASHRAE RP-1018.
Material Therm al Co n ducti vity Vapor Pe rme ability/ Permea nce Sorption/ De sorption Suction Mois ture Diff us iv ity Air Permeability / Permea nce Abso rption Coefficient
Clay Brick Yes Yes Yes Yes Yes Yes Yes
Aerated Concrete Yes Yes Yes Yes Yes Yes Yes
Mortar Yes Yes Yes Yes Yes Yes Yes
Stucco Yes Yes Yes Yes Yes Yes Yes
EIFS (Base & Finish Coat) No Yes No No No Yes No
Composite Wood Siding Yes Yes Yes No Yes Yes Yes
Limestone Yes Yes Yes Yes No Yes Yes
OSB-1 Yes Yes Yes Yes Yes Yes Yes
OSB-2 Yes Yes Yes Yes Yes Yes Yes
Plywood-1 Yes Yes Yes Yes Yes Yes Yes
Plywood-2 Yes Yes Yes Yes Yes Yes Yes
Plywood-3 Yes Yes Yes Yes Yes Yes Yes
Woodfibre Board Yes Yes Yes Yes Yes Yes Yes
Fibrecement Board Yes Yes Yes Yes Yes Yes Yes
Cementitious Board Yes Yes Yes Yes Yes Yes Yes
Spun Bonded Polyolefin-1 Yes Yes Yes
Spun Bonded Polyolefin-2 Yes Yes Yes
#15 Felt Yes Yes Yes
10 min Paper Yes Yes Yes
30 min Paper Yes Yes Yes
60 min Paper Yes Yes Yes
Glassfibre Batts Yes Yes Yes Yes
Cellulose Fibre Yes Yes Yes Yes Yes
Expanded Polystyrene Yes Yes Yes Yes
Extruded Polystyrene Yes Yes Yes Yes
Spray polyurethane Yes Yes Yes Yes
Polyisocyanurate Yes Yes Yes Yes
Low Density Foam Yes Yes Yes Yes
Spruce Yes Yes Yes Yes Yes Yes Yes
Eastern White Pine Yes Yes Yes Yes Yes Yes Yes
Southern Yellow Pine Yes Yes Yes Yes Yes Yes Yes
Eastern White Cedar Yes Yes Yes Yes Yes Yes Yes
Western Red Cedar Yes Yes Yes Yes Yes Yes Yes
Interior Gypsum Yes Yes Yes No Yes Yes Yes
Vinyl Wall paper Yes Yes Yes
Primer Yes Yes Yes
Paint Yes Yes Yes
Concluding Remarks:
ASHRAE Research Project 1018 has now resulted in a set of information that building physicists were hoping to find readily available. These are documented in the project final report - “A Thermal and Moisture Transport Property Database for Common Building and Insulating Materials, Final Report from ASHRAE Research Project 1018-RP.” No. B-1115.13. Values for thermal conductivities, water vapor transmission properties, water absorption coefficients, moisture diffusivities from water uptake processes and airflow characteristics on all materials, if applicable, are uniquely determined for each test specimen that has been investigated in the project. The same cannot be said about the equilibrium moisture contents. The responses shown by most materials were rather slow and often equilibration took too long. The number of materials selected for the project for the equilibrium moisture content measurements was too high to be completed within the project life. So these measurements were not done to the same detail as originally had planned. Suction measurements using the pressure plate apparatus needs further
investigation, before it can be applied to all building materials. Depending on the starting point of saturation - vacuum saturation or capillary saturation through total submersion or capillary saturation on partial immersion - one may end up with slightly different equilibrium moisture content at each stage of the measurements. Efforts should be directed towards the development of an international standard to determine equilibrium moisture contents at very high relative humidities, close to saturation.
Attempts to directly measure liquid permeabilities are continuing at the Institute for Research in Construction. The experiments to date have proven to be rather tedious and time consuming. No conclusive results are yet available. It is desirable to determine liquid permeabilities of building materials directly. Efforts should also be directed to develop a standard procedure for that purpose.
Acknowledgements:
The planning, attention and dedication shown by Mr. John Lackey, Mrs. Nicole Normandin, Mr. Fitsum Tariku and Mr. David van Reenen during the course of this work are largely responsible for the success of this project. They jointly performed all the measurements reported here. The only exceptions are some of the measurements on aerated concrete that are chosen as illustrative examples in this paper. Mr. Xiaochuan Qiu performed some of those measurements under the supervision of either Mr. Lackey or Mrs. Normandin, while he was working at the Institute as a guest worker.
Financial support from ASHRAE for this project is gratefully acknowledged.
Nomenclature:
Symbol Physical quantity Unit
A area m2
Dw moisture diffusivity m
2
s-1
Ja airflow rate across an area, A kg m
-2
s-1
Jl liquid water flow rate across an area, A kg m
-2
s-1
Jv water vapor flow rate across an area, A kg m
-2
s-1
ka air permeability kg m
-1
Ka air permeance kg m -2
s-1 Pa-1
l thickness m
M molar mass kg mol-1
p air pressure or water vapor pressure Pa
ph equilibrium air pressure Pa
Q heat flow rate across an area, A W m-2
R ideal gas constant J mol-1 k-1
T temperature K
u moisture content kg kg-1
δp water vapor permeability kg m
-1
s-1 Pa-1
δl water vapor permeance for thickness, l kg m
-2
s-1 Pa-1 Δ difference in a physical quantity
λ thermal conductivity W m-1 K-1
ϕ relative humidity [-]
ρ density kg m-3
References:
Bomberg, M. T. and M. K. Kumaran. 1986. “A Test Method to Determine Airflow Resistance of Exterior Membranes and Sheathings.” Journal of Thermal Insulation. 9: 224-235.
Bruce, R. R. and A. Klute. 1956. “The Measurement of Soil Diffusivity.” Soil Science Society of
America Proceedings 20: 251-257.
Burch, D. M., W. C. Thomas, and A. H. Fanney. 1992. “Water Vapor Permeability Measurements of Common Building Materials.” ASHRAE Transactions 98 (2).
Descamps, F. 1997. “Continuum and Discrete Modelling of Isothermal Water and Air Transfer in Porous Media.” Ph. D. Thesis. K. U. –Leuven. 57-107.
Hansen, M. H. 1998. “Retention Curves Measured Using Pressure Plate and Pressure Membrane.” Nordtest Technical Report 367, Danish Building Research Institute, pp.63.
Hansen, K. K. 1986. “Sorption Isotherms, a Catalogue.” The Technical University of Denmark Technical Report 162/86
Hansen, K. K. and H. B. Lund. 1990. “Cup Method for Determination of Water Vapor Transmission Properties of Building Materials. Sources of Uncertainty in the Method.”.
Proceedings of the 2nd Symposium, Building Physics in Nordic Countries. 291-298.
Hens, H. 1996. “Heat, Air and Moisture Transport. Final Report, Vol 1, Task 1: Modelling.”
International Energy Agency Annex 24. Laboratorium Bouwfysica, K. U. –Leuven, Belgium.
Kumaran, M. K. 1996. “Heat, Air and Moisture Transport. Final Report, Vol 3, Task 3: Material Properties.” International Energy Agency Annex 24. Laboratorium Bouwfysica, K. U. –Leuven, Belgium.
Kumaran, M. K. 1998. “An Alternative Procedure for the Analysis of Data from the Cup Measurements for Determination of Water Vapor Transmission properties.” Journal of Testing
and Evaluation. 26: 575-581.
Kumaran, M. K. 1999. “Moisture Diffusivity of Building Materials from Water Absorption Measurements.” Journal of Thermal Envelope and Building Science. 22: 349-355.
Kumaran, M. K. and Bomberg, M. T. 1985. “A Gamma-spectrometer for Determination of Density Distribution and Moisture Distribution in Building Materials.” Moisture and Humidity:
Measurements and Control in Science and Industry: Proceedings of International Symposium.
Kumaran. M. K., G. P. Mitalas, R. Kohonen and T. Ojanen. 1989. “Moisture Transport Coefficient of Pine from Gamma Ray Measurements.” Collected Papers in Heat Transfer, ASME Heat
Transfer Division. 123: 179-183.
Lackey. J. C., R. G. Marchand, and M. K. Kumaran. 1997. “A Logical Extension of the ASTM Standard E96 to Determine the Dependence of Water Vapor Transmission on Relative Humidity.”
ASTM STP 1320, Insulation Materials: Testing and Applications. 3: 456-470.
Marchand, R. G. and M. K. Kumaran. 1994. “Moisture Diffusivity of Cellulose Insulation.” Journal
of Thermal Insulation and Building Envelopes. 17: 362-37.
Maref, W., M. K. Kumaran, M. A. Lacasse, M. C. Swinton, and D. van Reenen. 2002. “Laboratory Measurement and Benchmarking of an Advanced Hygrothermal Model.” Proceedings of the 12th International Heat Transfer Conference, Grenoble, France, pp. 117-122.
NRC Canada Client Report to ASHRAE. 1999. “A Thermal and Moisture Transport Property Database for Common Building and Insulating Materials – 1018-RP.” No. B-1115.3
NRC Canada Client Report to ASHRAE. 2000. “A Thermal and Moisture Transport Property Database for Common Building and Insulating Materials – 1018-RP.” No. B-1115.9
NRC Canada Client Report. 2002. “A Thermal and Moisture Transport Property Database for Common Building and Insulating Materials, Final Report from ASHRAE Research Project 1018-RP.” No. B-1115.13
Pel, L. 1995. “Moisture Transport in Porous building Materials.” Ph. D. Thesis. Eindhoven University of Technology, the Netherlands. 47-80.
Richards, R. F., D. M. Burch, and W. C. Thomas. 1992. “Water Vapor Sorption Measurements of Common Building Materials.” ASHRAE Transactions 98 (2).
Tveit, A. 1966. “Measurements of Moisture Sorption and Moisture Permeability of Porous Materials.” Norwegian Building Research Institute, Report 45.
Trechsel, H. R. Editor. 1994. “Manual on Moisture Control in Buildings.” ASTM Manual Series: MNL 18. 35-53.
Trechsel, H. R. Editor. 2001. “Moisture Analysis and Condensation Control in Building Envelopes.” ASTM Manual Series: MNL 40. 29-65 and 161-183.