HAL Id: hal-02514761
https://hal.archives-ouvertes.fr/hal-02514761
Submitted on 22 Mar 2020
HAL is a multi-disciplinary open access
archive for the deposit and dissemination of
sci-entific research documents, whether they are
pub-lished or not. The documents may come from
teaching and research institutions in France or
abroad, or from public or private research centers.
L’archive ouverte pluridisciplinaire HAL, est
destinée au dépôt et à la diffusion de documents
scientifiques de niveau recherche, publiés ou non,
émanant des établissements d’enseignement et de
recherche français ou étrangers, des laboratoires
publics ou privés.
FAST FREQUENCY MODEL OF OVERVOLTAGE IN
ADJUSTABLE SPEED DRIVES: SiC TECHNOLOGY
VS. IGBT TECHNOLOGY
Bouazza Taghia, Hubert Piquet, David Malec, Jean-Pierre Carayon, Antoine
Belinger
To cite this version:
Bouazza Taghia, Hubert Piquet, David Malec, Jean-Pierre Carayon, Antoine Belinger. FAST
FRE-QUENCY MODEL OF OVERVOLTAGE IN ADJUSTABLE SPEED DRIVES: SiC TECHNOLOGY
VS. IGBT TECHNOLOGY. Symposium on Electromagnetic Phenomena in Nonlinear Circuits, Jun
2018, Arras, France. �hal-02514761�
FAST FREQUENCY MODEL OF OVERVOLTAGE IN ADJUSTABLE SPEED
DRIVES: SiC TECHNOLOGY VS. IGBT TECHNOLOGY
Bouazza TAGHIA*,**, Hubert PIQUET**, David MALEC**,Jean-Pierre CARAYON*, Antoine BELINGER**
*Institute of Technology Antoine de Saint Exupéry, More Electrical Aircraft Department CS34436, 3 Rue Tarfaya, 31400, Toulouse, France, e-mail: [email protected]
**Laboratoire Plasma et Conversion d’Energie, Université de Toulouse, CNRS 2 rue Camichel – 31071, Toulouse, France, e-mail: [email protected]
Abstract -The use of fast semiconductor components such as IGBT and SiC in Adjustable Speed Drives (ASD) increases power density and provides better controllability. Nevertheless, secondary effects such as overvoltage at the motor terminals appear and can affect the reliability of the Electrical Insulation System (EIS). The overvoltage is due to the propagation and reflection phenomena along the harness. In this paper, we propose a fast frequency model to simulate motor overvoltage. Their maximum level is studied according to the following parameters: inverter dv/dt, harness length and motor impedance.
I. INTRODUCTION
The Adjustable Speed Drives (ASD) aboard more electrical aircraft (MEA) are currently fed by fast switching (60ns) PWM IGBT converters. To improve the converters power density, the very fast (20ns) Wide Bandgap semiconductor technologies (Silicon Carbide) are currently under evaluation. The voltage level aboard new aircraft generations has grown from 270Vdc to 540Vdc. Using fast inverters in ASD with long harness and fed by the new HVDC network 540V favours generation of high overvoltage level at the motor terminals (>1000V).
In this paper, we propose a fast and accurate frequency model to evaluate the ASD high frequency behaviours, in particular, the overvoltage at the motor terminals.
II. FREQUENCY MODELLING
We assume that the inverter modulator only switches one leg inverter at a time. Then, for the case of a three-phase inverter with three legs, there are always two parallel legs of the inverter in steady state (red and blue phases on Fig. 2) with a third leg (the yellow phase) that is switched [1]. In this paper, we focus only on the phase-to-phase overvoltage, also called differential mode voltage.
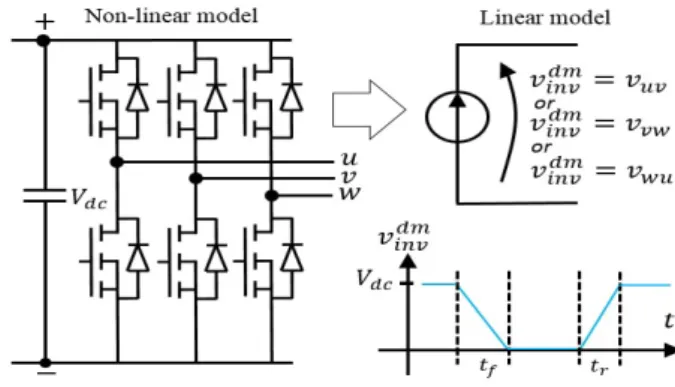
A. Inverter
The inverter is a strongly nonlinear device. A rigorous study of its commutations is usually ensured by time-domain circuit solver such as SPICE. Unfortunately, this approach takes a lot of calculation time and sometimes encounters convergence problems.
In order to linearize the inverter model, we assume that its dynamic behaviour is independent of its load (harness and motor). Therefore, the inverter can be represented by a perfect voltage source with trapezoidal waveforms (Fig. 1).
The inverter switching is characterised by the dv/dt (rise time: tr and fall time: tf). The ringing phenomena caused by inverters parasitic elements could be taking in an account as explained in [2].
Fig. 1. Differential mode equivalent linear model of three-phase inverter
B. Harness
In the frequency domain, the propagation of voltage and current along the harness can be described by an exact solution of telegrapher’s equations[3]. The harness usually is symmetrical and reciprocal device, this allows to easily establish an equivalent T circuit model (Fig. 2). The T circuit parameters are calculated from the per-unit harness primary parameter RLCG as detailed in[2]. This modelling takes easily into account losses and frequency dispersion.
Fig. 2 Frequency exact T circuit of CF-AWG18 based harness.
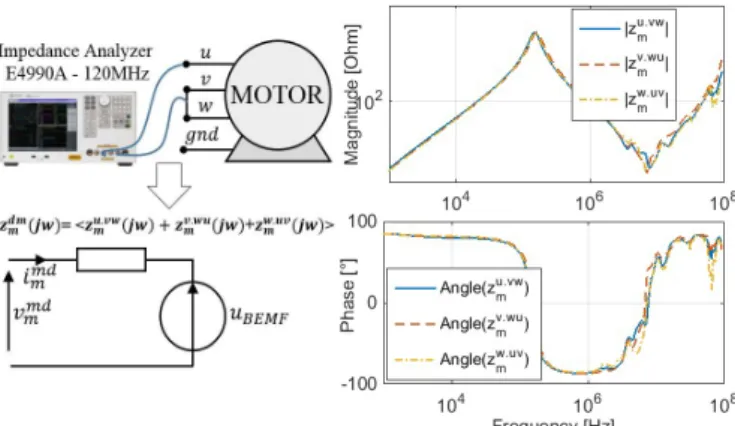
C. Motor
To rigorously study the impact of motor impedance on overvoltage, we performed a differential mode impedance measurement using a 120 MHz impedance analyzer (Fig. 3). It is common to use Vector-Fitting technique to look for a causal, stable and passive equivalent circuit in order to make simulations in circuit solvers[4], which is far to be an easy task. With our proposed frequency approach, we can directly use the measured impedance, or eventually after a simple smoothing.
D. Overvoltage simulation methodology
Given the circuit modelling composed of different parts explained in (Fig. 1, Fig. 2 and Fig. 3), we establish an analytical transfer function of differential mode motor voltage (equation.1).
Fig. 3. Wide band frequency model of 15kW permanent magnet motor.
𝑣 (𝑗𝑤) (inverter’s voltage) and 𝑢 (𝑗𝑤) (motor’s back emf) are obtained by applying the FFT on their temporal measurements. After calculation of 𝑣 (𝑗𝑤) in the frequency domain, the iFFT is used to return to time domain and directly describes the steady state response. The calculation time is extremely short: less than 50ms by using a Core i5 5300U - 8 GB RAM personal computer (simulation use the inverter voltage waveform of Fig. 1 with switching frequency of 30kHz and sampling frequency of 1GHz). Indeed, the mathematical formulation is linear, so the spectrum components are decoupled and the calculation is not iterative.
III. OVERVOLTAGE PARAMETRIC STUDIES Fig. 4 gives an overvoltage at motor terminal generated by 8kV/µs inverter fed 15kW motor through 2m, 15m and 30m harnesses. The simulation use parameters shown in Fig. 2 (harness) and Fig. 3 (motor). It shows an expected result: the maximal overvoltage value increases according to cable length. Note also that the dv/dt value decreases according to the harness length, for 15m, it is equal to 2.5kV/μs compared to that of the inverter, which is equal to 8kV/μs.
Fig. 4. Simulated overvoltage at motor terminals with dv/dt=8kV/µs for three harness length : 2m, 15m and 30m.
Nevertheless, the critical length from which the overvoltage is approximately equal to 2*Vdc is found to be greater than 30m, whilst the expected value is around 8m[5]. One reason for this difference is the fact that the usual machine impedance model used in literature for this purpose neglects the frequency dependence and is assumed constant and real [5].
To study the impact of the motor impedance on overvoltage at its terminals, we simulate and plot the maximal motor voltage according to the harness length. Two dv/dt are considered, an IGBT dv/dt: 8kV/µs and a SiC dv/dt: 40kV/µs. Concerning the motor impedance, two cases are simulated: infinite impedance and the measured impedance of Fig. 3.
Fig. 5 shows the results of this overvoltage parametric study. The overvoltage obtained by neglecting the motor impedance (> 5000 Ohm) are similar to those proposed in the literature [5][6]. The harness critical length of IGBT switching is around 8m and that of the SiC switching is around 2m. Taking into account the motor impedance masks the glaring difference of 500V between SiC overvoltage and the IGBT overvoltage. When considering the motor impedance, the gap of overvoltage between the two technologies is around 50V. In addition, the critical harness lengths are the same for the both switching speeds. It is relatively high and equal to 48m.
Some additional experimental investigations not presented in this paper confirm those overvoltage trends according to the motor impedance.
Fig. 5. Motor overvoltage as function of dv/dt and harness length, with and without the motor impedance
IV. CONCLUSION
In this paper, we proposed an original, very simple and very fast frequency model to simulate overvoltage phenomena in ASD. An analytical formula is established taking into account inverter, harness and motor characteristics. Thanks to the circuit representation, hardware and/or software mitigation technique could be easily evaluated.
The overvoltage parametric study shows that the motor terminals voltage dv/dt decreases according to the harness length. It shows especially the important influence of the motor impedance on overvoltage. In our studied case, there is just a gap of 50V between overvoltage generated by SiC-40kV/µs technology and that generated by IGBT-8kV/µs technology.
REFERENCES
[1] G. Skibinski, R. Kerkman, D. Leggate, J. Pankau, and D. Schlegel, “Reflected wave modeling techniques for PWM AC motor drives,” APEC ’98 Thirteen. Annu. Appl. Power Electron. Conf. Expo., vol. 2, pp. 1021–1029, 1998.
[2] B. TAGHIA, B. COUGO, H. PIQUET, D. MALEC, A. BELINGER, and J. P. CARAYON, “Overvoltage at motor terminals in SiC-based PWM drives (in reviewing process),” Elsevier Editor. Syst. Math. Comput. Simul., 2018.
[3] C. R. Paul, Analysis of multiconductor transmission lines, 2nd ed. 2008.
[4] B. Gustavsen and A. Semlyen, “Rational approximation of frequency domain responses by vector fitting,” IEEE Trans. Power Deliv., vol. 14, no. 3, pp. 1052–1061, Jul. 1999.
[5] IEC/TS 61800-8, Adjustable speed electrical power drive systems - Part 8 : Specification of voltage on the power interface. 2010. [6] E. Persson, “Transient effects in application of PWM inverters to
induction motors,” IEEE Trans. Ind. Appl., vol. 28, no. 5, pp. 1095–1101, 1992.