Distinct EMT programs control normal
mammary stem cells and tumour-initiating cells
The MIT Faculty has made this article openly available.
Please share
how this access benefits you. Your story matters.
Citation
Ye, Xin, Wai Leong Tam, Tsukasa Shibue, Yasemin Kaygusuz, Ferenc
Reinhardt, Elinor Ng Eaton, and Robert A. Weinberg. “Distinct EMT
Programs Control Normal Mammary Stem Cells and
Tumour-Initiating Cells.” Nature 525, no. 7568 (September 2015): 256–260.
As Published
http://dx.doi.org/10.1038/NATURE14897
Publisher
Springer Nature
Version
Author's final manuscript
Citable link
http://hdl.handle.net/1721.1/116979
Terms of Use
Article is made available in accordance with the publisher's
policy and may be subject to US copyright law. Please refer to the
publisher's site for terms of use.
Distinct EMT programs control normal mammary stem cells and
tumour-initiating cells
Xin Ye1,*, Wai Leong Tam1,4, Tsukasa Shibue1, Yasemin Kaygusuz1, Ferenc Reinhardt1,
Elinor Eaton1, and Robert A. Weinberg1,2,3,*
1Whitehead Institute for Biomedical Research, Cambridge, MA 02142, USA
2Department of Biology, Massachusetts Institute of Technology, Cambridge, MA 02139, USA 3Ludwig Center for Molecular Oncology, Massachusetts Institute of Technology, Cambridge, MA
02139, USA
Abstract
Tumour-initiating cells (TICs) are responsible for metastatic dissemination and clinical relapse in a variety of cancers1,2. Analogies between TICs and normal tissue stem cells have led to the notion that activation of the normal stem-cell program within a tissue serves as the major mechanism for generating TICs3-7. Supporting this notion, we and others previously established that the Slug EMT-TF (EMT-inducing transcription factor), a member of the Snail family, is a master regulator of the gland-reconstituting activity of normal mammary stem cells (MaSCs), and that forced expression of Slug in collaboration with Sox9 in breast cancer cells can efficiently induce entrance into the TIC state8. However, these earlier studies focused on xenograft models with cultured cell lines and involved ectopic expression of EMT-TFs, often at non-physiological levels. Using genetically engineered knock-in reporter mouse lines, here we show that normal gland-reconstituting MaSCs9-11 residing in the basal layer of the mammary epithelium and breast TICs originating in the luminal layer exploit the paralogous EMT-TFs Slug and Snail respectively, which induce in turn distinct EMT programs. Broadly, our findings suggest that the seemingly similar stem-cell programs operating in TICs and normal stem cells of the corresponding normal tissue are likely to differ significantly in their details.
To define the functions of endogenously encoded, physiologically regulated Snail family EMT-TFs in breast cancer pathogenesis in vivo, we generated knock-in IRES (internal
Reprints and permissions information are available at www.nature.com/reprints.
*Correspondence: [email protected] (X. Y.), [email protected] (R.A.W.).
4Present address: Genome Institute of Singapore, 60 Biopolis Street Singapore 138672, Singapore; Cancer Science Institute of Singapore, 14 Medical Drive, Singapore
Author contributions:
X.Y. and R.A.W. conceived the project and prepared the manuscript. X.Y. designed and performed the experiments and analyzed the data. W.L.T. contributed to the ChIP-seq experiments. T.S. generated the knock-in animals. Y.K. performed experiments and quantifications. F.R. performed the mammary fat pad injections. E.E. provided technical support.
Author information:
The ChIP-seq results have been deposited to Gene Expression Omnibus (GEO) under accession number GSE61198.
HHS Public Access
Author manuscript
Nature. Author manuscript; available in PMC 2016 March 10.
Published in final edited form as:
Nature. 2015 September 10; 525(7568): 256–260. doi:10.1038/nature14897.
Author Manuscript
Author Manuscript
Author Manuscript
ribosomal entry site)-YFP (yellow fluorescent protein) reporters for Slug and Snail (Fig. 1a, b). These knock-in reporters faithfully reflected the expression of the endogenous genes (Extended Data Fig. 1a, b), and enabled the isolation of Slug+ or Snail+ cells by
fluorescence-activated cell sorting (FACS) (Extended Data Fig. 6e-h).
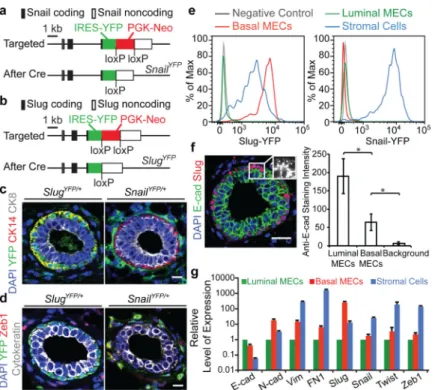
Using these reporters, we found that Slug was expressed at higher levels in the normal MaSC-enriched basal mammary epithelial cells (MECs) compared to the stromal fibroblasts surrounding the mammary ducts. In contrast, the EMT-TFs Snail, Twist and Zeb1 were expressed in stromal fibroblasts but not in either basal or luminal MECs (Fig. 1c-e, Extended Data Fig. 1c-f). In addition to the differential expression of EMT-TFs, the MaSC-enriched basal MECs displayed intermediate expression levels of both epithelial and mesenchymal markers (Fig. 1f, g, Extended Data Fig. 1g). Hence, Slug expression in the normal basal MECs was associated with only a partial conversion to the mesenchymal state. Given the differential expression patterns of Slug and Snail, we undertook to analyze their expression during tumour development using the MMTV-PyMT transgenic model of mammary tumour formation, which mirrors the multi-step progression of human breast cancers beginning from hyperplastic lesions to high-grade carcinomas that spontaneously metastasize to the lungs12. In the initially formed hyperplastic lesions, we noted a marked
reduction of Slug-YFP+ cells relative to normal mammary glands, contrary to the hypothesis
that activation of the Slug EMT-TF might be the preferred mechanism to generate TICs. These Slug-YFP+ cells were cytokeratin14+ (CK14) (Fig. 2a, Extended Data Fig. 2f),
indicating Slug expression was still confined to cells of the basal lineage, as was the case within the normal ducts. In these early-stage lesions, we detected for the first time Snail-YFP expression in a small fraction of the neoplastic cells displaying CK8+Slug−Zeb1−
luminal characteristics (Fig. 2a, b, Extended Data Fig. 2a-c).
As these early-stage tumours progressed to high-grade carcinomas, the Slug+ cells remained
largely confined to the basal sectors of each epithelial island, whereas the Snail+ cancer cells
were sometimes fully detached from the epithelial islands and exhibited an elongated mesenchymal morphology (Fig. 2c). We found that virtually all Snail-YFP+ tumour cells
had lost E-cadherin and activated expression of the Zeb1 EMT-TF; in contrast, the majority of Slug-YFP+ tumour cells retained junctional E-cadherin and lacked Zeb1 expression (Fig.
2c, d, Extended Data Fig. 2d). Therefore, Snail rather than Slug is associated with more complete expression of mesenchymal traits in mammary tumours.
Interestingly, as tumours progressed, we noted that the Snail-YFP+ cells gradually acquired
basal CK14 expression and lost luminal CK8 expression (Fig. 2e, Extended Data Fig. 2c, e), echoing the proposal that in human breast carcinomas, aggressive cancer cells exhibiting basal features can actually arise from luminal precursors13-17. To compare the activation of
Slug and Snail during such luminal-basal transitions, we utilized a organoid culture system, in which CK14 is spontaneously activated as the tumour cells invade into a type I collagen gel13. We dissociated adenocarcinomas into tumour organoids as previously described13.
These freshly isolated tumour organoids were almost exclusively of luminal phenotype (CK8+CK14−) and lacked both Slug-YFP and Snail-YFP expression (Extended Data Fig.
3a). After 48h in culture, CK14 expression was induced in tumour cells at the invasive fronts
Author Manuscript
Author Manuscript
Author Manuscript
of these organoids. Strikingly, this induction was tightly associated with Snail-YFP but not Slug-YFP activation (Fig. 2f, Extended Data Fig. 3b, c).
Taken together, these analyses indicate that the EMT-TF that is activated in the MMTV-PyMT mammary tumours (i.e., Snail) is distinct from the one expressed in the normal gland-reconstituting MaSCs (i.e., Slug); and that expression of Snail rather than its paralogue Slug is associated with potent EMT activation and eventual acquisition of basal features
(Extended Data Fig. 3d).
To further extend and generalize these observations, we compared Slug, Snail and Zeb1 expression patterns in the MMTV-Neu18 and BRCA1/p53-minus19 transgenic models of breast cancer development. Snail activation had previously been associated with recurrence and metastasis formation in the MMTV-Neu model20,21. Consistently, we found that Snail and Zeb1 are activated in ~1-2% of tumour cells within MMTVNeu tumours that are associated with metastatic disease, which contained no evidence of Slug activation
(Extended Data Fig. 4a-c). The BRCA1/p53-minus tumours were highly heterogeneous and harbored areas with epithelial and glandular phenotypes as well as areas with mesenchymal and invasive phenotypes (Extended Data Fig. 4 d, g). We found that Slug was predominantly expressed by cells occupying the basal sectors of the gland-like structures (echoing its expression in normal ducts), whereas Snail and Zeb1 were predominantly expressed in the invasive cells (Extended Data Fig. 4 d-h). Hence, differential expression of Slug and Snail appears to be a conserved feature of mammary tumours driven by diverse oncogenic signals. We were curious whether differential expression of SLUG and SNAIL was also observable in human breast cancer cells and therefore surveyed SLUG versus SNAIL expression in human breast cancer cell lines. Mirroring our observations in the mouse models, SNAIL but not SLUG was expressed in luminal breast cancer cells, and the two EMT-TFs were expressed in distinct (but occasionally overlapping) populations in basal breast cancer cells (Extended Data Fig. 5a, b). In addition to these genetically unrelated breast cancer cell lines, we compared SLUG and SNAIL expression in an MCF10A-based model of breast cancer progression22. This model consists of the immortalized, nontumourigenic MCF10A human MECs, MCF10A cells transformed with an H-RAS oncogene (MCF10A-Ras), and a cell line established from an MCF10A-Ras cell-derived carcinoma (MCF10A-Ras-C). We found that SLUG was expressed in MCF10A cells, but was down-regulated in MCF10ARas-C cells. In contrast, SNAIL was absent in MCF10A cells, but underwent activation in MCF10A-Ras cells and further up-regulation in MCF10A-Ras-C cells (Extended Data Fig. 5c).
To summarize, these results indicated that the differential expression of Slug and Snail is a common feature of mammary tumours despite their different subtypes, genetic backgrounds and oncogenic drivers. Although Snail is absent in normal MECs, it often becomes activated during breast cancer progression. Indeed, SNAIL expression was detected in ~80% micro-dissected human invasive ductal carcinomas23.
Our observations raised the question of whether the Slug+, Snail+, or yet other cell subpopulations within mammary tumours were enriched in TICs. In order to address this issue, we developed a system that allowed us to isolate these various subpopulations. Thus,
Author Manuscript
Author Manuscript
Author Manuscript
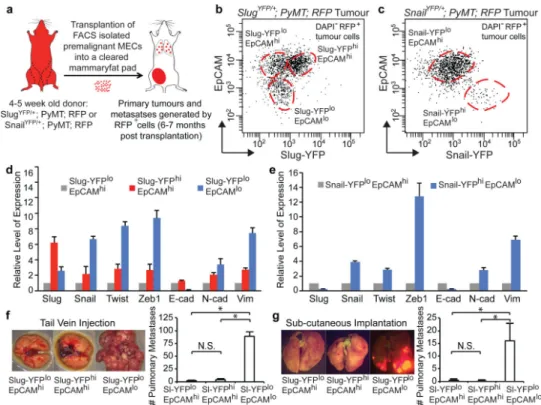
we FACS-purified premalignant EpCAM+ MECs from 4-5 week old SlugYFP/+ ;MMTV-PyMT;RFP (red fluorescent protein) or SnailYFP/+;MMTV-PyMT;RFP animals, and
thereafter implanted these cells into cleared mammary fat pads of hosts that lacked these transgenes (Fig. 3a). The implanted premalignant MECs first grew as rudimentary ductal structures and then progressed over 6-7 months to form high-grade carcinomas that metastasized to the lungs (Extended Data Fig. 6a, b).
We FACS-resolved the RFP+ carcinoma cells based on the expression levels of the YFP (Slug or Snail) reporter and the EpCAM epithelial marker. In the high-grade carcinomas and corresponding pulmonary metastases, EpCAM expression was down regulated in 4-12% of the carcinoma cells. These EpCAMlo cells had low Slug-YFP expression (Fig. 3b, Extended Data Fig. 5c) but high Snail-YFP expression (Fig. 3c, Extended Data Fig. 5d). In contrast, the EpCAMhi populations were Snail-YFPlo (Fig. 3c), and were composed of Slug-YFPloEpCAMhi and Slug-YFPhiEpCAMhi subpopulations (Fig. 3b). Hence, EpCAM expression was inversely correlated only with Snail expression.
Using qRT-PCR analyses, we confirmed that Snail expression was highest in the EpCAMlo subpopulations, whereas Slug was enriched in EpCAMhi subpopulations (Fig. 3d, e). As expected, strong induction of mesenchymal markers and suppression of E-cadherin was only seen in the EpCAMlo subpopulations (Fig. 3d, e). Using cell lines derived from
SlugYFP/+;MMTV-PyMT and SnailYFP/+;MMTV-PyMT tumours, we also observed the
segregation of Slug and Snail expression at the protein level and associated Snail but not Slug expression with strong induction of a mesenchymal phenotype (Extended Data Fig. 6e-h).
Together, these observations demonstrated our ability to resolve and isolate distinct tumour cell subpopulations with high levels of either Slug (Slughigh) or Snail (Snailhigh) from the same primary tumours (Extended Data Fig. 7a), allowing us, in turn, to directly compare their respective tumour-initiating activities. To this end, we FACS-purified these
subpopulations (Extended Data Fig. 6e-h) and implanted each at limiting dilutions to score tumour formation. Overall, Snailhigh subpopulations exhibited more than two orders-of-magnitude higher proportions of TICs than did the other subpopulations. In contrast, the Slug-YFPhigh cells were as deficient in tumour-initiating ability as the Slug-YFPloEpCAMhi cells (Extended Data Fig. 7b, c). Hence, Snail but not Slug was tightly associated with a TIC phenotype.
To compare the TIC activities and metastatic powers of these tumour cell subpopulations coexisting in the same primary tumours in vivo, we FACS-purified each subpopulation from highly metastatic carcinomas generated by SlugYFP;MMTV-PyMT;RFP cells and introduced
them via the tail vein to gauge their respective abilities to seed pulmonary metastases. Strikingly, the Snailhigh cells consistently gave rise to far more metastatic outgrowths relative to the EpCAMhi subpopulations. In particular, 40,000 Snailhigh cells from a highly metastatic primary tumour (Extended Data Fig. 8a) seeded on average ~90 large metastases in each animal. In stark contrast, 40,000 cells of the Slughigh, and Slug-YFPloEpCAMhi subpopulations from the same tumour seeded an average of only 3.6 and 2.2 metastases per animal respectively (Fig. 3f, Extended Data Fig. 8b). The Snailhigh cells were also far more
Author Manuscript
Author Manuscript
Author Manuscript
metastatic than the other two populations when implanted subcutaneously (Fig. 3g, Extended Data Fig. 8e-g). Interestingly, the metastatic outgrowths formed by the Snailhigh cells harbored gland-like structures composed of both Slug+ and Slug− cells (Extended Data Fig. 8c, d). Hence, the Snailhigh cells that seeded metastases were capable of differentiating within these outgrowths, thereby regenerating the complex cellular hierarchy present in the original primary tumours. These data also revealed that the TICs did not derive from basal MaSC-like cells (i.e. the Slughigh cells) but instead arose in a different cell population. We were curious whether correlates of these distinct behaviors of SLUG and SNAIL could be found in human clinical datasets and therefore examined the prognostic powers of SLUG or SNAIL24. Across various patient populations, we found that only elevated expression of
SNAIL consistently associated with poor survival (Extended Data Fig. 9a).
These above results strongly argue for divergent roles of Slug and Snail, and predicted that shutdown of Snail could selectively eliminate breast TICs. To test this notion, we knocked down either Slug or Snail in advanced MMTV-PyMT carcinoma-derived pBl.3G cells and MDA-MB-231 human breast cancer cells (Extended Data Fig. 9b, c). Strikingly, Snail knockdown but not Slug knockdown induced mesenchymal-toepithelial transition (MET), leading to loss of Zeb1 and reactivation of E-cadherin (Fig. 4a, b). When these cells were injected orthotopically into mammary fat pads, Snail but not Slug knockdown attenuated primary tumour growth and strongly suppressed their metastatic spreading (Fig. 4c-e). Similarly, across a panel of human breast cancer cell lines, we found that SNAIL knockdown significantly suppressed tumour-initiation in most of them, while SLUG knockdown failed to do so (Extended Data Fig. 9d-f). In sharp contrast to the responses of breast cancer cells, the organoid-forming and gland-reconstituting activities of normal murine MaSCs were dramatically affected by Slug knockdown but not by Snail knockdown (Fig. 4f, Extended Data Fig. 9g).
Given the distinct functions exerted by Slug and Snail, we analyzed the transcription programs controlled by these paralogous EMT-TFs using ChIP-seq. We focused on two MMTV-PyMT tumour cell lines, which differed in Slug and Snail expression and tumorigenic potential (Extended Data Fig. 10a, b). We recovered similar numbers of chromatin regions that were enriched for either Slug or Snail binding (Fig. 5a). Across the genome, Slug- and Snail-binding sites displayed similar fold enrichments and were both enriched for the known Snail family recognition CANNTG E-box motif25 (Extended Data Fig. 10c, d). We found that Snail occupied 10,129 promoters, far more than that occupied by Slug (2,475 promoters) (Fig. 5b). Interestingly, the promoters of genes encoding key mesenchymal markers were only bound by Snail but not by Slug (Extended Data Fig. 10e). Gene set enrichment analyses (GSEA) confirmed that Snail-bound but not Slug-bound genes were significantly enriched for EMT-related signatures (Fig. 5c). In particular, Snail, but not Slug, occupied the promoter of Zeb1 (Fig. 5d), a master regulator of TICs under a variety of settings26-28. The binding of Snail appears to activate Zeb1 expression in mammary tumour cells, because knockdown of Snail led to down-regulation of Zeb1 (Fig. 4a, c), and ectopic expression of Snail in human MECs induced Zeb1 expression (Extended Data Fig. 10f). Indeed, Snail had been reported to activate Zeb1 expression in non-mammary types of epithelial cells29,30.
Author Manuscript
Author Manuscript
Author Manuscript
To investigate the possible differential abilities of SLUG and SNAIL in controlling ZEB1 expression in human breast cancer cells, we used ChIP-qPCR to examine SLUG and SNAIL binding at the ZEB1 promoter in MDA-MB-231 cells, which happen to co-express SLUG and SNAIL. Strikingly, although both SLUG and SNAIL appeared to co-occupy the ZEB1 promoter in these cells, SLUG binding (but not SLUG expression) was diminished in SNAIL knockdown cells (Fig. 5e-g). Since the knockdown of SNAIL, but not SLUG, resulted in down-regulation of ZEB1 in MDA-MB-231 cells (Fig. 4c) and the binding of SLUG to the ZEB1 promoter is dependent on SNAIL expression, we concluded that ZEB1 expression was controlled by SNAIL but not SLUG in MDA-MB-231 cells as well. In summary, our data underscore profound differences in the transcription-regulating activities of the endogenously encoded Slug and Snail EMT-TFs, and provide indications that normal SCs and TICs of the same tissue-of-origin could arise from different cellular compartments and exploit different molecular signaling circuits to activate related but distinct signaling pathways. We have previously correlated high levels of SLUG expression with poor prognosis in human breast cancer patients, and attributed such correlation to the experimentally observed EMT-inducing function of SLUG8. However, on the basis of the present work, we propose that the prognostic power of SLUG expression may be due in large part to its strong association with basal differentiation, which is, on its own, a well-known feature of aggressive breast cancers16. Nonetheless, since our in vivo analyses focused on MMTV promoter-driven tumours, which appear to derive primarily from luminal MECs, we suggest that the functions of Slug in basal MEC-derived tumours remain to be further characterized.
Methods
AnimalsThe SlugYFP and SnailYFP alleles were generated by homologous recombination in mouse embryonic stem (ES) cells using standard gene-targeting methods. The MMTV-Neu animals and CAG-mRFP animals were obtained from the Jackson Laboratory (Stock # 005038 and 005884). The MMTV-PyMT animals were originally obtained from the Jackson Laboratory (Stock # 002374) and backcrossed for five generations to C57BL/6 background. Mice were housed and handled in accordance with protocols approved by the Animal Care and Use Committees of the Massachusetts Institute of Technology.
Genotyping
PCR primers (5′ to 3′) for SlugYFP genotyping were (sense strand, AACCTTCTCCAGAATGTCGCTTCTG; antisense strand,
TGCAGGTGTATCTTATACACGTGGC) and for SnailYFP genotyping were (sense strand, CTCCCGCATGTCCTTGCTCCACAAG; antisense strand, same as for SlugYFP). DNA extractions and subsequent PCR reactions were performed using the REDExtract-N-Amp Tissue PCR Kit (Sigma XNAT). PCR was performed with 35 cycles of denaturation at 94°C for 30 seconds, annealing at 60°C for 30 seconds, and elongation at 72°C for 30 seconds.
Author Manuscript
Author Manuscript
Author Manuscript
Tumour categorization
MMTV-PyMT tumours were categorized into hyperplastic lesions, adenocarcinomas and high-grade carcinomas following the histological criteria described by Lin et al12. Briefly, in the genetic background of our animals, hyperplasic lesions usually occur at about 8-10 weeks of age, and consist of regionally packed lobules formed on the duct. We collectively refer to the Adenoma/MIN and early carcinoma stages defined by Lin et al as
adenocarcinomas, as the tumours from 2.5 to 4 months old animals often have mixed characteristics of both kinds. High-grade carcinoma corresponds to the Late Carcinoma/ Advanced Invasive Carcinoma as defined by Lin et al, and is always associated with metastatic disease.
Immunofluorescence staining
Tumours were fixed in 10% neutral buffered formalin overnight and embedded in paraffin for sectioning. Sections were cut at 5 μm. Tumour sections were deparaffinized in Histoclear II, and antigen retrieval was performed with Nuclear Decloaker (Biocare Medical) using a microwave. Sections were then blocked with 0.5% normal donkey serum (Jackson ImmunoResearch Laboratories) in PBST (PBS+0.3% Triton-X100) for one hour at room temperature. Sections were incubated with primary antibody at 4 °C overnight. After three washes with PBS, sections were incubated with secondary antibodies (Biotium) and DAPI for two hours at room temperature, washed three times with PBS, and mounted in Prolong gold antifade reagent (Invitrogen P36930). For anti-Slug, anti-Snail and anti-Zeb1
immunofluorescence, the signals were amplified with the TSA Plus Systems (Perkin Elmer) following manufacturer's instructions.
Tumour organoids were fixed in collagen I gel with 4% paraformaldehyde for one hour at room temperature, blocked with 0.5% normal donkey serum in PBST, and then incubated with primary antibodies at 4 °C overnight. After five washes with PBST, organoids were incubated with DAPI, secondary antibodies and Phalloidin at 4 °C overnight. After five washes with PBST, the collagen I gel containing the organoids were mounted in Prolong gold antifade reagent.
Cultured tumour cells were fixed in 4% paraformaldehyde and blocked with 0.1% normal donkey serum in PBST for half an hour at room temperature. Cells were incubated in specific primary antibodies for 1-2 hours, washed three times with PBS, then incubated with secondary antibodies for 1 hour at room temperature. After three washes with PBS, stained cells were mounted in Prolong gold antifade reagent.
Immunostained samples were imaged using Zeiss LSM710 and Zeiss LSM700 confocal microscopes and analyzed with Zen software.
Antibodies used in this study are listed in the Supplementary Information. Tumour dissociation, FACS fractionation and derivation of tumour cell lines
Tumours were taken from the animals aseptically. At least one fragment from each tumour was saved for histological staging of the tumour. The remainder of each tumour was then
Author Manuscript
Author Manuscript
Author Manuscript
minced with a razor blade, and the minced chunks were then rinsed three times with PBS, and digested with collagenase A followed by trypLE-select (invitrogen). The dissociated tumour cells were then washed twice with DMEM with 10% FBS, and filtered through 70 μm and 40 μm cell strainer. The resulting cells were stained with DAPI, anti-EpCAM antibody, washed three times with PBS, and resuspended in PBS for flow cytometry analysis and FACS fractionation.
To establish tumour cell lines, 1×10⁷ dissociated and filtered tumour cells were plated in a 10 cm dish in DMEM: F12 supplemented with 5% adult bovine serum, non-essential amino acids (Invitrogen), and penicillin/streptomycin. On the next day, dead cells were removed by medium change, and the attached cells were passaged at 1:2 to 1:3 for about five passages until each culture was established. Tumour cell lines were all derived from high-grade carcinomas of 6-7 months old females.
Cell Lines and Cell Culture
PyMT tumour cell lines were cultured in DMEM/F12 (1:1) supplemented with 5% adult bovine serum (Sigma B9433), non-essential amino acid (Invitrogen 11140), and Pen/Strep (Invitrogen 15070). MDA-MB-231, MDA-MB-361, and MDA-MB-468 cells were culture in DMEM/F12 (1:1) supplemented with 10% inactivated fetal bovine serum (Sigma F4135) and Pen/Strep. SKBR3, BT20 and MCF7Ras cells were cultured in DMEM supplemented with 10% inactivated fetal bovine serum and Pen/Strep. SUM149 and SUM159 cells were cultured in F12 media supplemented with 5% inactivated fetal bovine serum, insulin (5 μg/ ml), and hydrocortisone (1 μg/ml). T47D, HS578T, and BT549 cells were cultured in RPMI supplemented with 10% inactivated fetal bovine serum and Pen/Strep. MCF10A cells were cultured in DMEM/F12 supplemented with 5% horse serum (Sigma H1207), Insulin (10 μg/ml Sigma I9278), EGF(100 μg/ml Sigma E9644), hydrocortizone(0.5 mg/ml Sigma H0888), and colera toxin(100 ng/ml Sigma C8052). All human breast cancer cell lines were obtained from ATCC, and are free of mycoplasma contamination.
MMTV-PyMT tumour organoids culture was performed as previously described13. 3D organoid culture of primary MECs was performed as previously described8. Tumoursphere assays were performed as described in Tam et al31. 200 cells (1000 cells for MDA-MB-361 cells) were plated into each well of 96-well ultra low attachment plate to score tumoursphere formation efficiency. Five wells were analyzed for each condition.
Tumour cell implantation
For cleared mammary fat pad transplantation, primary MECs were isolated from the mammary glands of 4- to 5-week-old virgin female mice by collagenase and trypsin
digestion. Sorted EpCAM+ cells were suspended in 10 μl PBS containing 50% Matrigel, and
injected into the inguinal mammary fat pads of 3-week-old NOD-SCID mice, whose endogenous mammary epithelium were cleared at the time of the injection. For tail-vein injection, tumour cells were resuspended in 100 μl PBS, and injected into male animals. The lungs were examined 4 to 8 weeks post injection. For subcutaneous injections, tumour cells were suspended in 100 μl PBS with or without Matrigel (as indicated in the figures) into the flanks of male animals. The tumour incidence and weight were measured 2-3 months post
Author Manuscript
Author Manuscript
Author Manuscript
injection. For orthotopic tumour transplantations, tumour cells were resuspended in 20 μl media with the indicated amount of Matrigel and injected into mammary fat pads. Host animals were randomized by weight. In Fig. 4c, 10^5 PyMT tumour cells were injected unilaterally into the mammary fat pad (without matrigel) to score primary tumour burden and metastatic dissemination (six animals for each group). In Fig. 4d, 10^6 MDA-MB-231 cells were injected bilaterally (with 20% matrigel) to score primary tumour burden and metastatic dissemination (five animals for each group). For the metastasis quantification, the lungs were examined under a Leica fluorescence dissecting microscope. Blinded
quantifications were performed when scoring the numbers of lung metastases. For limiting dilution analyses, the frequency of TICs in the cell population being transplanted was calculated using the Extreme Limiting Dilution Analysis Program (http://bioinf.wehi.edu.au/ software/elda/index.html)32.
Cleared mammary fat pad injection
Cleared mammary fat pad injections were performed as previously described8. Briefly, 1×10⁵ cells were suspended in 10 μl PBS containing 50% Matrigel and injected into the inguinal mammary fat pads of NOD/SCID female mice that had previously been cleared of endogenous mammary epithelium. Gland reconstitutions were assessed under fluorescence dissecting microscope at 3 months post injection.
RNA isolation, reverse transcription and qPCR analysis
Total RNA from freshly sorted primary tumour cells was extracted using Trizol (Invitrogen), and column-purified with PicoPure RNA Isolation Kit (Applied Biosystems). cDNA
synthesis was performed with 0.2-2 μg of total RNA using SuperScript III First-Strand Synthesis System (Invitrogen). mRNA levels were measured with gene-specific primers using the Roche LightCycler 480 system (Roche). Relative expression levels were normalized to β-actin. Primers used for qPCR analysis are listed in Supplmentary
Information. shRNA vectors
The sources or targeting sequences of the shRNA used in the study are as follows: mouse shSlug: shSlug4 from Guo et al. 20128; mouse shSnail: from Shibue et al., 201333; human
shSLUG: clone #1 and #2 from34; human shSNAIL:#1 TTCCTTGTTGCAGTATTTG #2
ATAAATACCAGTGTACCTT; shLuciferase: CCTAAGGTTAAGTCGCCCTCG Meta-analysis of oncogenomic data
To test whether the expression of Slug or Snail correlated with distant metastasis-free survival (all subtypes, n = 1610) and relapse-free survival (ER+ patients n = 1802, PR+ patients n = 525, ER-PR- patients n = 346) the datasets (GSE1456 GSE2034 GSE2990 GSE3494 GSE4922 GSE6532 GSE7390 GSE11121 GSE12093 GSE5327 GSE9195 GSE16391 GSE12276 GSE2603 GSE17705 GSE21653 GSE16446 GSE17907 GSE19615 GSE20685 GSE20711 GSE26971 GSE31448 GSE31519 E-MTAB-365 GSE20194 GSE20271) were analyzed and Kaplan–Meier (K-M) plots were generated using http:// kmplot.com24. The patient samples were grouped as either high or low expressor for the
Author Manuscript
Author Manuscript
Author Manuscript
genes of interest based on the expression level of the selected gene, and the upper tertile were used as the cut-off and median is computed over the entire dataset.
Chromatin immunoprecipitation sequencing
ChIP assay was carried out as described previously31. The ChIP-seq results have been deposited to Gene Expression Omnibus (GEO) under accession number GSE61198. We performed ChIP-seq experiments using either an anti-Slug or anti-Snail antibody. In the Slug-high pBl.1G cells, as anticipated, we could only recover chromatin fragments from Slug ChIP but not Snail ChIP. Conversely, from the Snail-high pBl.3G cells, chromatin fragments were only recoverable from Snail ChIP but not Slug ChIP, demonstrating the specificities of these antibodies. Slug- or Snail-bound DNA sites were determined with Model-based Analysis of ChIP-Seq (MACS) algorithm, and bound target genes were defined as containing Slug or Snail occupancy within 5 kb upstream and downstream relative to the transcription start site for each RefSeq transcript35. Fold enrichment of each MACS peak were calculated against the whole cell extract. Enriched motifs were identified using 1000nt centered at the peak summit of the top 1000 Slug and Snail peaks (ranked by MACS peak scores). The sequences were processed through MemeChIP (http://
meme.nbcr.net/meme/cgi-bin/meme-chip.cgi) using default settings.
Gene set enrichment analyses (GSEA) were performed with the GSEA platform of Broad Institute (http://www.broadinstitute.org/gsea/index.jsp). Slug-bound genes and Snail-bound genes were ranked according to the fold enrichment of the correspondent MACS peaks. For SLUG and SNAIL ChIP-qPCR in MDA-MB-231 cells, ChIP-enriched DNA was analyzed by realtime PCR using the ABI PRISM 7900 sequence detection system and SYBR green master mix. Relative occupancy values were calculated by determining the apparent immunoprecipitation efficiency (ratios of the amount of immunoprecipitated DNA to that of the input sample) and normalized to the level observed. The primers used for the realtime PCR are ZEB1 target locus fwd ACAAGCGAGAGGATCATGGCG, rev CACTCACCGTTATTGCGCCG; ZEB1 control locus fwd
TAATAATGGGCGGCAACGGC, rev AGGAACCAAAGCGAGCCCCT. Statistical analysis
Statistical analyses were carried out by two-tailed Student's t-test unless otherwise specified.
Author Manuscript
Author Manuscript
Author Manuscript
Extended Data
Extended data figure 1. Slug expression is associated with a partial EMT phenotype in normal MECs
(a) Validation of the Slug-YFP knock-in reporter. Mammary tumour section from
SlugYFP/+;MMTV-PyMT female mice were stained for YFP (green), Slug (red), cytokeratin
(grey), and DAPI (blue). (b) Validation of the Snail-YFP knock-in reporter. Mammary tumour section from SnailYFP/+;MMTV-PyMT female mice were stained for YFP (green),
Snail (red), cytokeratin (grey), and DAPI (blue). (c) Lin− cells of normal mammary glands were separated into luminal MECs, basal MECs and stromal fibroblasts using CD24 and CD49f cell-surface markers.(d, e) Representative FACS histogram showing relative expression levels of Slug-YFP and Snail-YFP reporters in the indicated cell populations in mammary glands during puberty (d) and during pregnancy (e). Note that luminal MECs from pregnant females exhibit higher levels of autofluorescence signals (grey dashed line in panel e). (f) Normal human mammary tissue sections were stained for Slug or Zeb1 (green), CK14 (red), CK8 (grey), and DAPI (blue). Arrowheads indicate Slug+CK14+ cells. (g) Representative FACS histogram showing expression level of the epithelial cell-surface marker EpCAM in the indicated populations of the normal mammary gland. (d, e, g) are representative of three independent experiments. All scale bars 10 μm.
Author Manuscript
Author Manuscript
Author Manuscript
Extended data figure 2. Differential expression of Snail and Slug in mammary tumours
(a, b) Quantifications of the frequencies of Slug-YFP+ and Snail-YFP+ tumour cells (a) and quantifications of Slug versus Snail expression (b) at different stages of mammary tumour development by immunofluorescence staining. For each stage, tumours from six animals were analyzed for the quantifications. (c) Individual channels of the stained image in Fig. 2e. (d) Quantifications of E-cad and Zeb1 positivity (n, number of cells, high-grade carcinomas from six animals were quantified). (e, f) Quantification of CK8 and CK14 expression profile of Snail-YFP-postive and Slug-YFP-positive tumour cells (n, number of cells). For each stage, tumours from six animals were analyzed for the quantifications. (b, d-f) n, number of cells.
Author Manuscript
Author Manuscript
Author Manuscript
Extended data figure 3. Snail activation is associated with invasive changes in mammary tumour cells ex vivo
(a) Freshly isolated tumour organoids stained for YFP (green), CK14 (red), CK8 (grey), and DAPI (blue). Note only background staining was detected for YFP and CK14. Scale bar 20 μm. (b) Tumour organoids from animals of the indicated genotypes were cultured in type I collagen gel for 48h and stained for YFP (green), phalloidin (red), and DAPI (blue). Scale bar 10 μm. (c) Frequency of CK8+CK14+ leader cells expressing Slug-YFP and Snail-YFP (n, number of cells). Tumour organoids from five different animals were analyzed for each genotype. (d) Schematic diagram summarizing expression patterns of Snail and Slug in the normal mammary gland and at different stages of mammary tumour development in the MMTV-PyMT model.
Author Manuscript
Author Manuscript
Author Manuscript
Extended data figure 4. Differential expression of Snail and Slug in MMTV-Neu and BRCA-1/ p53-minus models of mammary tumours
(a-c) Representative immunofluorescence images of sections of aggressive MMTV-Neu tumours stained for DAPI (blue), Cytokeratin (red), and Slug (green, panel a)/Snail (green, panel b)/Zeb1 (green, panel c). Scale bar 10 μm. (d) H&E staining showing representative histology of differentiated area in MMTV-Cre;p53+/−;BRCA1fl/fl tumours. Scale bar 50 μm. (e) Representative immunofluorescence images of the differentiated areas in
MMTV-Cre;p53+/−;BRCA1fl/fl tumours stained for the indicated proteins. Five tumours were analyzed, and quantifications are shown in (f) (n, number of cells). Scale bar 10 μm. (g) H&E staining showing representative histology of differentiated area in
MMTV-Cre;p53+/−;BRCA1fl/fl tumours. Scale bar 50 μm. (h) Representative immunofluorescence images of the invasive areas in MMTV-Cre;p53+/−;BRCA1fl/fl tumours stained for the indicated proteins. Five tumours were analyzed, and quantifications are shown in (i) (n, number of cells).
Author Manuscript
Author Manuscript
Author Manuscript
Extended data figure 5. Differential expression of Snail and Slug in human breast cancer cell lines
(a) Representative immunofluorescence images of indicated human breast cancer cell lines stained for DAPI (blue), SNAIL (green), and SLUG (red). Scale bar 10 μm. (b)
Quantification of SLUG versus SNAIL expression in indicated human breast cancer cell lines (n, number of cells). Five fields were counted for each cell line. (c) Representative image showing the morphologies of the series of MCF10A cell lines in culture. Scale bar 50 μm. (d) Western Blot showing expression of SLUG and SNAIL in the indicated MCF10A cell lines. (a-d) represent two independent experiments. Uncropped western blots are enclosed in Supplemental Information.
Author Manuscript
Author Manuscript
Author Manuscript
Extended data figure 6. Isolation of tumour cell subpopulations with differential Snail and Slug expression by FACS
(a, b) Representative wholemount images showing tumour progression in the transplantation model of mammary tumours illustrated in Fig. 3a. The implanted cells initially formed rudimentary gland-like structures (a) and eventually progressed to become high-grade carcinomas that spontaneously metastasize to the lungs. The RFP marker allows detection of pulmonary metastases as shown in (b). Scale bars 500 μm. Images represent five
independent experiments. (c, d) FACS profiles of RFP+ tumour cells in the pulmonary metastases corresponding to the primary tumours shown in Fig. 3b and Fig. 3c. Major populations are outlined with dashed circles. (e) SnailYFP/+;MMTV-PyMT tumour cells were
separated into indicated populations by FACS. The morphologies of the unfractionated cells and the purified populations are shown. Scale bar 50 μm. (f) Western blots showing
expression of EMT markers in the indicated cell populations. (g) SlugYFP/+;MMTV-PyMT
tumour cells were separated into indicated populations by FACS. The morphologies of the unfractionated cells and the purified populations are shown. Scale bar 50 μm. (h) Western blots showing expression of Slug, YFP and Snail in the indicated cell populations. Uncropped western blots are enclosed in Supplemental Information. (e-h) Data represent three independent experiments.
Author Manuscript
Author Manuscript
Author Manuscript
Extended data figure 7. Fractionation of primary mammary tumours
(a) Experimental scheme for Fig. 3f, g, and extended data Fig. 8a-g. (b, c) Tumour cell subpopulations from SnailYFP/+;MMTV-PyMT tumour cell line (b) and SnailYFP/+ ;MMTV-PyMT tumour cell line (c) were injected subcutaneously at limiting dilutions to score
primary tumour formation. Tumour-initiation cell frequencies were evaluated by ELDA. (b, c) Tumour-initiation were scored and presented as (# of tumour incidences/# of injections).
Extended data figure 8. Breast TICs express Snail
(a) H&E staining showing the histology of the donor primary tumour where cells used in Fig. 3f were isolated from, scale bar 200 μm. (b) The original pulmonary metastases spawned by the primary tumour (left panel), and pulmonary metastases formed by the indicated tumour cell populations following tail-vein injection, scale bar 500 μm. (c) Higher magnification images of H&E stained lung sections showing histology of the original pulmonary metastases in the donor animal (left panel), and pulmonary metastases formed by
Author Manuscript
Author Manuscript
Author Manuscript
the Slug-YFPloEpCAMlo tumour cells following tail-vein injection. Scale bar 200 μm. (d) Representative immunofluorescence staining image of sections of pulmonary metastases formed by the Slug-YFPloEpCAMlo tumour cells were stained for DAPI (blue), Slug (green), CK14 (red), and CK8 (grey). Arrowheads indicate Slug-positive cells. Scale bar 20 μm. Images represent four independent experiments. (e) H&E staining of the donor primary tumour where cells used in Fig. 3g were isolated from (left panel) and H&E staining of primary tumours formed by the indicated populations following subcutaneous implantation (with 25% Matrigel). (f) Primary tumour burdens formed by the indicated populations following subcutaneous implantation (For EpCAMloSluglo cells 1^104 cells were injected, for the other two groups 1^105 cells were injected. Primary tumours and lungs were analyzed 10-weeks post injection. n=10 sites of injections for each group). Open circle indicates failure of tumour-initiation. Scale bar 200 μm. Source Data are enclosed in Source Data T3. (g) H&E staining of lung sections showing metastatic outgrowths spawned by the indicated cell populations following subcutaneous implantation. Scale bar 500 μm.
Extended data figure 9. Snail and Slug are differentially employed by normal MaSCs and breast TICs
(a) Kaplan-Meier plots showing survival of patients with the indicated subtypes of breast cancers. Patient groups were separated based on SLUG (top row) or SNAIL (bottom row) mRNA expression. (b) Western blot confirming Slug and Snail knockdown in established PyMT tumour cell line transduced with the indicated shRNA expression vectors. The shLuciferase (shLuc) shRNA was used as a control. (c) Western blot confirming SLUG and SNAIL knockdown in MDA-MB-231 cells transduced with the indicated shRNA expression vectors. shLuc was used as a control. Uncropped western blots are enclosed in Supplemental
Author Manuscript
Author Manuscript
Author Manuscript
Information. (d) Tumour-sphere formation efficiencies (# tumourspheres/1000 cells for MDA-MB-361 cells, and # tumourspheres/200 cells for all the other cell lines) of the indicated human breast cancer cells transduced with shSLUG#2, shSNAIL#2, and the shLuc control (mean + s.d., n = 5 technical replicates/group). Data represent two independent experiments. (e, f) SUM159 (e) and SUM149 (f) cells transduced with the indicated shRNAs were injected subcutaneously at limiting dilutions to score primary tumour formation. Tumour-initiation were scored and presented as (# of tumour incidences/# of injections). Data represent two independent experiments. (g) The organoid forming efficiencies of normal MECs transduced with the indicated shRNA expression vectors (mean ± s.d., n =6 technical replicates/group, *p<0.001, N.S. not significant.). Scale bar 100 μm. Data represent three independent experiments.
Extended data figure 10. Slug and Snail occupy different genomic regions
(a) Western blots showing expression of EMT-TFs and EMT markers in the PyMT tumour cell lines used for the ChIP-seq analyses.Uncropped western blots are enclosed in
Supplemental Information. Data represent three independent experiments (b) Pulmonary metastases formed by 100,000 cells of the indicated cell lines following tail-vein injection. (n = 9 animals/group) Source data are enclosed in Source Data T4. (c) Box-plot showing distributions of fold enrichment of all peaks identified in Snail ChIP and Slug ChIP. (d) Sample top motifs enriched around the summits of the α-Snail and α-Slug ChIP peaks. (e) Sample ChIP-seq signals for Slug and Snail are shown. Left column shows promoters bound by Slug only. Right column shows promoters bound by Snail only. Arrows indicate the directions of transcription. (f) MCF10A human mammary epithelial cells were transduced with rtTA and SNAIL driven by a tet-on promoter, untreated (left panel) or treated with 2
Author Manuscript
Author Manuscript
Author Manuscript
μg/ml doxycycline (dox) for 48h (right panel), and stained for E-cad (green) and ZEB1 (red). Scale bar 20 μm. Data represent five independent experiments.
Supplementary Material
Refer to Web version on PubMed Central for supplementary material.
Acknowledgements
The pBl.1 and pBl.3 murine PyMT tumour cell lines, from which pBl.1G and pBl.3G were derived, were kind gifts from the Harold L. Moses laboratory. We thank Dr. George Bell for helping analyzing the ChIP-seq data. We thank Dr. Roderick Bronson for help assessing the histopathology of the murine tumours. We thank Drs. Arthur Lambert and Sam Thiagalingam for providing the MCF10A-Ras and MCF10A-Ras-C cells. We thank Drs. William Israelsen and Matthew Vander Heiden for providing the MMTV-Cre;p53+/−;BRCA1fl/fl murine mammary tumour samples. We thank the Keck Microscopy Facility at the Whitehead Institute for microscopy assistance and the Koch Institute Swanson Biotechnology Center (SBC) for technical support, especially the Histology and ES cell & Transgenics Cores. R.A.W. is an American Cancer Society and Ludwig Foundation professor. W.L.T is supported by the National Research Foundation, Singapore (NRF-NRFF2015-04). This research was supported by the Breast Cancer Research Foundation, the Samuel Waxman Cancer Research Foundation, the Ludwig Center for Molecular Oncology at MIT, National Cancer Institute Program P01-CA080111, R01-CA078461, U01-CA184897 (to R.A.W.), K99-CA194160 (to X.Y.), the Wilshire Charitable Foundation/Andria and Paul Heafy Postdoctoral Fellowship (to X.Y.), the Mattina R. Proctor Foundation and the Helen Hay Whitney Foundation (to X.Y.).
REFERENCES
1. Al-Hajj M, Clarke MF. Self-renewal and solid tumor stem cells. Oncogene. 2004; 23:7274–7282. doi:10.1038/sj.onc.1207947. [PubMed: 15378087]
2. O'Brien CA, Kreso A, Dick JE. Cancer stem cells in solid tumors: an overview. Seminars in radiation oncology. 2009; 19:71–77. doi:10.1016/j.semradonc.2008.11.001. [PubMed: 19249644] 3. Visvader JE, Lindeman GJ. Cancer stem cells: current status and evolving complexities. Cell Stem
Cell. 2012; 10:717–728. doi:10.1016/j.stem.2012.05.007. [PubMed: 22704512]
4. Chaffer CL, et al. Normal and neoplastic nonstem cells can spontaneously convert to a stem-like state. Proc Natl Acad Sci U S A. 2011; 108:7950–7955. doi:10.1073/pnas.1102454108. [PubMed: 21498687]
5. Gupta PB, et al. Stochastic state transitions give rise to phenotypic equilibrium in populations of cancer cells. Cell. 2011; 146:633–644. doi:10.1016/j.cell.2011.07.026. [PubMed: 21854987] 6. Beck B, Blanpain C. Unravelling cancer stem cell potential. Nat Rev Cancer. 2013; 13:727–738.
doi:10.1038/nrc3597. [PubMed: 24060864]
7. Kreso A, Dick JE. Evolution of the cancer stem cell model. Cell Stem Cell. 2014; 14:275–291. doi: 10.1016/j.stem.2014.02.006. [PubMed: 24607403]
8. Guo W, et al. Slug and Sox9 cooperatively determine the mammary stem cell state. Cell. 2012; 148:1015–1028. doi:10.1016/j.cell.2012.02.008. [PubMed: 22385965]
9. Shackleton M, et al. Generation of a functional mammary gland from a single stem cell. Nature. 2006; 439:84–88. doi:10.1038/nature04372. [PubMed: 16397499]
10. Stingl J, et al. Purification and unique properties of mammary epithelial stem cells. Nature. 2006; 439:993–997. doi:10.1038/nature04496. [PubMed: 16395311]
11. Prater MD, et al. Mammary stem cells have myoepithelial cell properties. Nat Cell Biol. 2014; 16:942–950. 941–947. doi:10.1038/ncb3025. [PubMed: 25173976]
12. Lin EY, et al. Progression to malignancy in the polyoma middle T oncoprotein mouse breast cancer model provides a reliable model for human diseases. Am J Pathol. 2003; 163:2113–2126. doi:10.1016/S0002-9440(10)63568-7. [PubMed: 14578209]
13. Cheung KJ, Gabrielson E, Werb Z, Ewald AJ. Collective invasion in breast cancer requires a conserved basal epithelial program. Cell. 2013; 155:1639–1651. doi:10.1016/j.cell.2013.11.029. [PubMed: 24332913]
Author Manuscript
Author Manuscript
Author Manuscript
14. Lim E, et al. Aberrant luminal progenitors as the candidate target population for basal tumor development in BRCA1 mutation carriers. Nat Med. 2009; 15:907–913. doi:10.1038/nm.2000. [PubMed: 19648928]
15. Molyneux G, et al. BRCA1 basal-like breast cancers originate from luminal epithelial progenitors and not from basal stem cells. Cell Stem Cell. 2010; 7:403–417. doi:10.1016/j.stem.2010.07.010. [PubMed: 20804975]
16. Visvader JE. Keeping abreast of the mammary epithelial hierarchy and breast tumorigenesis. Genes Dev. 2009; 23:2563–2577. doi:10.1101/gad.1849509. [PubMed: 19933147]
17. Visvader JE. Cells of origin in cancer. Nature. 2011; 469:314–322. doi:10.1038/nature09781. [PubMed: 21248838]
18. Muller WJ, Sinn E, Pattengale PK, Wallace R, Leder P. Single-step induction of mammary adenocarcinoma in transgenic mice bearing the activated c-neu oncogene. Cell. 1988; 54:105–115. [PubMed: 2898299]
19. Xu X, et al. Conditional mutation of Brca1 in mammary epithelial cells results in blunted ductal morphogenesis and tumour formation. Nat Genet. 1999; 22:37–43. doi:10.1038/8743. [PubMed: 10319859]
20. Moody SE, et al. The transcriptional repressor Snail promotes mammary tumor recurrence. Cancer Cell. 2005; 8:197–209. doi:10.1016/j.ccr.2005.07.009. [PubMed: 16169465]
21. Tran HD, et al. Transient SNAIL1 expression is necessary for metastatic competence in breast cancer. Cancer Res. 2014; 74:6330–6340. doi:10.1158/0008-5472.CAN-14-0923. [PubMed: 25164016]
22. Papageorgis P, et al. Smad signaling is required to maintain epigenetic silencing during breast cancer progression. Cancer Res. 2010; 70:968–978. doi:10.1158/0008-5472.CAN-09-1872. [PubMed: 20086175]
23. Natrajan R, et al. An integrative genomic and transcriptomic analysis reveals molecular pathways and networks regulated by copy number aberrations in basal-like, HER2 and luminal cancers. Breast Cancer Res Treat. 2010; 121:575–589. doi:10.1007/s10549-009-0501-3. [PubMed: 19688261]
24. Gyorffy B, et al. An online survival analysis tool to rapidly assess the effect of 22,277 genes on breast cancer prognosis using microarray data of 1,809 patients. Breast Cancer Res Treat. 2010; 123:725–731. doi:10.1007/s10549-009-0674-9. [PubMed: 20020197]
25. Nieto MA. The snail superfamily of zinc-finger transcription factors. Nat Rev Mol Cell Biol. 2002; 3:155–166. doi:10.1038/nrm757. [PubMed: 11994736]
26. Chaffer CL, et al. Poised chromatin at the ZEB1 promoter enables breast cancer cell plasticity and enhances tumorigenicity. Cell. 2013; 154:61–74. doi:10.1016/j.cell.2013.06.005. [PubMed: 23827675]
27. Siebzehnrubl FA, et al. The ZEB1 pathway links glioblastoma initiation, invasion and chemoresistance. EMBO Mol Med. 2013; 5:1196–1212. doi:10.1002/emmm.201302827. [PubMed: 23818228]
28. Wellner U, et al. The EMT-activator ZEB1 promotes tumorigenicity by repressing stemness-inhibiting microRNAs. Nat Cell Biol. 2009; 11:1487–1495. doi:10.1038/ncb1998. [PubMed: 19935649]
29. Thiery JP, Acloque H, Huang RY, Nieto MA. Epithelial-mesenchymal transitions in development and disease. Cell. 2009; 139:871–890. doi:10.1016/j.cell.2009.11.007. [PubMed: 19945376] 30. Guaita S, et al. Snail induction of epithelial to mesenchymal transition in tumor cells is
accompanied by MUC1 repression and ZEB1 expression. The Journal of biological chemistry. 2002; 277:39209–39216. doi:10.1074/jbc.M206400200. [PubMed: 12161443]
31. Tam WL, et al. Protein kinase C alpha is a central signaling node and therapeutic target for breast cancer stem cells. Cancer Cell. 2013; 24:347–364. doi:10.1016/j.ccr.2013.08.005. [PubMed: 24029232]
32. Hu Y, Smyth GK. ELDA: extreme limiting dilution analysis for comparing depleted and enriched populations in stem cell and other assays. J Immunol Methods. 2009; 347:70–78. doi:10.1016/ j.jim.2009.06.008. [PubMed: 19567251]
Author Manuscript
Author Manuscript
Author Manuscript
33. Shibue T, Brooks MW, Weinberg RA. An integrin-linked machinery of cytoskeletal regulation that enables experimental tumor initiation and metastatic colonization. Cancer Cell. 2013; 24:481–498. doi:10.1016/j.ccr.2013.08.012. [PubMed: 24035453]
34. Gupta PB, et al. The melanocyte differentiation program predisposes to metastasis after neoplastic transformation. Nat Genet. 2005; 37:1047–1054. doi:10.1038/ng1634. [PubMed: 16142232] 35. Zhang Y, et al. Model-based analysis of ChIP-Seq (MACS). Genome Biol. 2008; 9:R137. doi:
10.1186/gb-2008-9-9-r137. [PubMed: 18798982]
Author Manuscript
Author Manuscript
Author Manuscript
Figure 1. Differential expression of Slug and Snail in normal mammary glands
(a, b) Targeting strategies for the knock-in alleles. (c, d) Normal mammary glands of the indicated genotypes were stained for the indicated proteins. (e) FACS histograms showing relative expression levels of the YFP reporters in normal adult mammary cell
subpopulations. (f) Normal mammary gland stained for E-cad and Slug. Arrowheads indicate the junctions between basal MECs. Quantifications of Anti-E-cad staining intensities at the junctions between luminal MECs and basal MECs in a representative mammary gland (mean ± s.d., n = 20, cell junctions, * p<0.00001). Data represent analyses of six glands. (g) Representative qRT-PCR quantification of the indicated EMT markers (mean + s.e.m., technical triplicates). Levels in luminal MECs were set to one. Data represent three independent experiments. All scale bars 20 μm.
Author Manuscript
Author Manuscript
Author Manuscript
Figure 2. Differential expression of Slug and Snail in mammary tumours
(a, b) Hyperplastic mammary lesions of the indicated genotypes were stained for the indicated proteins. Arrow in (a) indicates Snail-YFP and CK8 double-positive cells. Arrows and arrowheads in (b) indicate Snail-YFP and cytokeratin double-positive cells and Slug-positive cells respectively. (c, d) High-grade carcinomas of the indicated genotypes were stained for the indicated proteins. Arrows indicate Zeb1 and cytokeratin double-positive cells (c) and the junctions between YFP-positive carcinoma cells (d). (e) SnailYFP/+ ;MMTV-PyMT tumours were stained for the indicated proteins. Arrows indicate Snail-YFP-positive
carcinoma cells. (f) Tumour organoids of the indicated genotypes were stained for the indicated proteins. Images represent three independent experiments. All scale bars 10 μm.
Author Manuscript
Author Manuscript
Author Manuscript
Figure 3. Breast TICs express Snail
(a) Schematic of the transplantation model. (b, c) FACS profiles of the high-grade carcinomas of the indicated genotypes. (d, e) Representative qRT-PCR analyses of the expressions of EMT markers (mean + s.e.m., technical triplicates) in indicated
subpopulations of high-grade carcinomas derived from SlugYFP/+;MMTV-PyMT;RFP (d)
and SnailYFP/+;MMTV-PyMT;RFP MECs (e). Expression levels in Slug-YFPloEpCAMhi cells and Snail-YFPloEpCAMhi cells were set to one. (d, e) represent three independent experiments. (f, g) Metastatic outgrowths generated by indicated subpopulations following tail vein injection. * p<0.0001 (g) and following sub-cutaneous implantation. * p=0.019 (h) (mean + s.d., n = 5 animals/group). N.S. not significant. (f) and (g) represent four and three independent experiments respectively. Source data are enclosed in Source Data T1.
Author Manuscript
Author Manuscript
Author Manuscript
Figure 4. Depletion of Snail selectively affects breast TICs
(a, b) Immunofluorescence images of the shRNA-transduced pBl.3G cells (a) and MDA-MB-231 cells (b). Scale bars 20 μm. (c, d) Primary tumour burdens and pulmonary
metastases formed by orthotopically implanted pBl.3G cells (c, unilateral implantation, n = 5 animals/group, *p=0.026, **p=1.9×10⁻⁵) and MDA-MB-231 cells (d, bilateral implantation, n = 5 animals/group *p<0.01, **p<0.001). N.S. not significant. Source data are enclosed in Source Data T2. (e) Fluorescent images of wholemount lungs showing spontaneously metastases formed by the orthotopically implanted GFP-labeled MDA-MB-231 cells. (f) Wholemount fluorescent images of the mammary fat pads implanted with the indicated GFP-expressing primary murine MECs. Scale bar 1 mm.
Author Manuscript
Author Manuscript
Author Manuscript
Figure 5. Slug and Snail control different targets
(a) Distribution of summits of all Snail ChIP-seq and Slug ChIP-seq peaks. TSS:
transcription start site, TES: transcription end site. (b) Venn diagram showing the numbers of promoters occupied by Slug and Snail. (c) GSEA analyses of published EMT-related datasets for Snail-bound and Slug-bound genes. (d) ChIP-seq signals for Slug and Snail at the Zeb1 locus. Arrows indicate TSSs. (e-g) Fold-enrichment of SLUG and SNAIL binding at the ZEB1 promoter relative to background measured by ChIP–qPCR (mean + s.e.m., technical triplicates). Data represent two independent experiments.