Acta Protozool. (2017) 56: 191–210
www.ejournals.eu/Acta-Protozoologica
doi:10.4467/16890027AP.17.017.7498
ACTA
PROTOZOOLOGICA
Response of Sphagnum Testate Amoebae to Drainage, Subsequent
Re-wetting and Associated Changes in the Moss Carpet – Results from
a Three Year Mesocosm Experiment
Isabelle KOENIG
1, Florence SCHWENDENER
1, Matthieu MULOT
1, 2, Edward A. D. MITCHELL
1, 31 Laboratory of Soil Biodiversity, University of Neuchâtel, Neuchâtel, Switzerland; 2 Station biologique, Adaptation et diversité en milieu marin, Evolution des Protistes et Ecosystèmes Pélagiques, Roscoff, France; 3 Jardin Botanique de Neuchâtel, Neuchâtel, Switzerland
Abstract. Sphagnum peatlands represent a globally significant pool and sink of carbon but these functions are threatened by ongoing climate
change. Testate amoebae are useful bioindicators of hydrological changes, but little experimental work has been done on the impact of water table changes on communities.
Using a mesocosm experimental setting that was previously used to assess the impact of drought disturbance on communities and eco-system processes with three contrasted water table positions: wet (–4 cm), intermediate (–15 cm) and dry (–25 cm), we studied the capacity of testate amoeba communities to recover when the water table was kept at –10 cm for all plots. The overall experiment lasted three years. We assessed the taxonomic and functional trait responses of testate amoeba communities. The selected traits were hypothesised to be cor-related to moisture content (response traits: shell size, aperture position) or trophic role (effect traits: mixotrophy, aperture size controlling prey range).
During the disturbance phase, the mixotrophic species Hyalosphenia papilio dominated the wet and intermediate plots, while the com-munity shifted to a dominance of “dry indicators” (Corythion dubium, Nebela tincta, Cryptodifflugia oviformis) and corresponding traits (loss of mixotrophy, and dominance of smaller taxa with ventral or ventral-central aperture) in dry plots. During the recovery phase we observed two contrasted trends in the previously wet and intermediate plots: communities remained similar where the Sphagnum carpet remained intact but species and traits indicators of drier conditions increased in plots where it had degraded. In the former dry plots, indica-tors and traits of wet conditions increased by the end of the experiment.
This is one of the first experiment simulating a disturbance and subsequent recovery in ex-situ mesocosms of Sphagnum peatland focus-ing on the response of testate amoebae community structure as well as functional traits to water table manipulation. The results generally confirmed that testate amoebae respond within a few months to hydrological changes and thus represent useful bioindicators for assessing current and past hydrological changes in Sphagnum peatlands.
Keywords: Mesocosm experiment, Testate amoebae, Functional traits, Recovery, Disturbance, Sphagnum peatlands, bio-indicators, water
table depth.
Address for correspondence: Isabelle Koenig, Laboratory of Soil Biodiversity, University of Neuchâtel, Rue Emile-Argand 11, CH-2000 Neuchâtel, Switzerland; E-mail: [email protected]
INTRODUCTION
The increasing influence of human activities on the
biosphere makes it necessary to assess how direct and
indirect impacts are affecting ecosystems (MEA 2005).
Biomonitoring is an efficient approach for evaluating
environmental condition in general and specifically the
impact of perturbation but also ecosystem restoration
and recovery (MEA 2005; Bonnett et al. 2011;
Nor-ris et al. 2011; Church et al. 2014; Bonn et al. 2016).
Bioindicator taxa must be sensitive enough to rapidly
response to environmental changes, and have
meas-urable characteristics (e.g. community composition,
morphology, or function) that are correlated to relevant
processes (e.g. C sequestration, Niemi and McDonald
2004; Payne 2013). Protists play essential functional
roles and are useful bioindicators in aquatic as well as
terrestrial ecosystems (Caron et al. 2009; Norris et al.
2011; Pinto et al. 2014). Our focus here is on the use of
testate amoebae living in Sphagnum peatlands as
indi-cators of hydrological changes.
Testate amoebae are a polyphyletic group of
unicel-lular protists which build a shell, termed a test. Although
they are generally studied as a homogeneous ecological
and functional group, they belong to three phylogenetic
groups, each of which has specific morphological traits:
1) Arcellinida (Kosakyan et al. 2016), with “lobose”
(wide) pseudopods, 2) Euglyphida (Cavalier-Smith and
Chao 2003), with “filose” (narrow) pseudopods and
(for most of the group) a test produced of
self-secret-ed silica scales (idiosomes), both groups with a single
pseudostome (aperture) to the test and 3)
Amphitremi-dae (Gomaa et al. 2013), with “filose” pseudopods and
two pseudostomes. Some taxa (in all three groups)
pos-sess photosynthetic endosymbionts (i.e. they are
mixo-trophic). Identification is based on test characteristics,
thus allowing the use of this group in palaeoecological
studies (Charman 2001). Tests are made of
self-secret-ed protein, self-secretself-secret-ed silica plates (idiosomes) or an
agglutination (xenosomes) of either prey (diatom
frus-tules, euglyphid plates, i.e. kleptoplastidy – Lahr et al.
2015) or mineral particles present locally (Ogden and
Hedley 1980; Delaine et al. 2017). Testate amoebae are
a dominant group of micro-organisms in wet and humid
environments (Gilbert et al. 1998; Gilbert and
Mitch-ell 2006) and play a central role in soil microbial food
webs and C cycling in Sphagnum peatlands (Wilkinson
and Mitchell 2010; Jassey et al. 2015). Their
communi-ty structure is correlated with key environmental
gradi-ent such as humidity (generally measured as water table
depth), pH, or nutrient richness (Mitchell et al. 2008).
In addition to classical taxonomy-based
approach-es, changes in communities may be studied within the
functional diversity framework. This approach aims
at understanding the links between well selected
mor-phological / behavioural traits and environmental
con-straint (Lavorel and Garnier 2002; Violle et al. 2007).
The functional diversity framework was developed
ini-tially for plants, macro-invertebrates and fish and was
more recently been applied to micro-eukaryotes and
especially testate amoebae (Fournier et al. 2012, 2015;
Arrieira et al. 2015; Kajukało et al. 2016; Marcisz et al.
2016). Selected morphological and physiological traits
have been shown to be linked to hydrological gradients
(Fournier et al. 2012). As functional traits are
direct-ly linked to ongoing processes, they could be used to
monitor ecosystem functioning and give information on
ecological niche dimensions (Mouillot et al. 2007; Holt
2009; Kearney et al. 2010).
To be useful, functional traits must be 1) related to
known ecological processes and 2) measurable at the
species level (Violle et al. 2007; Mlambo 2014). In
practice, traits are most often selected based on
cor-relations identified in observational ecological studies.
Such correlations should ideally be further tested using
controlled experiments to link traits to specific
environ-mental changes. Mesocosm experiments provide the
necessary level of control to assess how selected traits
respond to manipulation, while other variables are kept
(approximately) constant in the different treatments
(Benton et al. 2007).
This study is the follow-up of a twenty months
me-socosm experimental study in which we assessed the
responses of testate amoeba communities to
manipu-lated water levels (–4 cm, –15 cm, –25 cm, Koenig
et al. 2018). At the end of the experiment, the
meso-cosms were kept in operation, providing the
opportu-nity for further experimentation. We adjusted the
wa-ter level to –10 cm in all mesocosms to assess how the
testate amoeba communities may recover post-stress
and to compare the taxonomic and functional trait
re-sponses over the two phases of the overall experiment.
We hypothesised that the strongest changes during the
recovery experiment would be observed in the
previ-ously driest plots (–25 cm) as these experienced the
highest contrast in both the first and second phase of
the experiment.
MATERIAL AND METHODS
Experimental design
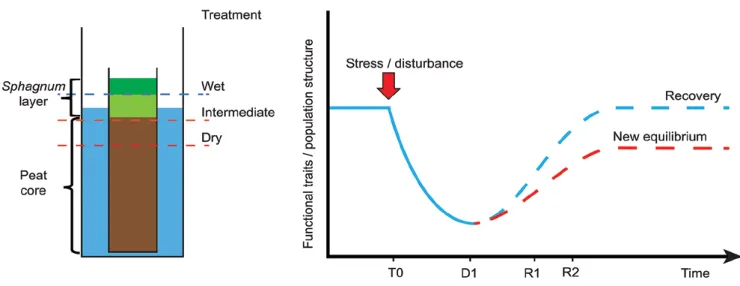
We set up a mesocosm experiment to simulate the effect of wa-ter table changes on Sphagnum-peatlands. Mesocosms consisted of tanks filled with water (Fig. 1). In each tank a pierced PVC tube (45 cm high, 12 cm diameter) was filled with a peat core topped with a carpet of Sphagnum fallax (Mulot et al. 2015). The system allowed the manipulation of the water level independently in each mesocosm. The Sphagnum carpets were collected simultaneously on the same Sphagnum patch, in the Creux de l’Epral peatland, Canton du Jura (47°12’18.3”N; 006°56’05.83”E; elevation: 990 m a.s.l.). At the beginning of the experiment (T0 – 02/08/2012), all plots were seeded with a water extract from pool, hummock and lawn to provide the full community potential as describe in Mulot
et al. (2015). The water table was set at –4 cm (wet treatment – W),
–15 cm (intermediate treatment – I) and –25 cm (dry treatment – D), with five replicates of each treatment. On 27/03/2015 the water level was set at –10 cm in all mesocosms (i.e. beginning of recovery phase). To assess the impact of water table changes, samples were extracted on 27/03/2014 (D1, 18 month after the beginning of the experiment), then on 18/05/2015 (R1, two months after equalisa-tion of water table) and on 24/09/2015 (R2, six month after equali-sation, Fig. 1). At each sampling date, we collected the top three centimetres of Sphagnum stems. The samples were refrigerated on the same day at 4°C, fixed with Glutaraldehyde 5% (C5H8O2) on the same or the day after, and stored at 4°C in the dark until the extraction. Sample codes indicate treatment, replicate and sampling date, e.g. D4_R2 corresponds dry treatment, replicate 4 sampled on 24/09/2015.
Testate amoeba isolation and characterization
Testate amoebae were extracted by sieving and back-sieving through mesh filters (15–200 µm, Booth et al. 2010; Jassey et al. 2011). We aimed for minimum counts of 100 individuals per sample with living and empty tests pooled together. In some plots, espe-cially where the structure of the moss carpet had been degraded by the experimental conditions, testate amoeba density was very low and less than 50 individuals were counted (D2_D1: 47 ind.; D4_D1: 29 ind.; W2_D1: 28 ind.; W2_R1: 17 ind.). Identification was based on the keys of Charman et al. (2000) and Mitchell (2003) at the species or species complex level. Some taxa were grouped into broader morphological groups, in particular taxa from the
Ne-bela tincta group (Kosakyan et al. 2013). Cyclopyxis arcelloides
includes Cyclopyxis kahli (found only in one sample at R2) and
C. eurystoma. Heleopera sylvatica includes H. petricola. To reduce
the impact of rare species, taxa that did not exceed a mean of 3% in one treatment at one sampling time (n = 5) were not included in the analyses (Argynnia dentistoma, Assulina seminulum, Bullinularia
indica, Cryptodifflugia sacculus, Heleopera sphagni, Hyalosphenia elegans, Plagiopyxis labiata, Sphenoderia lenta, Trigonopyxis ar-cula, Trinema complanatum and Wailesella eboracencis).
Functional traits
To be truly functional, traits should be directly or indirectly related to known processes or at least strongly expected to follow change in niche dimension (Lavorel and Garnier 2002; Messier
et al. 2010; Mlambo 2014). We selected traits expected to indicated
adaptations to water stress (response traits) and traits which are known to impact on food web structure (effect traits, Table 1). Test compression, an aperture in a ventral position and small biovolume allow amoebae to stay active in thin water films (Laggoun-Defarge
et al. 2008; Fournier et al. 2012; Tsyganov et al. 2012). Mixotrophy
is believed to be an adaptation to low nutrient availability (Fournier
et al. 2012; Jassey et al. 2013a) while test material informs on the
abundance of mineral particles or prey incorporated in test construc-tion (Gilbert et al. 2003; Gilbert and Mitchell 2006; Jassey et al. 2011; Schwind et al. 2016). Finally, aperture size has been demon-strated to be correlated to prey size and thus the trophic level, small apertures corresponding to microbial feeder and large apertures to predator of micro-eukaryotes and micro-metazoan (Jassey et al. 2013a; Gomaa et al. 2014). Morphological dimensions were mea-sured directly at 400× magnification, on a subset of ten randomly chosen individuals, using an inverted IX-81 Olympus microscope, and the Olympus cellSens dimension software. Biovolume was cal-culated according to the general shape of the shell, applying the formulas of Fournier et al. (2015).
Numerical analyses
Gradient analyses
The structure and temporal changes of the testate amoeba com-munities in the three treatments was first assessed based on the relative abundance of species over time. To illustrate the change in each community structure in response to the treatment, species were classified according to their optimal water table depth. These optima were calculated with a transfer function (weighted averaging regression) based on an independent dataset (Mitchell et al. 1999), in which the Creux de l’Epral bog was included.
We then computed the community weighted mean (CWM) of selected traits (biovolume, aperture position, test compression, test composition, mixotrophy and aperture size) in each sample. CWM represented the average of each trait value weighted by the relative abundance of each species (Dray and Legendre 2008; Ricotta and Moretti 2011).
We analysed the temporal patterns of community structure and community weighted mean of functional traits using principal com-ponent analyses (PCA) in which we passively projected treatment and time. Prior to PCA, the species dataset was Hellinger trans-formed according to Legendre and Gallagher (2001) and the CWM of traits dataset was standardised. Permutational multivariate analy-sis of variance (PERMANOVA) was used to assess the difference in testate amoeba community structure between sampling times for each treatment separately. This analysis partitions dissimilari-ties between groups and tests the significance of those partitioning (Anderson 2001; Oksanen 2015). We used a Bray-Curtis distance matrix of relative abundance of species with 999 permutations. The significance of any difference between sampling occasions for com-munity weighted mean of traits was tested by analyses of variance with random effect and Tukey multiple comparisons of mean (Bon-ferroni correction), for each treatment separately.
Null models for functional diversity
Two main processes may drive community assembly processes (and hence explain community structure): change in niche dimen-sion (habitat selection) and competition between species (biotic
in-Fig. 1. Left: schematic cross-section through a mesocosm showing the peat and Sphagnum layer. Right: expected evolution of community
structure or traits over the stress and recovery phases. At the onset of the experiment (T0) the community included the whole range of spe-cies living in pool, lawn and hummock, taken in a natural Sphagnum peatland. D1 is the point of maximum disturbance effect and R1 and R2 are sampling points during the recovery phase. Dotted lines represented the possible evolution of both species community structure and community weighted mean of functional traits in response to disturbance. Full recovery depended on the survival potential of species. The new equilibrium represents the situation when the local conditions or present species pool do not allow a fully recovery of original state. In our case this is due to the fact that some species are likely to be lost during the disturbance phase.
teraction). To disentangle these two processes, recent studies have suggested using null models (Webb et al. 2006; Mason et al. 2008; Cavender-Bares et al. 2009; Chase et al. 2011). As the niche dimen-sion could be inferred from the community weighted mean of traits (Kearney et al. 2010), measuring the distance between the CWM calculated with the real dataset and a CWM constructed with a ran-dom community should indicate if the ongoing processes are related to habitat selection or to biotic interaction. The standardized effect size of mean pairwise distance (ses.mpd) compares the observed distance separating samples based on species community structure in relation with the pool of functional traits, and the same distance based on a random community matrix with respect to the species richness of the original community and the original traits matrix (Kembel et al. 2010). The standardized effect size is calculated by:
(
)
(
)
. = null − observed null mean M M ses mpd sd M (1)where Mnull = randomized mean pairwise distance, Mobserved =
observed pairwise distance, sd(Mnull) = standard deviation of ran-domized pairwise distance (Kembel et al. 2010). When ses.mpd is significantly lower than expected by chance, the main drivers of community structure are related to habitat filtering; when it is sig-nificantly higher, biotic factors are more likely to be the driver. As the trait matrix included binary variables, semi-quantitative factors and quantitative traits, the Gower distance was applied, using the method of Podani (1999) for ordinal variables (Gower 1971).
All analyses were carried out with the R statistical software (R Core Team 2016). Ordinations were computed using the
pack-age vegan (Oksanen 2015). The community weighted mean of func-tional traits was calculated using the package FD (Laliberté et al. 2014). Standardized effect size and null models were computed with package Picante (Kembel et al. 2010) and optima and tolerance of species were calculated with the package rioja (Juggins 2015).
RESULTS
Testate amoeba community composition and
treat-ment effects on community structure
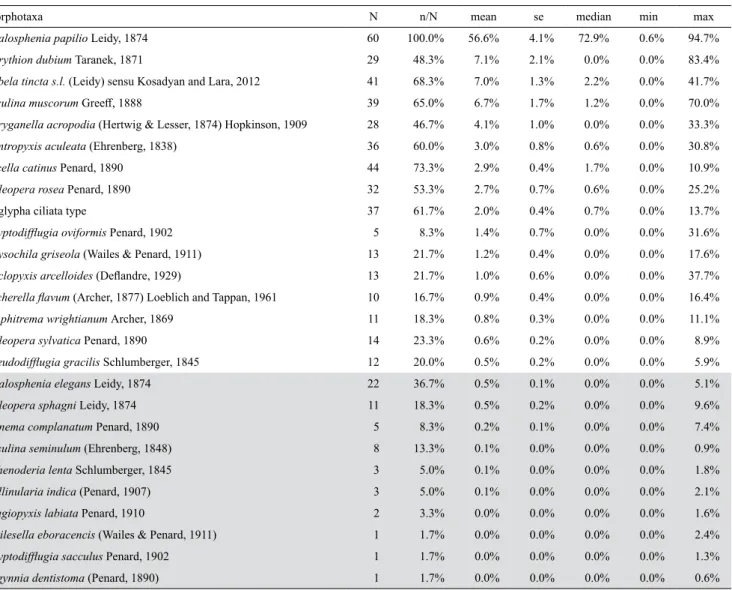
We identified a total of 26 testate amoeba
morpho-taxa in the 60 analysed samples (Table 2).
Hyalosphe-nia papilio was the only taxon found in all samples and
the most abundant overall, accounting for over half for
the community on average and with a median
abun-dance of 72.9%. Corythion dubium, Nebela tincta s.l.,
Assulina muscorum, Phryganella acropodia,
Centro-pyxis aculeata, Arcella catinus, Heleopera rosea, and
Euglypha ciliata each contributed > 2% of the overall
community and occurred in > 45% of all samples
(Ta-ble 2). Eighteen other morphotaxa were less abundant
and frequent (Table 2).
The three treatments had contrasted effects on the
species richness, relative abundance of individual taxa
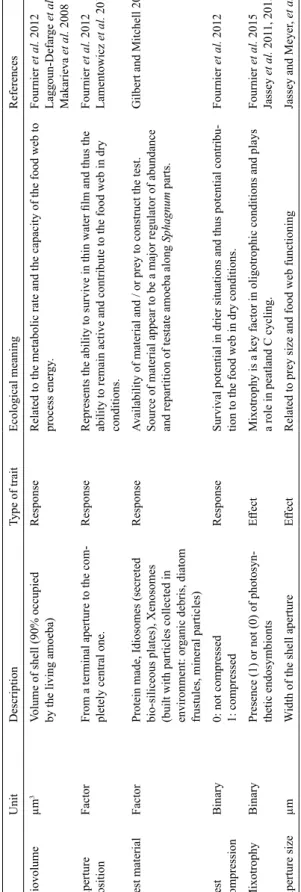
Table 1.
Description, ecological meaning and references for the six functional traits selected for testate amoebae.
Unit Description Type of trait Ecological meaning References Biovolume µm 3
Volume of shell (90% occupied by the living amoeba)
Response
Related to the metabolic rate and the capacity of the food web to process ener
gy . Fournier et al. 2012 Laggoun-Defar ge et al. 2008 Makarieva et al. 2008 Aperture position Factor
From a terminal aperture to the com
-pletely central one.
Response
Represents the ability to survive in thin water film and thus the ability to remain active and contribute to the food web in dry conditions.
Fournier et al. 2012 Lamentowicz et al. 2015 Test material Factor
Protein made, Idiosomes (secreted bio-siliceous plates), Xenosomes (built with particles collected in environment: or
ganic debris, diatom
frustules, mineral particles)
Response
Availability of material and / or prey to construct the test. Source of material appear to be a major regulator of abundance and repartition of testate amoeba along
Sphagnum
parts.
Gilbert and Mitchell 2006
Test compression
Binary
0: not compressed 1: compressed
Response
Survival potential in drier situations and thus potential contribu
-tion to the food web in dry condi-tions.
Fournier
et al.
2012
Mixotrophy
Binary
Presence (1) or not (0) of photosyn
-thetic endosymbionts
Effect
Mixotrophy is a key factor in oligotrophic conditions and plays a role in peatland C cycling.
Fournier et al. 2015 Jassey et al. 201 1, 2015 Aperture size µm W
idth of the shell aperture
Effect
Related to prey size and food web functioning
Jassey and Meyer
, et al.
2013
(Table 3) and community structure (Fig. 2a). At T0
com-munities were strongly dominated by H. papilio, and
did not significantly differ among treatments (Fig. 2a).
Within each treatment, the community structure changed
significantly over the duration of the whole experiment
(multivariate analyse of variance, dry plots R
2: 58.5%,
p-value 0.001; intermediate plots R
2: 40.1%, p-value
0.001; wet plots R
2:36.8%, p-value 0.016, Table 4).
In dry plots, the species richness increased
signifi-cantly from 5.2 taxa at T0 to 10.2 taxa at R1 (ANOVA
p-adjusted T0-R1: 0.002) and 10.6 taxa at R2 (ANOVA
p-adjusted T0-R2: 0.002) and the community structure
diverged from the wet and intermediate plots (Fig. 2a,
left of the diagram). At D1, the community was
dom-inated by N. tincta, H. rosea, and C. dubium. By R1
H. papilio declined sharply (to 6.7% on average) and
the community was dominated by C. dubium, N.
tinc-ta, and Cryptodifflugia oviformis. By R2, community
structure was again similar to that of D1: H. papilio was
again more abundant (23.6%) and the community was
co-dominated by N. tincta (15.2%), H. rosea (12.2%),
Physochila griseola, Cyclopyxis arcelloides, C.
acu-leata and A. muscorum (7.8–8.6%). This was the most
balanced community in the entire experiment.
Species richness did not change significantly
be-tween wet and intermediate treatments. The
commu-nity structure in these two treatments shifted from T0
to D1 with increasing representation of P. acropodia
and A. muscorum (Fig. 2a, bottom right quadrat of the
ordination diagram). At the start of the recovery period,
the community structure diverged between two groups
of samples. The communities of six samples (I1, I2, I4,
I5, W1, W3) were still dominated by H. papilio, but to
a less extent, together with A. muscorum and P.
acropo-dia still abundant during the recovery period. The last
four samples (I3, W2, W4, W5, labelled on the PCA)
diverged towards a dominance of A. muscorum and
C. dubium and an almost complete desappearance of
H. papilio (centre of the diagram); the communities in
these plots were more similar to those of dry plots at
D1 and R1. W2 should be interpreted very carefully at
R1 as only 18 individuals were counted; total count was
higher at R2 (117 individuals) but with a different
com-munity structure, very close to that of the dry plots.
Treatment effects on testate amoeba functional
traits
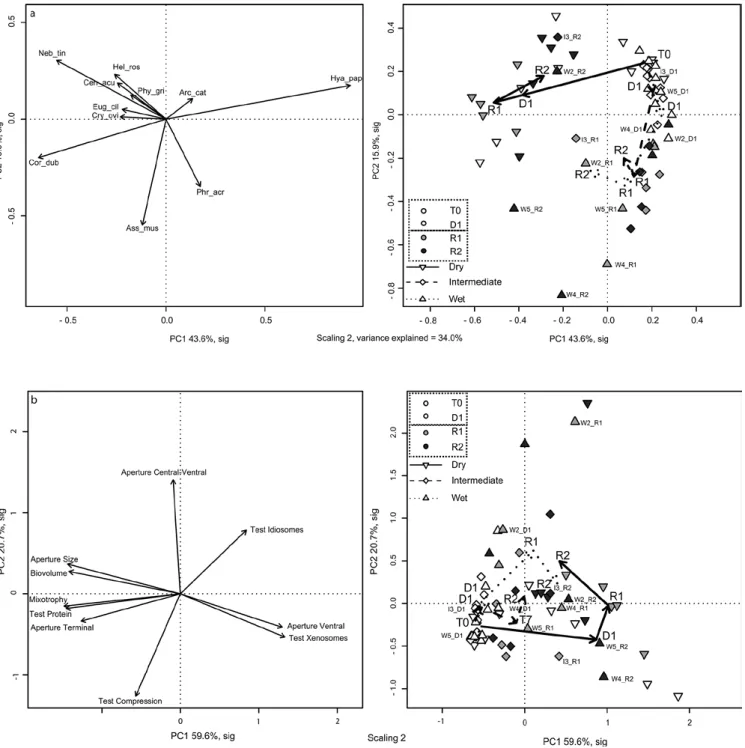
The first two axes of the PCA based on the
communi-ty weighted mean (CWM) of functional traits (Fig. 2b)
explained over 80% of the variance in the data (axis 1 =
59.6%, axis 2 = 20.7%). As axis 2 was significant based
on the Kaiser-Guttmann rule (Kaiser 1991) but just not
significant according to the broken stick model
(Mac-Arthur 1957), we decided to interpret both axes, as
bro-ken stick models often underestimate the significance
(Cangelosi and Goriely 2007). The three treatments
showed contrasting temporal patterns in the CWM
or-dination space. At T0 all treatments were represented
by a high proportion of mixotrophic species (left of
the diagram), a compressed, proteinaceous test, with a
terminal aperture and a large biovolume, reflecting the
dominance of H. papilio. In the Intermediate treatment,
no strong change was observed. In the wet plots, a shift
was observed towards taxa with smaller biovolume and
aperture size, tests constructed of xenosomes and
idi-osomes and a ventral position of the aperture (axis 2).
As for the community biplot (Fig. 2a), samples from the
wet plots diverged in the recovery phase (R1 and R2).
Two plots (W2 and W3) were correlated to a
ventral-central aperture, with non-compressed, idiosomes tests.
Two others (W4 and W5) were correlated to small taxa
with a small ventral aperture and a test built from
xeno-somes, while the last one (W1) remained at the centre
of the plot. In dry plots, the CWM of traits shifted
to-wards small species, with small, ventral pseudostomes
and compressed tests made with xenosomes at D1,
corresponding to the maximal effect of the treatment.
After restoring the hydrological conditions, the CWM
of traits shifted back towards larger species, with a
cen-tral-ventral aperture and idiosomes tests.
Changes in the standardised effect size of mean
pairwise distance (ses.mpd) based on species traits are
shown for each plot (Fig. 3). In dry plots, the trend was
negative from D1 onwards: all replicates and sampling
dates but one showed negative values as compared to
the null model, two of these plots being significantly
different from the null model. In wet plots, the trend
was towards a positive distance from the null model
but two samples (W2 and W5) showed the opposite at
R2, again illustrating the high dispersion of responses
in this treatment. In intermediate plots, no clear trend
was visible.
DISCUSSION
Our aim was to assess the resilience capacity of the
Sphagnum testate amoeba community following an
ex-perimental hydrological perturbation which included
three treatments. The duration of the disturbance period
was long enough (almost three years) to induce a deep
change in mesocosm functioning. In dry samples, the
mineralisation of peat was obvious and Sphagnum
fal-lax was replaced by other bryophytes, or vascular plants
(especially ferns), similar to most drained peatlands in
Switzerland (Grosvernier et al. 1997; Graf et al. 2007).
Our results showed that the duration of the
pertur-bation (i.e. thirty-two months) was clearly sufficient to
allow both the S. fallax moss (i.e. amoeba habitat) and
their associated microbial communities (among which
testate amoebae) to respond first to the experimental
hydrological perturbation and second to the
experimen-tal “restoration”. Both the testate amoeba community
structure and community weighted mean of functional
traits reacted within one growing season to conditions
comparable to restoration. The response patterns we
observed are generally in line with known ecological
preferences of species derived from observational and
experimental studies (Marcisz et al. 2014).
Community structure and response to water table
changes
At the beginning of the experiment, the community
was dominated by Hyalosphenia papilio, a frequently
dominant taxon in oligotrophic Sphagnum peatlands
and especially S. fallax poor-fens (Lamentowicz and
Mitchell 2005; Opravilova and Hajek 2006; Jassey et
al. 2013b).
In the dry treatment, the community structure
shift-ed by D1, as expectshift-ed, towards a dominance of taxa
characteristic for drier conditions: Nebela tincta s.l.,
Corythion dubium, Assulina seminulum, Centropyxis
aculeate (Mitchell et al. 1999; Bobrov et al. 1999;
Lamentowicz and Mitchell 2005; Qin et al. 2013;
Amesbury et al. 2016), which is similar to the
commu-nity structure observed in early stages of spontaneous
cutover bog regeneration (Buttler et al. 1996; Laggoun-
Defarge et al. 2008). Simultaneously, Archerella
fla-vum, a mixotrophic taxa characteristic for moderately
wet micro-habitats (Mazei et al. 2009), disappeared
completely in the dry plots. This effect remained until
R1 and some recovery became clear by R2 (Mitchell
et al. 1999, Mazei et al. 2009). The increase in species
richness at R1 and R2 suggests that some taxa were not
detected at T0, possibly due to the strong dominance of
H. papilio, but were recorded at R1 and R2 when this
species decreased.
Unlike dry plots, neither the intermediate nor the
wet treatments showed a clear change in community
Table 2. List of testate amoeba taxa, number and relative frequency of occurrence, mean, standard error (se), median, minimum and
maxi-mum relative abundance. Taxa are ordered by mean relative abundance over the four sampling times and within all treatment (n = 60). Rare taxa (i.e. maximum abundance in any single treatment and time < 3%) are indicated in grey and were excluded from numerical analyses.
Morphotaxa N n/N mean se median min max
Hyalosphenia papilio Leidy, 1874 60 100.0% 56.6% 4.1% 72.9% 0.6% 94.7%
Corythion dubium Taranek, 1871 29 48.3% 7.1% 2.1% 0.0% 0.0% 83.4%
Nebela tincta s.l. (Leidy) sensu Kosadyan and Lara, 2012 41 68.3% 7.0% 1.3% 2.2% 0.0% 41.7%
Assulina muscorum Greeff, 1888 39 65.0% 6.7% 1.7% 1.2% 0.0% 70.0%
Phryganella acropodia (Hertwig & Lesser, 1874) Hopkinson, 1909 28 46.7% 4.1% 1.0% 0.0% 0.0% 33.3%
Centropyxis aculeata (Ehrenberg, 1838) 36 60.0% 3.0% 0.8% 0.6% 0.0% 30.8%
Arcella catinus Penard, 1890 44 73.3% 2.9% 0.4% 1.7% 0.0% 10.9%
Heleopera rosea Penard, 1890 32 53.3% 2.7% 0.7% 0.6% 0.0% 25.2%
Euglypha ciliata type 37 61.7% 2.0% 0.4% 0.7% 0.0% 13.7%
Cryptodifflugia oviformis Penard, 1902 5 8.3% 1.4% 0.7% 0.0% 0.0% 31.6%
Physochila griseola (Wailes & Penard, 1911) 13 21.7% 1.2% 0.4% 0.0% 0.0% 17.6%
Cyclopyxis arcelloides (Deflandre, 1929) 13 21.7% 1.0% 0.6% 0.0% 0.0% 37.7%
Archerella flavum (Archer, 1877) Loeblich and Tappan, 1961 10 16.7% 0.9% 0.4% 0.0% 0.0% 16.4%
Amphitrema wrightianum Archer, 1869 11 18.3% 0.8% 0.3% 0.0% 0.0% 11.1%
Heleopera sylvatica Penard, 1890 14 23.3% 0.6% 0.2% 0.0% 0.0% 8.9%
Pseudodifflugia gracilis Schlumberger, 1845 12 20.0% 0.5% 0.2% 0.0% 0.0% 5.9%
Hyalosphenia elegans Leidy, 1874 22 36.7% 0.5% 0.1% 0.0% 0.0% 5.1%
Heleopera sphagni Leidy, 1874 11 18.3% 0.5% 0.2% 0.0% 0.0% 9.6%
Trinema complanatum Penard, 1890 5 8.3% 0.2% 0.1% 0.0% 0.0% 7.4%
Assulina seminulum (Ehrenberg, 1848) 8 13.3% 0.1% 0.0% 0.0% 0.0% 0.9%
Sphenoderia lenta Schlumberger, 1845 3 5.0% 0.1% 0.0% 0.0% 0.0% 1.8%
Bullinularia indica (Penard, 1907) 3 5.0% 0.1% 0.0% 0.0% 0.0% 2.1%
Plagiopyxis labiata Penard, 1910 2 3.3% 0.0% 0.0% 0.0% 0.0% 1.6%
Wailesella eboracencis (Wailes & Penard, 1911) 1 1.7% 0.0% 0.0% 0.0% 0.0% 2.4%
Cryptodifflugia sacculus Penard, 1902 1 1.7% 0.0% 0.0% 0.0% 0.0% 1.3%
Argynnia dentistoma (Penard, 1890) 1 1.7% 0.0% 0.0% 0.0% 0.0% 0.6%
composition during the disturbance period (T0-D1). It
seems that the water level contrast between the
interme-diate and wet treatments was not high enough to affect
the population dynamics of H. papilio and the
commu-nity structure thus remained similar in both treatments
until D1. This lack of contrasted response of H. papilio
between these two treatments is in line with the
rela-tively wide tolerance of these taxon to water level
(Ta-ble 3) (Lamentowicz et al. 2008; Booth and Meyers
2010; Turner et al. 2013). Previous studies have shown
that although H. papilio is most frequent in
Sphagnum-dominated poor fens it could also be found in relatively
dry habitats (Heal 1964; Payne et al. 2008). This could
be explained by the presence of cryptic species inside
the H. papilio morphological taxon (Heger et al. 2013;
Mulot et al. 2017) with different ecological preferences.
During the recovery phase, with a mean water table
position at –10 cm, the relative abundance of H. papilio
declined and that of several taxa related to drier
con-ditions (i.e. Assulina muscorum, Phryganella
acropo-dia, Mitchell et al. 1999; Bobrov et al. 1999) increased
(Fig. 4). However, two patterns were observed (Fig 2a):
the community structure of some wet and
intermedi-ate plots changed and became similar to that of the dry
treatment, while the other wet and intermediate plots
remained relatively stable during this phase, despite
Fig. 2. Principal component analyses (PCA) of a) testate amoeba species and b) community weighted mean (CWM) of functional traits
in Sphagnum fallax from a mesocosm experiment simulating water table changes. The species dataset was Hellinger transformed and the CWM data were scaled. Projection of descriptors (left) and samples (right), scaling 2. On the right plots, arrows represent the time line for each treatment (mean coordinates of the five sampling plots of each treatment and time). In both PCAs, axes 1 and 2 were the only signifi-cant axes and accounted respectively for 60.4% (species based) and 80.2% (CWM based) of the variance. Characteristic plots for wet and intermediate treatments were labelled. Taxa abbreviations: Amp_wri: Amphitrema wrightianum, Pse_gra: Pseudodifflugia gracilis, Arc_fla:
Archerella flavum, Cyc_arc: Cyclopyxis arcelloides, Phy_gri: Physochila griseola, Hya_pap: Hyalosphenia papilio, Cen_acu: Centropyxis aculeata, Hel_syl: Heleopera sylvatica, Cry_ovi: Cryptodifflugia oviformis, Eug_cil: Euglypha ciliata, Phr_acr: Phryganella acropodia,
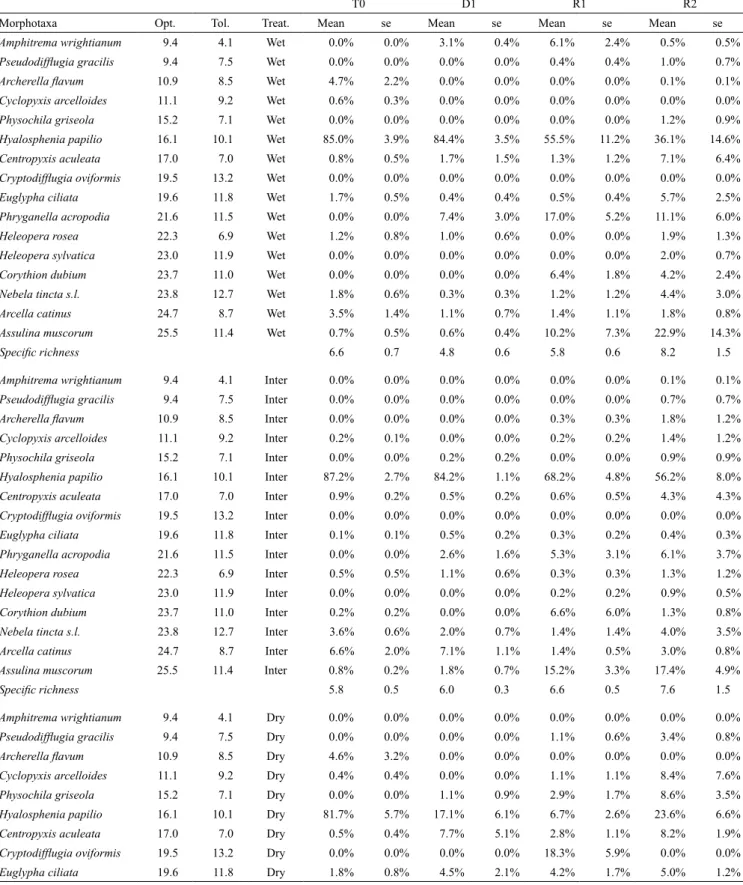
Table 3. Mean relative abundance and standard error (se, n = 5) and species richness of testate amoeba taxa in Sphagnum fallax from a
me-socosm experiment at four sampling time, detail for the three treatments (dry, intermediate, and wet). T0: onset of the experiment, D1: after eight months of treatment, R1 and R2: after three, and six months maintaining the water level –10 cm. Taxa are listed in increasing water table depth optimum (Opt). The difference in mean species richness was only significant in the dry treatment between T0-R1 and T0-R2 (ANOVA and Tukey HSD test, in bold).
T0 D1 R1 R2
Morphotaxa Opt. Tol. Treat. Mean se Mean se Mean se Mean se
Amphitrema wrightianum 9.4 4.1 Wet 0.0% 0.0% 3.1% 0.4% 6.1% 2.4% 0.5% 0.5%
Pseudodifflugia gracilis 9.4 7.5 Wet 0.0% 0.0% 0.0% 0.0% 0.4% 0.4% 1.0% 0.7%
Archerella flavum 10.9 8.5 Wet 4.7% 2.2% 0.0% 0.0% 0.0% 0.0% 0.1% 0.1%
Cyclopyxis arcelloides 11.1 9.2 Wet 0.6% 0.3% 0.0% 0.0% 0.0% 0.0% 0.0% 0.0%
Physochila griseola 15.2 7.1 Wet 0.0% 0.0% 0.0% 0.0% 0.0% 0.0% 1.2% 0.9%
Hyalosphenia papilio 16.1 10.1 Wet 85.0% 3.9% 84.4% 3.5% 55.5% 11.2% 36.1% 14.6%
Centropyxis aculeata 17.0 7.0 Wet 0.8% 0.5% 1.7% 1.5% 1.3% 1.2% 7.1% 6.4%
Cryptodifflugia oviformis 19.5 13.2 Wet 0.0% 0.0% 0.0% 0.0% 0.0% 0.0% 0.0% 0.0%
Euglypha ciliata 19.6 11.8 Wet 1.7% 0.5% 0.4% 0.4% 0.5% 0.4% 5.7% 2.5%
Phryganella acropodia 21.6 11.5 Wet 0.0% 0.0% 7.4% 3.0% 17.0% 5.2% 11.1% 6.0%
Heleopera rosea 22.3 6.9 Wet 1.2% 0.8% 1.0% 0.6% 0.0% 0.0% 1.9% 1.3%
Heleopera sylvatica 23.0 11.9 Wet 0.0% 0.0% 0.0% 0.0% 0.0% 0.0% 2.0% 0.7%
Corythion dubium 23.7 11.0 Wet 0.0% 0.0% 0.0% 0.0% 6.4% 1.8% 4.2% 2.4%
Nebela tincta s.l. 23.8 12.7 Wet 1.8% 0.6% 0.3% 0.3% 1.2% 1.2% 4.4% 3.0%
Arcella catinus 24.7 8.7 Wet 3.5% 1.4% 1.1% 0.7% 1.4% 1.1% 1.8% 0.8%
Assulina muscorum 25.5 11.4 Wet 0.7% 0.5% 0.6% 0.4% 10.2% 7.3% 22.9% 14.3%
Specific richness 6.6 0.7 4.8 0.6 5.8 0.6 8.2 1.5
Amphitrema wrightianum 9.4 4.1 Inter 0.0% 0.0% 0.0% 0.0% 0.0% 0.0% 0.1% 0.1%
Pseudodifflugia gracilis 9.4 7.5 Inter 0.0% 0.0% 0.0% 0.0% 0.0% 0.0% 0.7% 0.7%
Archerella flavum 10.9 8.5 Inter 0.0% 0.0% 0.0% 0.0% 0.3% 0.3% 1.8% 1.2%
Cyclopyxis arcelloides 11.1 9.2 Inter 0.2% 0.1% 0.0% 0.0% 0.2% 0.2% 1.4% 1.2%
Physochila griseola 15.2 7.1 Inter 0.0% 0.0% 0.2% 0.2% 0.0% 0.0% 0.9% 0.9%
Hyalosphenia papilio 16.1 10.1 Inter 87.2% 2.7% 84.2% 1.1% 68.2% 4.8% 56.2% 8.0%
Centropyxis aculeata 17.0 7.0 Inter 0.9% 0.2% 0.5% 0.2% 0.6% 0.5% 4.3% 4.3%
Cryptodifflugia oviformis 19.5 13.2 Inter 0.0% 0.0% 0.0% 0.0% 0.0% 0.0% 0.0% 0.0%
Euglypha ciliata 19.6 11.8 Inter 0.1% 0.1% 0.5% 0.2% 0.3% 0.2% 0.4% 0.3%
Phryganella acropodia 21.6 11.5 Inter 0.0% 0.0% 2.6% 1.6% 5.3% 3.1% 6.1% 3.7%
Heleopera rosea 22.3 6.9 Inter 0.5% 0.5% 1.1% 0.6% 0.3% 0.3% 1.3% 1.2%
Heleopera sylvatica 23.0 11.9 Inter 0.0% 0.0% 0.0% 0.0% 0.2% 0.2% 0.9% 0.5%
Corythion dubium 23.7 11.0 Inter 0.2% 0.2% 0.0% 0.0% 6.6% 6.0% 1.3% 0.8%
Nebela tincta s.l. 23.8 12.7 Inter 3.6% 0.6% 2.0% 0.7% 1.4% 1.4% 4.0% 3.5%
Arcella catinus 24.7 8.7 Inter 6.6% 2.0% 7.1% 1.1% 1.4% 0.5% 3.0% 0.8%
Assulina muscorum 25.5 11.4 Inter 0.8% 0.2% 1.8% 0.7% 15.2% 3.3% 17.4% 4.9%
Specific richness 5.8 0.5 6.0 0.3 6.6 0.5 7.6 1.5
Amphitrema wrightianum 9.4 4.1 Dry 0.0% 0.0% 0.0% 0.0% 0.0% 0.0% 0.0% 0.0%
Pseudodifflugia gracilis 9.4 7.5 Dry 0.0% 0.0% 0.0% 0.0% 1.1% 0.6% 3.4% 0.8%
Archerella flavum 10.9 8.5 Dry 4.6% 3.2% 0.0% 0.0% 0.0% 0.0% 0.0% 0.0%
Cyclopyxis arcelloides 11.1 9.2 Dry 0.4% 0.4% 0.0% 0.0% 1.1% 1.1% 8.4% 7.6%
Physochila griseola 15.2 7.1 Dry 0.0% 0.0% 1.1% 0.9% 2.9% 1.7% 8.6% 3.5%
Hyalosphenia papilio 16.1 10.1 Dry 81.7% 5.7% 17.1% 6.1% 6.7% 2.6% 23.6% 6.6%
Centropyxis aculeata 17.0 7.0 Dry 0.5% 0.4% 7.7% 5.1% 2.8% 1.1% 8.2% 1.9%
Cryptodifflugia oviformis 19.5 13.2 Dry 0.0% 0.0% 0.0% 0.0% 18.3% 5.9% 0.0% 0.0%
T0 D1 R1 R2 Morphotaxa Opt. Tol. Treat. Mean se Mean se Mean se Mean se
Phryganella acropodia 21.6 11.5 Dry 0.0% 0.0% 0.0% 0.0% 0.0% 0.0% 0.7% 0.3%
Heleopera rosea 22.3 6.9 Dry 0.7% 0.3% 9.2% 5.3% 3.7% 0.8% 12.2% 2.6%
Heleopera sylvatica 23.0 11.9 Dry 0.0% 0.0% 0.0% 0.0% 1.3% 1.0% 3.1% 1.7%
Corythion dubium 23.7 11.0 Dry 0.7% 0.7% 33.9% 16.5% 30.1% 9.4% 3.5% 1.7%
Nebela tincta s.l. 23.8 12.7 Dry 4.3% 1.9% 22.2% 5.9% 24.8% 6.6% 15.2% 1.8%
Arcella catinus 24.7 8.7 Dry 5.3% 2.0% 1.9% 0.8% 1.2% 0.8% 0.4% 0.2%
Assulina muscorum 25.5 11.4 Dry 0.0% 0.0% 2.3% 0.7% 1.9% 0.9% 7.8% 5.3%
Specific richness 5.2 0.9 7.4 0.4 10.2 0.7 10.6 0.5
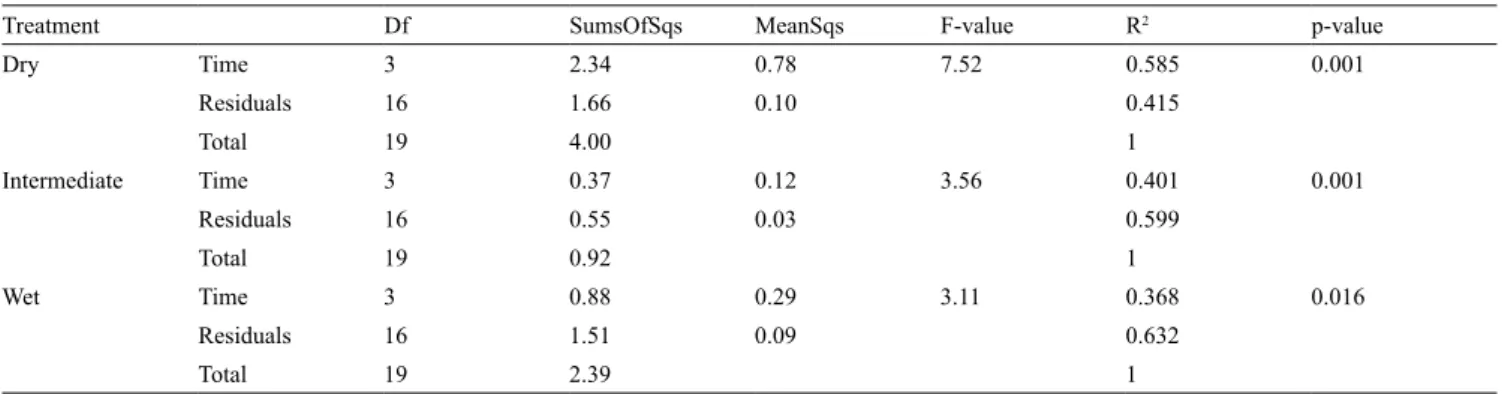
Table 4. Permutational multivariate analysis of variance of testate amoeba community dataset from Sphagnum fallax mesocosm experiment
simulating water table level changes by treatment and between sampling time. Sampling time was significantly different in all treatments.
Treatment Df SumsOfSqs MeanSqs F-value R2 p-value
Dry Time 3 2.34 0.78 7.52 0.585 0.001 Residuals 16 1.66 0.10 0.415 Total 19 4.00 1 Intermediate Time 3 0.37 0.12 3.56 0.401 0.001 Residuals 16 0.55 0.03 0.599 Total 19 0.92 1 Wet Time 3 0.88 0.29 3.11 0.368 0.016 Residuals 16 1.51 0.09 0.632 Total 19 2.39 1
Df – degree of freedom, SumOfSqs – sequencial sum of square, MeanSqs – mean square.
Fig. 3. Evolution of standardized effect size of mean pairwise distance between sampling plots relatively to a null model (random species
matrix with respect to observed species richness, see text for details) of testate amoeba community weighted mean (CWM) of functional trait data from a Sphagnum fallax mesocosm experiment simulating water table changes. The mean pairwise distance represents the distance separating communities based on the pool of functional traits. Horizontal grey dotted line represents p-value of 0.05, points below the line are significantly different from the null model. Each replicate was represented separately, with a grey scale.
a decrease of H. papilio. This unexpected trend is
how-ever coherent with the contrasted evolution of the
mes-ocosms (Suppl. Fig. 1–3). Indeed, when the water level
was moved to –10 cm in all plots, we observed that the
structure and vitality of the moss carpet had
consider-ably changed in some mesocosms. This was most clear
in dry treatments where the S. fallax carpet was almost
completely dead and partly replaced by other
bryo-phytes and ferns (Suppl. Fig. 2), but a similar situation
was also observed in some wet and intermediate plots.
At the end of the experiment, S. fallax recovered in
most of the plots (Suppl. Fig. 3).
Treatment effects on testate amoeba functional traits
The clear community shift in the dry treatment
cor-responded to a shift in traits with an increased
repre-sentation of smaller taxa, of shells with small ventral
pseudostomes, a loss of mixotrophy, and an increase in
idiosome and xenosome tests. These changes are in line
with the drier conditions and probable thinner water
films (Fournier et al. 2015; Payne et al. 2016; Marcisz
et al. 2016). The clear decrease in mixotrophy (related
to the diminution of H. papilio which was not replaced
by another mixotrophic taxa) indicates that mixotrophy
does not represent an advantage in drier conditions,
even when light availability remains constant.
Mixo-trophy has been shown to be related to nutrient content
and C cycling: a higher proportion of mixotrophs in
the community being associated with higher C fixation
(Jassey et al. 2013a, 2015). The reduction of
mixotro-phy thus indicates a potentially important functional
change in the testate amoeba community in the dry
plots during the disturbance phase. The shift in traits
also indicates a shift from eukaryvory (sensu Lahr et al.
2015, i.e. feeding on Eukaryotes such as protists,
mi-cro-metazoa, fungi and eukaryotic microalgae) towards
bacterivory, corresponding lowering of the trophic level
the community and suggesting a faster turnover of
car-bon and nutrients (Jassey et al. 2013b, 2015; Fournier
et al. 2015). During the recovery phase (R1–R2) in the
dry treatment, the shifts of both community structure
and traits towards the situation of T0 are in line with the
increased moisture.
The CWMs did not differ significantly between the
wet and intermediate treatments. In these two
treat-ments, changes occurred only after D1, with a slow
transition towards traits indicating drier conditions,
at least in some plots. CWMs of traits further suggest
that the vitality status of the Sphagnum layer was the
main driver in wet & intermediate plots (Suppl. Fig. 1)
while water table depth more strongly affected the
tes-tate amoeba community structure in the dry plots. This
is in line with previous observations on the strong role
of moisture conditions along the Sphagnum stem in
shaping testate amoeba communities: Actual moisture
conditions is a more likely driver of community
struc-ture than water level (Buttler et al. 1996; Mitchell et al.
1999; Booth 2001, 2002; Jassey et al. 2011; Payne et al.
2016), which also explains why transfer functions
typi-cally fail to predict very low water tables (e.g. lower
than 30 cm depth, Mitchell et al. 1999).
Community assembly: habitat filtering vs. biotic
factors
We used the null model approach to disentangle
biotic from abiotic drivers of community assembly.
Changes in ecological niche should impact on testate
amoeba community structure and this will be reflected
by the CWM of traits. The distance between sampling
plots (mean pairwise distance) should be significantly
lower than the random distance in plots where abiotic
drivers are more important than competition (Chase et
al. 2011; Fournier et al. 2012; Arrieira et al. 2015). In
our experiment, the trend in dry plots was negative
(sig-nificantly in two replicates, Fig. 3) and, indicated that
the community structure of testate amoeba was mainly
driven by environmental filters (Villéger et al. 2008).
The same pattern occurred in two replicates of the wet
treatment (W2 and W5), in line with the state of the
Sphagnum carpet in these plots. The shift toward
re-duced water saturation (related to dryness) imply an
im-portant constraint for the microbial communities living
in Sphagnum and, as one of the most important groups,
testate amoeba respond strongly to the change. The loss
of mixotrophy and the increase of smaller, mainly
bac-terivorous taxa indicate a drastic change in ecosystem
functioning with deep impact on nutrient and carbon
cycling (Jassey et al. 2013a, 2013b; Fournier et al.
2015). Thus, by using CWM of well selected traits, we
are able to highlight ongoing processes without prior
knowledge on species ecology.
CONCLUSION AND SUGGESTIONS
FOR FUTURE WORK
Our goal was to monitor the response of the
tes-tate amoeba community to a water level that had been
“restored” to a level comparable to natural Sphagnum
peatlands using a mesocosm experiment. Due to the
relatively small diameter of the mesocosms used in our
experiment (12 cm) the survival of Sphagnum mosses
cannot be guaranteed. Larger mesocosms would be
use-ful to conduct longer-term experiments, but at a higher
cost. The choice of the size is clearly a trade-off.
Fur-thermore, over the course of our experiment, the
dif-ferential growth of the mosses and mineralization of
the underlying peat caused the surface of the moss
car-pet to strongly diverge among treatments (ca. 20 cm
height difference by the end of the experiment), thus
creating additional microclimatic effects (shading).
Nevertheless, the survival of testate amoeba
communi-ties throughout the experiment, allowed us, for the first
time experimentally, to assess community recovery in
response to a raise in water level comparable with what
is aimed for in peatland restoration projects in open
ar-eas. Our study also illustrates the importance of taking
into consideration the changes in vegetation and
espe-cially the changes in Sphagnum cover. Sphagnum is
a well-known keystone genus in peatland ecology. To
this date few studies of peatland testate amoebae have
explored specifically the difference of testate amoeba
communities between Sphagnum and other mosses (e.g.
Opravilova and Hajek 2006; Lamentowicz et al. 2011;
Lizoňová and Horsák 2017). Our study suggests that
where Sphagnum is absent the relationship between
tes-tate amoeba communities and water table depth is not
the same as in Sphagnum carpet. This question deserves
to be studied further.
The response patterns of the community weighted
means of functional traits were similar to those of
tes-tate amoeba community structure and both were well
correlated to ecological constraints. Through the link
between the selected traits and the underlying
process-es, the CWM approach give information on local
pro-cesses which complemented and sometimes explained
the shift in community structure, as noted for the
di-verging response of some wet/intermediate plots in the
recovery phase. In addition, the functional diversity
ap-proach circumvents to some extent the need for high
taxonomic resolution, which may not be easily achieved
for non-specialists and can lead to erroneous
interpreta-tion in some cases (Heger et al. 2009; Mitchell et al.
2014). Testate amoeba taxonomy is constantly
chang-ing and molecular based studies are revealchang-ing cryptic
diversity (Lara et al. 2007; Heger et al. 2009;
Kosaky-an et al. 2013, 2016; Oliverio et al. 2014; Singer et al.
2015). Until a better taxonomy is available, the
func-tional diversity approach, based on easily-measurable
morphological traits represents a powerful approach to
infer ecological processes (de Bello et al. 2010;
Fourni-er et al. 2012, 2015; Mitchell et al. 2014). Measuring
the proportion of mixotrophs, the size and position of
the pseudostome or the size category of testate
amoe-bae is thus a promising approach to monitor the impact
of perturbations or restoration on Sphagnum peatlands
(Fournier et al. 2015; Payne et al. 2016; Marcisz et al.
2016). To our knowledge these tools have not yet been
used in environmental consulting or by managers, and
it is worth developing them.
Acknowledgments. This experiment was the follow up of a project
supported by grant N° PSPB-013/2010 from Switzerland through the Swiss Contribution to the enlarged European Union and addi-tional funds from the University of Neuchâtel.
REFERENCES
Amesbury M. J., Swindles G. T., Bobrov A., Charman D. J., Holden J., Lamentowicz M., Mallon G., Mazei Y., Mitchell E. A. D., Payne R. J., Roland T. P., Turner T. E., Warner B. G. (2016) Development of a new pan-European testate amoeba transfer function for reconstructing peatland palaeohydrology. Quat.
Sci. Rev. 152: 132–151
Fig. 4. Top: summary representation of the evolution testate amoeba communities from a Sphagnum fallax mesocosm experiment
simu-lating water table changes. The size of illustrated species is approximately to their relative body size. As communities in the intermediate and wet treatments were not significantly different, they are pooled together for the species based evolution (upper part). The three most abundant taxa (mean abundance) at each sampling time are represented (four at T0). Present at the beginning of the experiment, A. flavum recovered only slightly in intermediate plots at R2 (not shown). Small taxa (P. acropodia, A. muscorum, C. oviformis, C. dubium) increased after the disturbance (arrow) and in dry plots H. papilio almost disappeared at R1 and recovered at R2. Bottom: Evolution of testate amoeba functional traits. Different signs (+, *) or letters indicate significant differences. The lines show the cubic spline interpolation of the CWM of trait at each sampling points (n = 5). As shown in the upper graph based on taxonomic community structure, in the wet and intermediate treatments the disturbance effect remained in the recovery phase in some plots, which is indicated by the increasing spread of points and constantly decreasing spline line. By contrast, in dry plots, the maximum stress response was observed at D1 and R1 followed by a partial recovery at R2. In the dry treatment, the dominant positions of the pseudostome was ventral at D1 and terminal at R1.
Anderson M. J. (2001) A new method for non-parametric multivari-ate analysis of variance: non-parametric manova for ecology.
Austral. Ecol. 26: 32–46
Arrieira R. L., Schwind L. T. F., Bonecker C. C., Lansac-Toha F. A. (2015) Use of functional diversity to assess determinant assem-bly processes of testate amoebae community. Aquat. Ecol. 49:
561–571
de Bello F., Lavorel S., Díaz S., Harrington R., Cornelissen J. H., Bardgett R. D., Berg M. P., Cipriotti P., Feld C. K., Hering D., and others (2010) Towards an assessment of multiple ecosystem processes and services via functional traits. Biodivers. Conserv.
19: 2873–2893
Benton T. G., Solan M., Travis J. M. J., Sait S. M. (2007) Micro-cosm experiments can inform global ecological problems.
Trends Ecol. Evol. 22: 516–521
Bobrov A. A., Charman D. J., Warner B. G. (1999) Ecology of tes-tate amoebae (Protozoa: Rhizopoda) on peatlands in western Russia with special attention to niche separation in closely re-lated taxa. Protist 150: 125–36
Bonn A., Allott T., Evans M., Joosten H., Stoneman R. (2016) Peat-land restoration and ecosystem services: science, policy and practice. Cambridge University Press
Bonnett S. A., Linsted R., Ross S., Maltby E. (2011) Guidelines for monitoring the success of peatland restoration. Technical Re-port. Natural England, SWIMMER
Booth R. K. (2001) Ecology of testate amoebae (Protozoa) in two Lake Superior coastal wetlands: Implications for paleoecology and environmental monitoring. Wetlands 21: 564–576
Booth R. K. (2002) Testate amoebae as paleoindicators of surface-moisture changes on Michigan peatlands: modern ecology and hydrological calibration. J. Paleolimnol. 28: 329–348
Booth R. K., Lamentowicz M., Charman D. (2010) Preparation and analysis of testate amoebae in peatland paleoenvironmental studies. Mires Peat 7: 1–7
Booth R. K., Meyers B. (2010) Environmental controls on pore number in Hyalosphenia papilio: implications for paleoenvi-ronmental reconstruction. Acta Protozool. 49: 29–35
Buttler A., Warner B. G., Grosvernier P., Matthey Y. (1996) Verti-cal patterns of testate amoebae (protozoa: rhizopoda) and peat-forming vegetation on cutover bogs in the Jura, Switzerland.
New Phytol. 134: 371–382
Cangelosi R., Goriely A. (2007) Component retention in principal component analysis with application to cDNA microarray data.
Biol. Direct 2: 2
Caron D. A., Worden A. Z., Countway P. D., Demir E., Heidelberg K. B. (2009) Protists are microbes too: a perspective. ISME J.
3: 4–12
Cavalier-Smith T., Chao E. E. Y. (2003) Phylogeny and classifica-tion of phylum Cercozoa (Protozoa). Protist 154: 341–358
Cavender-Bares J., Kozak K. H., Fine P. V. A., Kembel S. W. (2009) The merging of community ecology and phylogenetic biology.
Ecol. Lett. 12: 693–715
Charman D. J. (2001) Biostratigraphic and palaeoenvironmental ap-plications of testate amoebae. Quat. Sci. Rev. 20: 1753–1764
Charman D. J., Hendon D., Woodland W. A. (2000) The identifica-tion of testate amoebae (Protozoa: Rhizopoda) in peats. Techni-cal Guide No. 9. Quaternary Research Association.
Chase J. M., Kraft N. J., Smith K. G., Vellend M., Inouye B. D. (2011) Using null models to disentangle variation in community dissimilarity from variation in α-diversity. Ecosphere 2: 1–11
Church A., Fish R., Haines-Young R., Mourato S., Tratalos J., Stapleton L., Willis C., Coates P., Gibbons S., Leyshon C.,
Potschin M., Ravenscroft N., Sanchis-Guarner R., Winter M., Kenter J. (2014) UK National Ecosystem Assessment Follow-on. Work Package Report 5: Cultural ecosystem services and indicators. UNEP-WCMC, LWEC, UK
Delaine M., Bernard N., Gilbert D., Recourt P., du Châtelet E. A. (2017) Origin and diversity of testate amoebae shell composi-tion: Example of Bullinularia indica living in Sphagnum
capil-lifolium. Eur. J. Protistol. 59: 14–25
Dray S., Legendre P. (2008) Testing the species traits-environment relationships: the fourth-corner problem revisited. Ecology 89:
3400–3412
Fournier B., Lara E., Jassey V. E. J., Mitchell E. A. D. (2015) Func-tional traits as a new approach for interpreting testate amoeba palaeo-records in peatlands and assessing the causes and conse-quences of past changes in species composition. The Holocene
25: 1375–1383
Fournier B., Malysheva E., Mazei Y., Moretti M., Mitchell E. A. D. (2012) Toward the use of testate amoeba functional traits as in-dicator of floodplain restoration success. Eur. J. Soil Biol. 49:
85–91
Gilbert D., Amblard C., Bourdier G., Francez A. J. (1998) The mi-crobial loop at the surface of a peatland: structure, function, and impact of nutrient input. Microb. Ecol. 35: 83–93
Gilbert D., Mitchell E. A. D. (2006) Microbial diversity in
Sphag-num peatlands. Dev. Earth Surf. Process 9: 287–318
Gilbert D., Mitchell E. A. D., Amblard C., Bourdier G., Francez A. J. (2003) Population dynamics and food preferences of the testate amoeba Nebela tincta major-bohemica-collaris complex (Protozoa) in a Sphagnum peatland. Acta Protozool. 42: 99–104
Gomaa F., Kosakyan A., Heger T. J., Corsaro D., Mitchell E. A. D., Lara E. (2014) One alga to rule them all: unrelated mixotro-phic testate amoebae (Amoebozoa, Rhizaria and Strameno-piles) share the same symbiont (Trebouxiophyceae). Protist
165: 161–176
Gomaa F., Mitchell E. A. D., Lara E. (2013) Amphitremida (Poche, 1913) is a new major, ubiquitous Labyrinthulomycete clade.
PLoS ONE 8: e53046
Gower J. C. (1971) A general coefficient of similarity and some of its properties. Biometrics 27: 857–871
Graf U., Kuchler M., Ecker K., Feldmeyer-Christe E., Könitzer C., Känzig U., Grosvernier P., Berchten F., Lugon A., David R., Marti F. (2007) Etat et évolution des marais en Suisse. Office Fédéral de l’Environnement, Berne
Grosvernier P., Matthey Y., Buttler A. (1997) Growth potential of three Sphagnum species in relation to water table level and peat properties with implications for their restoration in cut-over bogs. J. Appl. Ecol. 34: 471–483
Heal O. W. (1964) Observations on the seasonal and spatial distri-bution of testacea (Protozoa: Rhizopoda) in Sphagnum. J. Anim.
Ecol. 33: 395–412
Heger T. J., Mitchell E. A. D., Leander B. S. (2013) Holarctic phylogeography of the testate amoeba Hyalosphenia papilio (Amoebozoa: Arcellinida) reveals extensive genetic diversity explained more by environment than dispersal limitation. Mol.
Ecol. 22: 5172–5184
Heger T. J., Mitchell E. A. D., Ledeganck P., Vincke S., Van de Vij-ver B., Beyens L. (2009) The curse of taxonomic uncertainty in biogeographical studies of free‐living terrestrial protists: a case study of testate amoebae from Amsterdam Island. J. Biogeogr.
36: 1551–1560
Holt R. D. (2009) Bringing the Hutchinsonian niche into the 21st century: Ecological and evolutionary perspectives. Proc. Natl.
Jassey V. E. J., Chiapusio G., Mitchell E. A. D., Binet P., Toussaint M.-L., Gilbert D. (2011) Fine-scale horizontal and vertical mi-cro-distribution patterns of testate amoebae along a narrow fen/ bog gradient. Microb. Ecol. 61: 374–385
Jassey V. E. J., Meyer C., Dupuy C., Bernard N., Mitchell E. A. D., Toussaint M.-L., Metian M., Chatelain A. P., Gilbert D. (2013a) To what extent do food preferences explain the trophic posi-tion of heterotrophic and mixotrophic microbial consumers in a Sphagnum peatland? Microb. Ecol. 66: 571–580
Jassey V. E. J., Chiapusio G., Binet P., Buttler A., Laggoun-Defarge F., Delarue F., Bernard N., Mitchell E. A. D., Toussaint M. L., Francez A. J., Gilbert D. (2013b) Above- and belowground linkages in Sphagnum peatland: climate warming affects plant-microbial interactions. Glob. Change Biol. 19: 811–823
Jassey V. E. J., Signarbieux C., Hättenschwiler S., Bragazza L., But-tler A., Delarue F., Fournier B., Gilbert D., Laggoun-Défarge F., Lara E., Mills R. T. E., Mitchell E. A. D., Payne R. J., Robroek B. J. M. (2015) An unexpected role for mixotrophs in the re-sponse of peatland carbon cycling to climate warming. Sci. Rep.
5: 16931
Juggins, S. (2015) rioja: Analysis of Quaternary Science Data, R package
Kaiser H. F. (1991) Coefficient Alpha for a Principal Component and the Kaiser-Guttman Rule. Psychol. Rep. 68: 855–858
Kajukało K., Fiałkiewicz-Kozieł B., Gałka M., Kołaczek P., Lamen-towicz M. (2016) Abrupt ecological changes in the last 800 years inferred from a mountainous bog using testate amoebae traits and multi-proxy data. Eur. J. Protistol. 55: 165–180
Kearney M., Simpson S. J., Raubenheimer D., Helmuth B. (2010) Modelling the ecological niche from functional traits. Philos.
Trans. R. Soc. B. Biol. Sci. 365: 3469–3483
Kembel S. W., Cowan P. D., Helmus M. R., Cornwell W. K., Morlon H., Ackerly D. D., Blomberg S. P., Webb C. O. (2010) Picante: R tools for integrating phylogenies and ecology. Bioinformatics
26: 1463–1464
Koenig I., Mulot M., Mitchell E. A. D. (2018) Taxonomic and func-tional traits responses of Sphagnum peatland testate amoebae to experimentally manipulated water table. Ecol. Indic.
Kosakyan A., Gomaa F., Mitchell E. A. D., Heger T. J., Lara E. (2013) Using DNA-barcoding for sorting out protist species complexes: A case study of the Nebela
tincta–collaris–bohe-mica group (Amoebozoa; Arcellinida, Hyalospheniidae). Eur. J.
Protistol. 49: 222–37
Kosakyan A., Lahr D. J. G., Mulot M., Meisterfeld R., Mitchell E. A. D., Lara E. (2016) Phylogenetic reconstruction based on
COI reshuffles the taxonomy of Hyalosphenid shelled (testate)
amoebae and reveals the convoluted evolution of shell plate shapes. Cladistics. 32 (6): 606–623
Laggoun-Defarge F., Mitchell E. A. D., Gilbert D., Disnar J.-R., Comont L., Warner B. G., Buttler A. (2008) Cut-over peatland regeneration assessment using organic matter and microbial indicators (bacteria and testate amoebae). J. Appl. Ecol. 45:
716–727
Lahr D. J. G., Bosak T., Lara E., Mitchell E. A. D. (2015) The Pha-nerozoic diversification of silica-cycling testate amoebae and its possible links to changes in terrestrial ecosystems. PeerJ.
3: e1234
Laliberté E., Legendre P., Shipley, B. (2014) FD: measuring tional diversity from multiple traits, and other tools for func-tional ecology. R package
Lamentowicz L., Gabka M., Rusinska A., Sobczynski T., Owsianny P. M., Lamentowicz M. (2011) Testate amoeba (Arcellinida,
Eu-glyphida) ecology along a poor-rich gradient in fens of Western Poland. Int. Rev. Hydrobiol. 96: 356–380
Lamentowicz M., Gałka M., Lamentowicz Ł., Obremska M., Kühl N., Lücke A., Jassey V. E. J. (2015) Reconstructing climate change and ombrotrophic bog development during the last 4000 years in northern Poland using biotic proxies, stable isotopes and trait-based approach. Palaeogeogr. Palaeoclimatol.
Pal-aeoecol. 418: 261–277
Lamentowicz Ł., Lamentowicz M., Gabka M. (2008) Testate amoe-bae ecology and a local transfer function from a peatland in western Poland. Wetlands 28: 164–175
Lamentowicz M., Mitchell E. A. D. (2005) The ecology of testate amoebae (protists) in Sphagnum in north-western Poland in re-lation to peatland ecology. Microb. Ecol. 50: 48–63
Lara E., Heger T. J., Mitchell E. A. D., Meisterfeld R., Ekelund F. (2007) SSU rRNA reveals a sequential increase in shell com-plexity among the euglyphid testate amoebae (Rhizaria : Eug-lyphida). Protist 158: 229–237
Lavorel S., Garnier E. (2002) Predicting changes in community composition and ecosystem functioning from plant traits: revis-iting the Holy Grail. Funct. Ecol. 16: 545–556
Legendre P., Gallagher E. D. (2001) Ecologically meaningful transformations for ordination of species data. Oecologia 129:
271–280
Lizoňová Z., Horsák M. (2017) Contrasting diversity of testate amoebae communities in Sphagnum and brown-moss domi-nated patches in relation to shell counts. Eur. J. Protistol. 58:
135–142
MacArthur R. H. (1957) On the relative abundance of bird species.
Proc. Natl. Acad. Sci. 43: 293–295
Makarieva A. M., Gorshkov V. G., Li B.-L., Chown S. L., Reich P. B., Gavrilov V. M. (2008) Mean mass-specific meta-bolic rates are strikingly similar across life’s major domains: evidence for life’s metabolic optimum. Proc. Natl. Acad. Sci.
105: 16994–16999
Marcisz K., Colombaroli D., Jassey V. E. J., Tinner W., Kołaczek P., Gałka M., Karpińska-Kołaczek M., Słowiński M., Lamen-towicz M. (2016) A novel testate amoebae trait-based approach to infer environmental disturbance in Sphagnum peatlands. Sci.
Rep. 6
Marcisz K., Lamentowicz Ł., Słowińska S., Słowiński M., Muszak W., Lamentowicz M. (2014) Seasonal changes in Sphagnum peatland testate amoeba communities along a hydrological gra-dient. Eur. J. Protistol. 50: 445–455
Mason N. W., Lanoiselée C., Mouillot D., Wilson J. B., Argillier C. (2008) Does niche overlap control relative abundance in French lacustrine fish communities? A new method incorporating func-tional traits. J. Anim. Ecol. 77: 661–669
Mazei Y. A., Tsyganov A. N., Bubnova O. A. (2009) The species composition and community structure of testate amoebae in
Sphagnum bogs of northern Karelia (The White Sea Lowland).
Zool. Zhurnal. 88: 771–782
Messier J., McGill B. J., Lechowicz M. J. (2010) How do traits vary across ecological scales? A case for trait-based ecology. Ecol.
Lett. 13: 838–848
Millenium Ecosystem Assessment, MEA (2005) Ecosystems and human well-being. The Island Press, Washington D.C.
Mitchell E. A. D. (2003) The identification of Nebela and similar species with indications on their ecology and distribution. Univ. Anchorage Alsk
Mitchell E. A. D., Buttler A. J., Warner B. G., Gobat J.-M. (1999) Ecology of testate amoebae (Protozoa : Rhizopoda) in