HAL Id: hal-00937599
https://hal.archives-ouvertes.fr/hal-00937599
Submitted on 28 Jan 2014
HAL is a multi-disciplinary open access
archive for the deposit and dissemination of
sci-entific research documents, whether they are
pub-lished or not. The documents may come from
teaching and research institutions in France or
abroad, or from public or private research centers.
L’archive ouverte pluridisciplinaire HAL, est
destinée au dépôt et à la diffusion de documents
scientifiques de niveau recherche, publiés ou non,
émanant des établissements d’enseignement et de
recherche français ou étrangers, des laboratoires
publics ou privés.
SIMSISH technique does not alter the apparent isotopic
composition of bacterial cells
O. Chapleur, T.D. Wu, J.L. Guerquin-Kern, L. Mazéas, T. Bouchez
To cite this version:
O. Chapleur, T.D. Wu, J.L. Guerquin-Kern, L. Mazéas, T. Bouchez. SIMSISH technique does not
alter the apparent isotopic composition of bacterial cells. PLoS ONE, Public Library of Science, 2013,
8 (10), 8 p. �10.1371/journal.pone.0077522�. �hal-00937599�
Composition of Bacterial Cells
Olivier Chapleur1*, Ting-Di Wu2,3, Jean-Luc Guerquin-Kern2,3, Laurent Maze´as1, The´odore Bouchez1
1 UR HBAN, Irstea, Antony, France, 2 U.759, INSERM, Orsay, France, 3 Laboratoire de Microscopie Ionique, Institut Curie, Orsay, France
Abstract
In order to identify the function of uncultured microorganisms in their environment, the SIMSISH method, combining in situ hybridization (ISH) and nanoscale secondary ion mass spectrometry (nanoSIMS) imaging, has been proposed to determine the quantitative uptake of specific labelled substrates by uncultured microbes at the single cell level. This technique requires the hybridization of rRNA targeted halogenated DNA probes on fixed and permeabilized microorganisms. Exogenous atoms are introduced into cells and endogenous atoms removed during the experimental procedures. Consequently differences between the original and the apparent isotopic composition of cells may occur. In the present study, the influence of the experimental procedures of SIMSISH on the isotopic composition of carbon in E. coli cells was evaluated with nanoSIMS and compared to elemental analyser-isotopic ratio mass spectrometer (EA-IRMS) measurements. Our results show that fixation and hybridization have a very limited, reproducible and homogeneous influence on the isotopic composition of cells. Thereby, the SIMSISH procedure minimizes the contamination of the sample by exogenous atoms, thus providing a means to detect the phylogenetic identity and to measure precisely the carbon isotopic composition at the single cell level. This technique was successfully applied to a complex sample with double bromine – iodine labelling targeting a large group of bacteria and a specific archaea to evaluate their specific13C uptake during labelled methanol anaerobic degradation.
Citation: Chapleur O, Wu T-D, Guerquin-Kern J-L, Maze´as L, Bouchez T (2013) SIMSISH Technique Does Not Alter the Apparent Isotopic Composition of Bacterial Cells. PLoS ONE 8(10): e77522. doi:10.1371/journal.pone.0077522
Editor: Matthias Horn, University of Vienna, Austria
Received April 3, 2013; Accepted September 4, 2013; Published October 29, 2013
Copyright: ß 2013 Chapleur et al. This is an open-access article distributed under the terms of the Creative Commons Attribution License, which permits unrestricted use, distribution, and reproduction in any medium, provided the original author and source are credited.
Funding: The authors have no support or funding to report.
Competing Interests: The authors have declared that no competing interests exist. * E-mail: [email protected]
Introduction
Over the past decades, molecular biology approaches have allowed to overcome limitations associated to cultivation-depen-dent methods, which were greatly underestimating actual diversity [1], and enabled strong advances in microbial communities’ quantification and classification. However, most molecular-based technologies are still unable to directly link phylogeny and biochemical processes. Consequently, the in situ ecophysiology of many key microorganisms still remains poorly documented. Linking phylogenetic information to function in complex envi-ronmental communities is thus one of the main challenges of microbial ecology.
In this context, different methods coupling isotope-labelling experiments and in situ hybridization have been developed to investigate the ecophysiology of microbial populations. They reveal the specific uptake of isotopically labelled substrates within individual cells and the phylogenetic affiliation of the very same cells. Among them, MarFISH [2–4] combines fluorescence in situ hybridization (FISH) and microautoradiography (mar) but is limited to radioactive isotopes. Raman FISH [5] allows the detection of isotopes incorporated into cells using Raman microscopy. More recently, new methodologies involving high spatial resolution secondary ion mass spectrometry (nanoSIMS) have been developed [6–9]. They allow more precise isotopic measurements and a better spatial resolution than previous techniques. Although these methods all rely on the combination
of rRNA-based in situ hybridization with stable isotope imaging based on nanoSIMS, they differ notably by the hybridization procedure. Secondary Ion Mass Spectroscopy In situ Hybridiza-tion, SIMSISH, is based on the direct hybridization of haloge-nated DNA probes [6] whereas ELFISH or HISHSIMS (respectively Element Labeling-Fluorescent In situ Hybridization and Halogen In situ Hybridization Secondary Ion Mass Spectros-copy) uses catalyzed reporter deposition fluorescence in situ hybridization [10] with horseradish-peroxidase-labeled oligonu-cleotide probes and halogen-containing tyramides for the identi-fication of microorganisms [7–9]. These methodological differ-ences could imply different consequdiffer-ences on the measurement of isotopic enrichment in cells. Indeed, treatment and preparation of samples prior to nanoSIMS analysis (e.g. chemical fixation of samples, or the application of genetic probes during hybridization) are factors that can modify the initial composition of the microbial cells [11]. No detailed descriptions of these effects are available up to date.
Yet the accuracy of the absolute value of isotopic enrichment measurement together with a specific phylogenetic identification is very important to have precise information on microorganisms’ functions in complex environments or to establish functional models. In the present study, the option to measure isotopic ratios in probe-labelled single cells with a nanoSIMS was evaluated using SIMSISH technique [6]. This technique requires introducing halogens (or any other element rarely present in biomass) into cells via halogenated 16S rRNA-targeted probes, after isotopic
enrichment of cells with carbon (13C) or any element of biological interest. Hybridization is performed on PFA-fixed and ethanol-permeabilized cells. Oligonucleotide probe-conferred hybridiza-tion signal (halogen) and isotopic enrichment are measured directly in microbial cells with the nanoSIMS. Even if only a limited number of probes and exogenous atoms are introduced (and endogenous atoms removed) into cells during the fixation and hybridization procedures, the samples might be modified resulting in differences between the original isotopic content and the apparent isotopic composition of cells measured by nanoSIMS [6,11]. The present study was designed to evaluate with precision the influence of these procedures on the quantification of cells’ stable isotopic composition focusing on carbon. Single cell level analyses, realized with nanoSIMS, were compared to reference analyses, at population level on cells pellets, realized with elemental analyser-isotopic ratio mass spectrometer (EA-IRMS). Analyses were performed on a set of E. coli cells isotopically labelled at different levels of 13C enrichment. The possibility of simultaneously identifying and measuring the isotopic enrichment of several microorganisms in one experiment was also evaluated with a double labelling experiment.
Materials and Methods
Unless specifically mentioned, all experimental procedures were performed according to [6].
1. Bacterial Strain and Growth Conditions
Pure cultures of Escherichia coli JM109 were grown in a defined medium containing per litre of distilled water, 1 g of NH4Cl, 0.2 g
of MgSO4?7 H2O, 6 g of NaH2PO4?H2O, 3 g of K2HPO4, 0.5 g
of NaCl and 0.01 g of CaCl2, supplemented with 10 mg.ml21
glucose as the sole organic carbon source [6]. For13C labelling, unlabelled glucose was substituted by13C6-glucose (99 atom % at 13
C, Cambridge isotopic laboratory, UK). 10 groups of cells were prepared from minimal culture media with 10 different isotopic compositions of 13C (1.10%, 2.08%, 3.06%, 6.00%, 10.89%, 20.68%, 40.26%, 59.84%, 79.42% and 99.00% of13C in glucose, measured with EA-IRMS). Strains were cultivated aerobically at 37uC and harvested in stationary phase after 20 h of incubation. For each isotopic composition, grown cell culture was divided in three batches. Cells pellets were washed once with 16 phosphate-buffered saline (PBS, Sigma). One was kept as ‘‘untreated cells’’, the other two were used subsequently for fixation and hybridiza-tion procedures.
2. Complex Sample
A complex sample was recovered from an anaerobic batch digester (120 ml) inoculated with municipal solid waste landfill
leachate and fed with 13C-labeled methanol (99% in 13, Cam-bridge isotopic laboratory, UK, concentration of 4.75 g/l) after 25 days of incubation. Specific degradation parameters and microbial analysis are described in [12].
3. Fixation and Hybridization Procedures
For fixation, cells pellets were re-suspended in 200ml of 16PBS (Sigma) and 600ml 4% paraformaldehyde (Sigma) as fixative. After 3 h of incubation at 4uC, tubes were centrifuged (11 000 g, 10 min) and pellets were washed once again with 16PBS and re-suspended in 500ml of 16PBS and 500ml of pure ethanol. Fixed cells were stored at 220uC.
For in situ hybridization, 10–100ml of fixed cells were washed in 400ml of hybridization buffer (0.9 M sodium chloride, 20 mM Tris-HCl, 0.1% SDS and 20% of formamide). The resulting cell suspension was subjected to vortex (1 min) and cells were recovered by centrifugation and re-suspended in 20ml of pre-heated hybridization buffer. Two microlitres of probe (50 ng.ml21) were added and the suspension was incubated during 2 h at 46uC. Cells were then recovered by centrifugation (11 000 g, 10 min) and washed for 15 min in wash buffer (0.215 M sodium chloride, 20 mM Tris-HCl, 5 mM EDTA, 0.1% SDS) at 48uC. Finally, the cells were centrifuged for 10 min at 11 000 g and re-suspended in 50ml of sterile ice-cold ultrapure water. Hybridization was performed with a generalist bacterial iodinated EUB338 probe I6-Eub338-Cy3 (59-Cy3-GcTGccTcccGTAGGAGT-39 c =
5-io-do-29deoxycytidine, synthesized by Proligo) [6]. Quality of hybridization was checked before subsequent analysis. Quality of fluorescent signal was checked with laser confocal microscope (Figure S1). An intense and bright signal was always obtained. Quality of halogen signal was checked with nanoSIMS (Figure S2). At least 85% of cells exhibited a clear halogen labelling.
The same protocol was applied to a complex sample. Two probes were used: generalist bacterial brominated EUB338 probe Br8-Eub338-Cy3 (59-Cy3-GcTGccTcccGTaGGaGT-39 a =
5-bromo-29deoxyadenosine c = 5-bromo-29deoxycytidine, synthe-sized by Proligo) and specific archaeal iodinated MS1414 probe (targeting Methanosarcina genera) I9-MS1414-Cy3
(59-Cy3-cTcAcc-cATAccTcATcGGG-39 c = 5-iodo-29deoxycytidine, synthesized by Proligo).
4.13C Abundance Measurement with EA-IRMS
Pellets of untreated (non-fixed and non-hybridized), fixed and fixed/hybridized E. coli cells were dried overnight (55uC) and subjected to isotopic analysis (13C/12C) by EA-IRMS from Thermo Electron (Germany). For each pellet, two samples of about 150mg each were transferred to ultrapure tin container (Thermo) and analyzed, except for fixed/hybridized cells (only one sample).
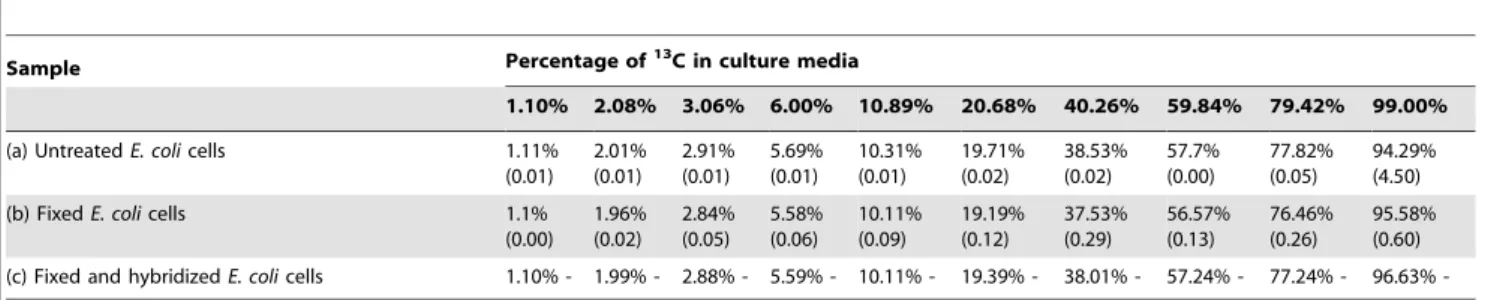
Table 1. Isotopic composition of E. coli cells measured with EA-IRMS.
Sample Percentage of13C in culture media
1.10% 2.08% 3.06% 6.00% 10.89% 20.68% 40.26% 59.84% 79.42% 99.00% (a) Untreated E. coli cells 1.11%
(0.01) 2.01% (0.01) 2.91% (0.01) 5.69% (0.01) 10.31% (0.01) 19.71% (0.02) 38.53% (0.02) 57.7% (0.00) 77.82% (0.05) 94.29% (4.50) (b) Fixed E. coli cells 1.1%
(0.00) 1.96% (0.02) 2.84% (0.05) 5.58% (0.06) 10.11% (0.09) 19.19% (0.12) 37.53% (0.29) 56.57% (0.13) 76.46% (0.26) 95.58% (0.60) (c) Fixed and hybridized E. coli cells 1.10% - 1.99% - 2.88% - 5.59% - 10.11% - 19.39% - 38.01% - 57.24% - 77.24% - 96.63% -Isotopic composition of untreated, fixed, and fixed/hybridized E. coli cells measured with EA-IRMS on dried cells pellets. Standard deviation is given in parentheses. doi:10.1371/journal.pone.0077522.t001
Figure 1. Isotopic composition of untreated, fixed and fixed hybridized cells measured with EA-IRMS and nanoSIMS. (a)13C isotopic composition of fixed, and fixed/hybridized E. coli cells measured with EA-IRMS compared to13C isotopic composition of untreated cells – (b)13C
isotopic composition of fixed/hybridized E. coli cells measured with nanoSIMS compared to13C isotopic composition of untreated cells. doi:10.1371/journal.pone.0077522.g001
5.13C Abundance Measurement with nanoSIMS
5.1. E. coli pure culture. In order to provide a more reliable and comparable measurement of the difference in 13C content, untreated and fixed/hybridized E. coli cells of the same isotopic composition were mixed and observed together. Hybridized cells were distinguished from untreated cells by the iodine map. Fixed cells were not analysed as they could not be distinguished from untreated cells with nanoSIMS observation.
1ml of fixed/hybridized sample was mixed with 1ml of untreated cells (1:50 dilution of pure culture pellets). Drops of
the mixtures were spread on 7 mm67 mm high-purity silicon chips (Silicon Quest International) cleaned with ultrapure water and absolute ethanol. After drying in a oven at 55uC overnight, samples were imaged with an epifluorescent microscope to localise hybridized cells on the chips for subsequent NanoSIMS measure-ments.
Silicon chips were then introduced into a NanoSIMS-50 instrument (CAMECA, Gennevilliers, France) equipped with caesium ion source. For the present study, by using a Cs+ primary ion beam tightly focused to a typical probe size of about 100– 150 nm in diameter, up to five of the secondary ion species
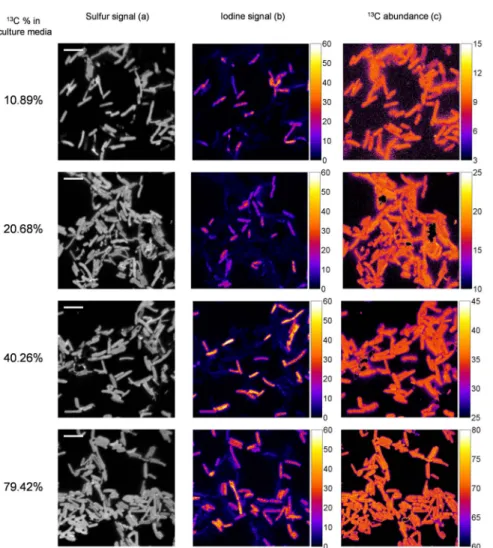
Figure 2. NanoSIMS images obtained for mixed untreated and fixed/hybridized cells grown in enriched culture media. NanoSIMS images obtained for mixed untreated and fixed/hybridized cells grown in enriched culture media with nominal13C abundance of 10.9, 20.7, 40.3 and
79.4%. Panel (a) shows the secondary ion of32S2image as an image of total biomass (scale bar : 5 mm). Panel (b) shows the secondary ion of127
I2
image as an indication of hybridized cells. (c)13C Isotopic abundance map of corresponding area.
doi:10.1371/journal.pone.0077522.g002
Table 2. Mean isotopic composition of individual cells measured with nanoSIMS.
Sample Percentage of13C in culture media
10.89% 20.68% 40.26% 79.42% (a) Untreated E. coli cells 9.47% (0.24) 18.12% (0.36) 36.06% (0.55) 71.16% (0.95) (b) Fixed and hybridized E. coli cells 9.35% (0.18) 17.67% (0.23) 35.16% (0.32) 70.98% (0.93) Mean isotopic composition of untreated and fixed/hybridized E. coli cells measured with nanoSIMS on individual cells. Standard deviation is given in parentheses. doi:10.1371/journal.pone.0077522.t002
(among 12C–, 13C–, 12C14N–, 13C14N–, 32S–, 127I–) were targeted [6].
The area of interest was first selected by rapid survey with detection of iodine signal and 32S– signal in order to localize hybridized cells in the whole biomass. Precise abundance determination required a second acquisition with different detectors settings. After careful Cs+ ion implantation to get steady state emission of C2, the acquisition of13C2
and 12C- images was carried out using multiframe mode. The typical raster size was 30mm with an image definition of 5126512 pixels and the Dwell time was 500ms per pixel. At least 15 frames were acquired but only the sum of the 10 last frames with best intensity stability were used for 13C and 12C ratio determination so as to reduce the possible mass fractionation due to variation in ion emission for the two isotopic ions. Proper alignment between each frame was ensured using ImageJ software (Wayne Rasband, http://imagej. nih.gov/ij).
In NanoSIMS microprobe, 13C2 to 12C2 ions are recorded simultaneously in two different detectors (electron multipliers, ion counting mode). The response of these two detectors has to be well balanced to allow precise measurement of the ratio between13C2 and 12C2 ions. Furthermore, to ensure the accuracy of the13C
abundance determination, the obtained ratio has to be corrected by the mass fractionation mainly induced by the ion emission process. For these reasons, a reference material with known13C content was employed to calibrate the ratio measured by the 2 detectors.
A calibration constant (K) was established based on the analysis of such reference material (r).
,R-r,known:~,,,,,-13-C:-(at%):-,,-12-C:-(at%):::-r,known: ,R-r,measured:~,,,,-13-,C-{::-,-12-,C-{::::-r,measured: K~,,,R-r,known:-,R-r,measured:::
Then, for each13C2to12C2ratio measured from an unknown sample (s) under the same operating conditions, the13C content was determined by using the above calibration constant.
Figure 3. NanoSIMS images obtained from a double-labelled complex sample (13C-labeled methanol degrading anaerobic digester). NanoSIMS images obtained from acomplex sample(13C-labeled methanol degrading anaerobic digester) labelled with a generalist
bacterial iodinated probe (EUBI) and a Methanosarcina genera specific brominated probe (MS1414). Panel (a) shows the secondary ion of32S2image as an image of total biomass. Panel (b) shows the secondary ion of81Br2image as an indication of archaeal cell identity. Panel (c) shows the
secondary ion of127I2image as an indication of total bacteria. Panels (d) shows the13C Isotopic abundance map. doi:10.1371/journal.pone.0077522.g003
,,,,,-13-C:-(at%):-,,-12-C:-(at%):::-s,calibrated: ~,K,,,-13-C-{::-,-12-,C-{::::-s,measured:
For the present study, we used a homogeneous Spurr resin at natural abundance (BioValley) as reference material. This Spurr resin has a nominal composition of 34.8% of C, 59.6% of H, 5.6% of O and 0.06% of N which is quite similar to biological sample. It was first calibrated for its C composition by EA-IRMS technique against a certified reference material (USGS-24, graphite). The calibrated 13C (at%) content is 1.07933560.000108 (0.01% relative, 1SD). Thin sections from the same block of resin were placed onto clean Si chip to be analyzed by NanoSIMS to provide the calibration constant (K). One thin resin section was measured with the same operating conditions during each measurement session on E. Coli samples as a control. During the present study, the measured 13C (at%) was 1.056260.00506 (0.48% relative, 1SD) for 4 measurement sessions and no significant change was observed. Therefore, a unique calibration constant (K) of 1.0222 was applied to all the measurements. Such calibration procedure was applied directly to the acquired images based on a pixel-to-pixel calculation.
Using ImageJ software and the obtained13C and 12C images,
the13C and12C ratio for each pixel was calculated to generate a
13
C content map.
At least two different areas were analysed for each sample.
5.2. Complex sample. The same protocol was used for complex sample. 1ml of fixed/hybridized sample was spread on a silicon chip. Br2 ion was also targeted and used to localize hybridized cells in the total biomass.
6. Student’s t-Test
Paired difference Student’s t-Tests were performed with R on isotopic ratio measurements to estimate the influence of fixation and hybridization. Tests were performed on normalized data, which means that isotopic enrichment value of each group of cells (untreated, fixed and fixed/hybridized) was divided by the corresponding enrichment of untreated cells.
Results and Discussion
1. Influence of SIMSISH Procedure on Isotopic Composition of E. coli Cells
Cells of the ten different groups of pure cultures were fixed, permeabilized and hybridized. Their isotopic composition (13C) was measured with both EA-IRMS and nanoSIMS. To evaluate the degree of modification in isotopic composition, the 13C isotopic abundance obtained after hybridization was compared to the 13C isotopic abundance in untreated cells (sampled directly from the culture, recovered by centrifugation and dried) and in fixed and permeabilized cells (not hybridized, EA-IRMS compar-ison only).
1.1. EA-IRMS measurements. The labelling of E. coli with 13C was measured on cells’ pellets with EA-IRMS for untreated, fixed and fixed/hybridized cells. Table 1 summarizes the results obtained (detailed values are presented in table A in File S1). Isotopic enrichment of untreated cells is slightly inferior to isotopic enrichment of culture media, probably because cells consumed preferably unlabeled glucose. The isotopic values are nearly identical for untreated cells, fixed cells and fixed/hybridized cells, which means that the procedures used for SIMSISH have a very limited influence on the apparent isotopic composition of microbes
measured with EA-IRMS at population level. This is confirmed by figure 1(a) that shows the isotopic enrichment distribution of fixed cells and fixed/hybridized cells as functions of isotopic enrichment of untreated cells. Both distributions are linear, with a slope very close to 1. More precisely the similarity of the measurement for untreated and fixed, and untreated and fixed/hybridized cells was tested with paired difference Student’s t-Test. Data were not significantly different (p,0.06), showing that isotopic measure-ments performed on fixed or fixed/hybridized cells pellets are statistically indistinguishable from those obtained on untreated cell pellets.
1.2. nanoSIMS measurements. E. coli cells grown in 10.9, 20.7, 40.3 and 79.4% of13C were chosen to be observed with nanoSIMS, at single cell level. In a first step, the lateral resolution of nanoSIMS probe was evaluated on a mixture of these cells (Figure S3). NanoSIMS provides an efficient discrimination between lateral neighbour cells. In a second step, untreated and fixed/hybridized cells of each group were analysed simultaneously. A set of images showing sulfur and iodine emission as well as corresponding13C abundance map is presented in figure 2.
Sulfur is an indication of total biomass. Iodine signal enables an identification of hybridized cells from the non-hybridized (untreated) ones (Figure 2(a)). Each cell has rather homogeneous 13C distribution and the 13C content is very close for cells within each image and group (Figure 2(b)). The average13C abundance and standard deviation were calculated for each type of cells observed (between 30 and 60 cells in each group of cells). Table 2 summarizes the results obtained (detailed values are presented in tables S2 and S3 in File S1).
Standard deviations are very low within one type of cells, regardless of the area of the sample observed (not shown) or fixation/hybridization experiment. First of all, it means that the untreated cells used for the experiment presented a homogeneous enrichment. It also signifies that the procedures of SIMSISH have a very repeatable and homogeneous effect on all cells isotopic ratio measured with nanoSIMS at the single cell level.
Moreover, as already observed in EA-IRMS measurements,13C abundance obtained with NanoSIMS measurements for fixed/ hybridized cells differs only slightly from13C abundance obtained for untreated cells, which means that the procedures used for SIMSISH have also a very limited influence on the apparent composition of microbes at single cell level. Figure 1(b) shows that isotopic enrichment distributions of fixed/hybridized individual cells is a linear function of isotopic enrichment of untreated individual cells with a slope very close to 1. Paired difference Student’s t-Test shows that data are not significantly different (p,0.06). It means that isotopic measurements performed on fixed and hybridized individual cells are statistically indistinguishable from those obtained on untreated individual cells.
1.3. EA-IRMS and nanoSIMS comparison. The isotopic compositions determined independently at single-cell level, from the NanoSIMS observation, and at population level, with EA-IRMS, are in overall agreement for each cell culture (Table 1 and 2). However, the 13C abundance measured by nanoSIMS is slightly lower than the one by EA-IRMS, even if a quasi-linear relation can be established between these measurements. Several hypotheses could explain this observation. In this work, the calibration of nanoSIMS was realized with a homogeneous resin at natural isotopic carbon composition. This reference value is at the low end of the scale to be measured. Therefore, a cross calibration with a 13C enriched resin would be useful to check if the NanoSIMS detection system has linear response from low 13C content up to high 13C content. In addition, extra mass fractionation may occur as a result of difference in ion yield
emission between cells and resin. A standard consisting of a matrix similar to cells samples could help to reduce uncertainty in measurement of isotopic composition, but is not yet identified [13]. In the absence of such a standard, an internal calibration with cells of known isotopic composition could be used. Further studies are needed to provide nanoSIMS with a homogeneous and calibrated reference.
In summary, EA-IRMS and nanoSIMS measurements show independently that the fixation and hybridization procedures used in SIMSISH technique have little influence on the carbon isotopic composition of E. coli treated-cells. This indicates that only a very small amount of exogenous carbon is introduced in cells during SIMSISH procedure(a theoretical calculation presented in sup-porting information suggests that the amount of carbon introduced with probes during SIMSISH procedure is less than 0.22% of the total amount of carbon in E. coli cells). Moreover nanoSIMS imaging reveals that such incorporation of exogenous carbon is homogeneous in all the cells of the same type. Consequently, isotopic composition of single cells could be determined precisely with SIMSISH, provided that nanoSIMS is calibrated with a reference. However, fixation and hybridization influence on isotopic composition may not be exactly the same for other types of cells (e.g. with other membrane types), and will have to be evaluated in the course of further studies.
2. Double Labeling of Complex Sample
A13C isotopic enrichment measurement of cells from a complex sample (13C-labeled methanol degrading anaerobic batch digester) is given to illustrate the potential of the SIMSIH technique. A double labeling SIMSISH experiment enabled to both measure the isotopic enrichment of a archaeal cluster affiliated to Genus Methanosarcina (MS1414 probe labeled with iodine) and of the nearby bacterial cells (EUB338 probe labeled with bromine). A set of images showing sulfur emission, bromine emission, iodine emission, and13C abundance map is presented on Figure 3 a, b, c and d. Clear bromine and iodine signals, corresponding to probes hybridization, were observed and enabled the identification of both Methanosarcina archaea and bacterial cells at the same time. This is, to our knowledge, the first successful attempt of FISH double labeling observation with nanoSIMS on a complex sample. Precise 13C labeling enrichment was realized at a smaller observation scale. Figure 3b shows a set of images corresponding to12C and13C ions emission, as well as13C % in cells. The mean
13
C enrichment of archaeal cluster was 30.0% (standard error = 1.3%), and the mean enrichment of bacteria was 24.4% (standard error = 2.5%), showing that both types of microorgan-isms were involved in methanol degradation at different levels. These values will be used in degradation models in further studies to unravel the function of each microorganism in the degradation process.
An accurate isotopic ratio measurement associated with phylogenetic identification will open the door to advanced understanding of metabolic networks and microbial interactions in complex ecosystems. Moreover additional phylogenetic groups could be targeted simultaneously by using more probes.
Conclusion
We have demonstrated that SIMSISH sample preparation procedure has very limited influence on the isotopic composition
of E. coli cells. Therefore, by giving an accurate measurement of 13C fluxes within single cells, this approach can provide information on metabolic activity at single cell level and thus offers insights into the distribution of microbial activities in and among individual cells of probe-identified populations. Multiple labelling seems to be a very attractive prospect to perform several isotopic measurements and identification at the same time or to study specific syntrophic interactions. Combined with stable isotope probing [14], SIMSISH could be an elegant tool to decipher networks of biogeochemical processes catalysed by uncultured microorganisms within complex environments. Indeed, the possibility to follow accurately the fluxes of stable isotope at a particular time point opens the possibility of implanting the measurements into degradation models to resolve specific function directly in complex ecosystems.
Supporting Information
Figure S1 Figure S1 Fluorescent image of hybridized E. coli cells with a generalist bacterial iodinated probe (EUBI). Fluorescent image of hybridized E. coli cells (80% of13C enrichment group) with a generalist bacterial iodinated probe (EUBI). Fluorescent signal is clear and enables to visualize hybridized cells.
(TIF)
Figure S2 Figure S2: NanoSIMS images obtained from hybridized E. coli cells with a generalist bacterial iodinated probe (EUBI). NanoSIMS images obtained from hybridized E. coli cells (80% of 13C enrichment group) with a generalist bacterial iodinated probe (EUBI). Panel (a) shows the secondary ion of32S2image as an image of total biomass. Panel (b) shows the secondary ion of127I2
image as an indication of hybridized cells. 88% of cells have a clear iodine hybridization signal.
(TIF)
Figure S3 Figure S3 13C isotopic abundance map of mixed 10%, 20%, 40%, 80%13C enriched E. coli cells hybridized with a generalist bacterial iodinated probe (EUBI). NanoSIMS observation showing13C isotopic abundance map of mixed 10%, 20%, 40%, 80%13C enriched E. coli cells hybridized with a generalist bacterial iodinated probe (EUBI). Lateral resolution of nanoSIMS provides an efficient discrimina-tion between lateral neighbor cells. Demarcadiscrimina-tion between the different types of cells is clear and level of enrichment inside cells is very regular and not affected by the surrounding cells.
(TIF)
File S1 Estimation of the influence of the addition of probes during hybridization step of SIMSISH on the isotopic composition of cells based on calculation and detailed values of isotopic measurements.
(DOCX)
Author Contributions
Conceived and designed the experiments: OC TDW LM JLGK TB. Performed the experiments: OC TDW. Analyzed the data: OC TDW LM JLGK TB. Contributed reagents/materials/analysis tools: OC TDW LM JLGK TB. Wrote the paper: OC TDW LM JLGK TB.
References
1. Amann RI, Ludwig W, Schleifer KH (1995) Phylogenetic identification and in situ detection of individual microbial cells without cultivation. Microbiological Reviews 59: 143–169.
2. Amann R, Snaidr J, Wagner M, Ludwig W, Schleifer KH (1996) In situ visualization of high genetic diversity in a natural microbial community. Journal of Bacteriology 178: 3496–3500.
3. Ouverney CC, Fuhrman JA (1999) Combined microautoradiography-16S rRNA probe technique for determination of radioisotope uptake by specific microbial cell types in situ. Applied and Environmental Microbiology 65: 1746– 1752.
4. Lee N, Nielsen PH, Andreasen KH, Juretschko S, Nielsen JL, et al. (1999) Combination of fluorescent in situ hybridization and microautoradiography - A new tool for structure-function analyses in microbial ecology. Applied and Environmental Microbiology 65: 1289–1297.
5. Huang WE, Stoecker K, Griffiths R, Newbold L, Daims H, et al. (2007) Raman-FISH: Combining stable-isotope Raman spectroscopy and fluorescence in situ hybridization for the single cell analysis of identity and function. Environmental Microbiology 9: 1878–1889.
6. Li T, Wu TD, Maze´as L, Toffin L, Guerquin-Kern JL, et al. (2008) Simultaneous analysis of microbial identity and function using NanoSIMS. Environmental Microbiology 10: 580–588.
7. Behrens S, Losekann T, Pett-Ridge J, Weber PK, Ng WO, et al. (2008) Linking microbial phylogeny to metabolic activity at the single-cell level by using enhanced element labeling-catalyzed reporter deposition fluorescence in situ
hybridization (EL-FISH) and NanoSIMS. Applied and Environmental Micro-biology 74: 3143–3150.
8. Musat N, Halm H, Winterholler B, Hoppe P, Peduzzi S, et al. (2008) A single-cell view on the ecophysiology of anaerobic phototrophic bacteria. Proceedings of the National Academy of Sciences of the United States of America 105: 17861–17866.
9. Halm H, Musat N, Lam P, Langlois R, Musat F, et al. (2009) Co-occurrence of denitrification and nitrogen fixation in a meromictic lake, Lake Cadagno (Switzerland). Environmental Microbiology 11: 1945–1958.
10. Pernthaler A, Pernthaler J, Amann R (2002) Fluorescence in situ hybridization and catalyzed reporter deposition for the identification of marine bacteria. Applied and Environmental Microbiology 68: 3094–3101.
11. Musat N, Foster R, Vagner T, Adam B, Kuypers MMM (2012) Detecting metabolic activities in single cells, with emphasis on nanoSIMS. FEMS Microbiology Reviews 36: 486–511.
12. Li T (2007) Groupes microbiens fonctionnels implique´s dans la me´thanisation de la cellulose et du me´thanol : diversite´, fonction et influence de la tempe´rature. The`se de doctorat.
13. Davission ML, Weber PK, Pett-Ridge J, Singer S (2008) Development of standards for NanoSIMS analyses of biological materials. Lawrence Livermore National Laboratory (LLNL), Livermore, CA available: https://e-reports-ext. llnl.gov/pdf/363885.pdf.
14. Radajewski S, Ineson P, Parekh NR, Murrell JC (2000) Stable-isotope probing as a tool in microbial ecology. Nature 403: 646–649.