HAL Id: hal-02464970
https://hal.archives-ouvertes.fr/hal-02464970
Submitted on 16 May 2020
HAL is a multi-disciplinary open access
archive for the deposit and dissemination of
sci-entific research documents, whether they are
pub-lished or not. The documents may come from
teaching and research institutions in France or
abroad, or from public or private research centers.
L’archive ouverte pluridisciplinaire HAL, est
destinée au dépôt et à la diffusion de documents
scientifiques de niveau recherche, publiés ou non,
émanant des établissements d’enseignement et de
recherche français ou étrangers, des laboratoires
publics ou privés.
Distributed under a Creative Commons Attribution - NonCommercial - NoDerivatives| 4.0
A synthesis of hourly and daily precipitation extremes in
different climatic regions
Renaud Barbero, Hayley Fowler, Stephen Blenkinsop, Seth Westra, Vincent
Moron, Elizabeth Lewis, Steven Chan, Geert Lenderink, Elizabeth Kendon,
Selma Guerreiro, et al.
To cite this version:
Renaud Barbero, Hayley Fowler, Stephen Blenkinsop, Seth Westra, Vincent Moron, et al.. A
syn-thesis of hourly and daily precipitation extremes in different climatic regions. Weather and Climate
Extremes, Elsevier, 2019, 26, pp.1-20. �10.1016/j.wace.2019.100219�. �hal-02464970�
Weather and Climate Extremes 26 (2019) 100219
Available online 30 August 2019
2212-0947/© 2019 The Authors. Published by Elsevier B.V. This is an open access article under the CC BY-NC-ND license
(http://creativecommons.org/licenses/by-nc-nd/4.0/).
A synthesis of hourly and daily precipitation extremes in different
climatic regions
Renaud Barbero
a,*, Hayley J. Fowler
b, Stephen Blenkinsop
b, Seth Westra
c, Vincent Moron
d,
Elizabeth Lewis
b, Steven Chan
b, Geert Lenderink
e, Elizabeth Kendon
f, Selma Guerreiro
b,
Xiao-Feng Li
b, Roberto Villalobos
b, Haider Ali
b, Vimal Mishra
gaNational Research Institute of Science and Technology for Environment and Agriculture, Mediterranean Ecosystems and Risks, Aix-en-Provence, France bSchool of Engineering, Newcastle University, Newcastle-upon-Tyne, UK
cFaculty of Engineering, Computer and Mathematical Sciences, University of Adelaide, Adelaide, Australia dAix Marseille Univ, CNRS, IRD, INRA, Coll. de France, CEREGE, Aix en Provence, France
eRoyal Netherlands Meteorological Institute, De Bilt, the Netherlands fMet Office Hadley Centre, Exeter, UK
gCivil Engineering, Indian Institute of Technology, Gandhinagar, India
A R T I C L E I N F O Keywords: Hourly precipitation Daily precipitation Precipitation intensity Precipitation duration Seasonal cycle Diurnal cycle CAPE A B S T R A C T
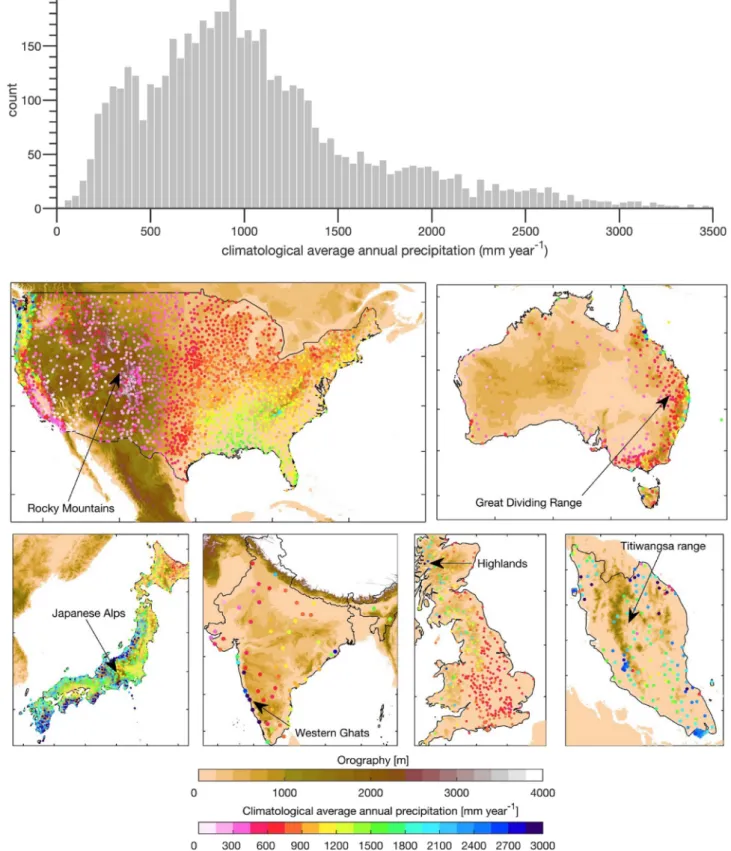
Climatological features of observed annual maximum hourly precipitation have not been documented system-atically compared to those on daily timescales due to observational limitations. Drawing from a quality- controlled database of hourly records sampling different climatic regions including the United States, Australia, the British Isles, Japan, India and peninsular Malaysia over the 1950–2016 period, we examined climatological features of annual maximum precipitation (AMP) across timescales ranging from 1-hr (AMP1 hr)
to 24-hr (AMP24 hr). Our analysis reveals strong relations between the magnitude of AMP and the climatological
average annual precipitation (AAP), with geographic variations in the magnitude of AMP24 hr across topographic
gradients not evident in AMP1 hr. Most AMP1 hr are found to be embedded within short-duration storms (>70%
of AMP1 hr are embedded within 1–5 h storms), especially in regions with low AAP and in the tropical zone.
Likewise, most AMP24 hr are found to be the accumulation of a very limited number of wet hours in the 24-h
period (>80% of AMP24 hr are due to storms lasting <15 h) across many parts of the sampled regions,
high-lighting the added-value of hourly data in estimating the actual precipitation intensities. The seasonal distri-bution of AMP may change across different timescales at a specific location, reflecting the prevalence of different seasonal triggering mechanisms. We also find that most AMP1 hr occur preferentially in late afternoon to late
evening, slightly later than the usual mid-to-late afternoon peak in the mean precipitation intensity. Finally, analysis of atmospheric instability, realized through the convection available potential energy (CAPE), reveals that CAPE is higher before AMP1 hr with respect to AMP24 hr, although the response of precipitation intensity
seems to saturate at higher CAPE levels, a feature evident both in the tropical and extratropical zones. This study provides insights on climatological features of hourly precipitation extremes and how they contrast with the daily extremes examined in most studies.
1. Introduction
Precipitation extremes have received much attention in recent years due to the large impacts they impose on society and their potential
intensification in a warmer climate (Trenberth et al., 2003; Bao et al.,
2017; Pfahl et al., 2017). Extensive research has examined the de-pendency of precipitation intensity on surface temperature or dew point
temperature, and observational studies have shown that the intensities of sub-daily precipitation extremes are even more sensitive to changes in
temperature compared with those on a daily timescale (Westra et al.,
2014; Ivancic and Shaw, 2016; Schroeer and Kirchengast, 2017; Ali and Mishra, 2018), with temperature-extreme precipitation scaling some-times exceeding that of Clausius-Clapeyron (CC): so-called super-CC
scaling (Lenderink and van Meijgaard, 2008; Berg et al., 2013; Loriaux
* Corresponding author.
E-mail address: renaud.barbero@irstea.fr (R. Barbero).
Contents lists available at ScienceDirect
Weather and Climate Extremes
journal homepage: http://www.elsevier.com/locate/wace
https://doi.org/10.1016/j.wace.2019.100219
et al., 2017; Lenderink et al., 2017). Additionally, widespread long-term increases in the magnitude of hourly precipitation extremes have been
documented across parts of the world, including China (Xiao et al.,
2016), the United States (Barbero et al., 2017) and Australia (Guerreiro
et al., 2018), with recent convection-permitting climate model simula-tions projecting a continued intensification into the future due to
anthropogenic climate change (Prein et al., 2016, 2017a; Kendon et al.,
2017). A recent convection-permitting simulation in the United
Kingdom also suggests that the signal of change due to global warming is
likely to emerge in shorter-duration precipitation extremes first (Kendon
et al., 2018).
Records at hourly resolution may thus be more suitable for exam-ining precipitation extremes as they provide a better picture of the
intermittent nature of precipitation (Trenberth et al., 2017) and reflect
the timescale on which convective storms operate and initiate short-duration precipitation extremes which are primarily responsible
for flash floods in fast responding catchments (Doswell et al., 1996;
Brooks and Stensrud, 2000). However, climatological features of hourly precipitation extremes have not been documented systematically across
different climate zones due to observational limitations (Lewis et al.,
2019) and have not been systematically compared with precipitation
extremes on the daily timescales which are used in most studies. For instance, the duration of storms triggering hourly precipitation extremes or the number of wet hours contributing to daily extremes has received little attention. Likewise, the extent to which these events overlap (i.e. concurrent intensity) and how they relate to average annual precipita-tion has been little studied globally, including in regional analyses.
Whereas mesoscale or isolated convective systems in the mid-latitudes have been shown to initiate intense precipitation on short
durations down to a few minutes during the warm season (Prein et al.,
2017b), large-scale systems in the cool season are commonly thought to produce less intense but longer-lasting precipitation and to contribute
mostly to precipitation extremes on daily or longer timescales (Lamjiri
et al., 2017). By contrast, other studies have shown that large-scale systems may also contribute considerably to extreme precipitation on
sub-daily timescales across parts of the world (Luo et al., 2016; Utsumi
et al., 2017; Barbero et al., 2018). The season during which extreme precipitation intensities take place may thus vary across different
du-rations at a specific site (Zheng et al., 2015). Likewise, hourly
precipi-tation intensities over land are also often locked into the diurnal cycle, with the highest intensities observed, in most cases, in late afternoon at least in midlatitude regions during the warm season when precipitation is related to small-scale thermodynamic processes affecting surface
temperature and vertical static stability (Dai and Trenberth, 2004; Evans
and Westra, 2012). Precipitation intensities have also been shown to peak at different times of the day due to other factors such as weather
types (Moron et al., 2019), topographical conditions (Li, 2017),
propa-gation of moist convection (Ploshay and Lau, 2010) or coastal effects
(Kikuchi and Wang, 2008). Examining the diurnal and seasonal timing of precipitation extremes across different timescales may provide more insights into the roles of different climate drivers in producing these extremes.
While climate models may be useful to characterize precipitation globally, a general criticism is that they are not able to explicitly simulate the small-scale convective processes initiating short-duration
precipitation extremes (Dai and Trenberth, 2004; Trenberth et al.,
2017; Yuan et al., 2013; Cort◆es-Hern◆andez et al., 2016; Yuan et al., 2013, 2013; Covey et al., 2016; Beranova et al., 2017; Prein et al., 2015;
Mooney et al., 2017). Large improvements have been found recently for
convection-permitting models (Kendon et al., 2017; Fosser et al., 2014;
Prein et al., 2017b) but such simulations are generally very computa-tionally expensive and can only be executed across limited regions and short time periods. Alternatively, satellite observations could be used to provide an estimate of sub-daily precipitation extremes with global
coverage but only at the time of the satellite overpass (Hur et al., 2016)
and with a spatial resolution that is often too coarse to explicitly detect
small-scale processes conducive to short-lived precipitation extremes. Perhaps most importantly, inferring hourly precipitation amounts from remote sensing is not an easy task and satellite estimates may thus lack credibility for the analysis of precipitation extremes, although data merging exploiting the complementary strengths of gauge, satellite and
reanalysis-based precipitation estimates (Beck et al., 2017) are very
promising.
The observational surface gauge network provides a direct measure of precipitation and, although the data is generally available with limited coverage and is also subject to systematic measurements errors
and inhomogeneities (Blenkinsop et al., 2017), usually describes more
realistically sub-daily precipitation variability and extremes. Unfortu-nately, the lack of sub-daily data sharing across the world has left the research community with little data over limited geographical regions (Zhang et al., 2017), thus hampering global or multi-continental ana-lyses. To bridge this gap, a Global Sub-Daily Rainfall (GSDR) dataset has
recently been compiled (Lewis et al., 2019) from multiple data sources
in an international initiative under the Global Water and Energy
Ex-changes (GEWEX) Hydroclimatology Panel INTENSE project (
Blenkin-sop et al., 2018).
We here examine the climatological features of hourly precipitation extremes in different climatic regions using the GSDR dataset to identify potential universal behaviors. We also examine how they compare to precipitation extremes on daily timescales to highlight the potential added-value of hourly data. Specifically, we sought to establish: 1) how hourly and daily precipitation extremes relate to the climatological average annual precipitation, 2) the proportion of hourly precipitation extremes embedded within daily precipitation extremes, 3) how long are storms producing hourly precipitation extremes and how many wet hours are responsible for daily extremes, 4) the seasonal and diurnal distribution of hourly precipitation conducive to hourly and daily pre-cipitation extremes, and 5) how hourly and daily prepre-cipitation extremes relate to the convection available potential energy (CAPE) to better elucidate the role of atmospheric stability in triggering these extreme events. This study can therefore help in defining the climatological features of precipitation extremes from hourly to daily timescales and provide a better understanding of processes which could then be
eval-uated in numerical models (Cort◆es-Hern◆andez et al., 2016).
2. Data and methods
2.1. Global Sub-Daily Rainfall
The Global Sub-Daily Rainfall (GSDR) dataset used in this analysis
has been constructed from multiple sources (Lewis et al., 2019)
including records from the United States (US), Australia, the British Isles, Japan, India and peninsular Malaysia. We focused on these regions as they provide long and high quality records needed to derive robust statistics and have been extensively used in national studies in the US (Barbero et al., 2017; Canel and Katz, 2018), the United Kingdom (Blenkinsop et al., 2017; Darwish et al., 2018), Australia (Guerreiro et al., 2018; Westra and Sisson, 2011), Japan (Utsumi et al., 2011),
Malaysia (Syafrina et al., 2015) and India (Ali and Mishra, 2018).
Moreover, these macro-regions encompass large latitudinal and topo-graphic gradients from tropical to midlatitude areas, sampling different climate zones over a large spectrum of climatological average annual
precipitation (Fig. 1). We only use gauges with at least 20 years of data
and less than 20% missing hours in any given year, which does not exclude potential extended interruptions in the time series at some sites. Overall, the number of records meeting completeness criteria grows with time from 1 690 station records in 1951 to 3559 records in 1992, and then slightly decreases for the most recent years (except in Japan
and Malaysia (Fig. S1)) to 1 572 records in 2010. Although the coverage
provided by this dataset is not uniform in either space or time and represents an ongoing effort by the international community, the GSDR still represents the most complete direct measurements of hourly
precipitation presently available (Lewis et al., 2019).
All data classified as suspect according to pre-existing quality-control flags were treated as missing. Hourly measurements were aggregated up to 3-h, 6-h, 12-h and 24-h using fixed intervals (e.g. 0 000–0300, 0 300–0600, for 3-h data; 0 000–0600, 0 600–1200, for 6-h data and so on) relative to local time (i.e. daily accumulation are calculated from
midnight to midnight). In the following, we only report results for 1-hr and 24-hr as analyses of intermediate durations only show a transition between the characteristics shown at 1-h and 24-hr (not shown).
Fig. 1. Top) Number of hourly records as a function of the climatological average annual precipitation (AAP) across all regions investigated in this study. Bottom) Orography (meters) alongside climatological average annual precipitation.
2.2. Annual maximum precipitation
We focus on annual (Jan–Dec) maximum precipitation across various
resolutions ranging from 1-h (AMP1 hr) to 24-h (AMP24 hr). This simple
block maxima approach is often used in hydrology to produce estimates of return periods with the advantage that the observations are inde-pendent and identically distributed. Note here that the use of moving windows rather than a midnight-to-midnight accumulation would yield better estimates of the size of 24-h events as AMP values were found to be on average ⇠1.15 times higher when considering moving windows
compared to fixed windows (Boughton and Jakob, 2017; Morbidelli
et al., 2017). However, given that this procedure cannot be applied to 1-h events whose precipitation depth is constrained by the fixed in-tervals of measurements, we decided to use fixed inin-tervals for a fair comparison across durations. For each gauge we estimate the return levels of AMP across various resolutions ranging from 1-h to 24-h using a generalized extreme value distribution fitted with the maximum
likeli-hood estimator (Katz et al., 2002) under the assumption of a stationary
climate. This assumption is obviously questionable in the global warming context and is likely to cause an underestimation of today’s return levels in AMP across many regions of the world. However, this study does not seek to examine potential non-stationarity in precipita-tion extremes but only climatological features across timescales.
2.3. Annual maxima characteristics
Separately, we examine three statistics:
1. We calculate the percent of AMP1 hr that are embedded within
AMP24 hr events (referred hereafter to as concurrent intensity) using
a 1-day padding tolerance. In other words, an AMP1 hr event is
included as embedded if it is within 1-day of a AMP24 hr. The 1-day
padding may seem generous but the use of fixed intervals (i.e.
0 000–2 400 for AMP24 hr) is expected to decrease the probability of
embedding. The 1-day padding enables us to relate AMP1 hr and
AMP24 hr separated by a few hours (and thus belonging to the same
meteorological event) but taking place on two consecutive days.
2. We report on the duration of storms triggering AMP1 hr and the
number of wet hours contributing to AMP24 hr. The duration is
defined here as the length of time from precipitation initiation (any hour 1 mm) to precipitation cessation and does not include any period of dry hours. Note that changes in the resolution of mea-surements (from 0.25 to 2.5 mm) were observed in the US at some
stations (Groisman et al., 2012; Barbero et al., 2017), resulting in
both spatial and temporal inhomogeneities, as storm duration is likely to be underestimated at stations measuring precipitation at a coarser resolution. However, this inhomogeneity is minimized through the use of the 1 mm threshold and is not expected to intro-duce any systematic geographic bias as changes in the bucket size are randomly distributed in space (not shown). This inhomogeneity is rather expected to affect temporal analyses which are not addressed in this study.
3. We estimate the contribution of AMP1 hr to the corresponding total
24-hr accumulation (referred hereafter to as AMP1 hr
P24 hr 100) as an
indi-cator of triggering mechanisms (Blenkinsop et al., 2017).
2.4. Dependency on climatological average annual precipitation
All the aforementioned statistics are computed at the site level and then averaged along a climatological average annual precipitation
(AAP) gradient (Fig. 1, top). Note that AAP is by no means a universal
metric of surface dryness or wetness, which is dependent on additional
variables such as temperature and evaporation (Sippel et al., 2017), but
simply reflects how much precipitation reaches the surface on average on a yearly basis. Recording sites were pooled together using a binning
method along the AAP gradient using moving 500 mm year 1 bins, in
order to gather a decent number of records along the AAP gradient (Fig. 1, top). The spatial average of the aforementioned statistics within each bin was weighted by the mean distance between one record and the remaining ones, so that less weight was given to the most densely
monitored regions following Moron et al. (2019). The 95% confidence
intervals of the composite means were computed using 1 000 boot-strapped datasets with replacement sampling at random 50% of the records in a given bin. The 2.5th and 97.5th percentiles of the composite means from the bootstrapped dataset were then used to derive an en-velope of confidence.
2.5. Tropical versus extra-tropical zones
We also investigate the aforementioned statistics for the tropical and extra-tropical zones separately. The tropical zone is defined here as the
region equatorward of 25∘ latitude.
2.6. Seasonal distribution of AMP
Amplitude and phase of climate cycles are generally examined
through harmonic analyses (Dai and Trenberth, 2004; Wu et al., 2017).
Here, we analyzed the seasonality of AMP across timescales by consid-ering first the modal month during which most AMP take place, and second the fractional distribution of months during which they occur. Whereas the modal month indicates when the AMP is most likely to take place, the fractional distribution provides insights into how uniformly distributed AMP are across the year. The fractional distribution of AMP across the year was measured through the Gini coefficient, an index that
has recently been used in hydroclimate studies (Masaki et al., 2014;
Rajah et al., 2014). For each record, the frequency of AMP occurrence was computed for each month of the year, sorted by ascending order, summed cumulatively and then converted into a proportion of time
expressed by yiÖi à 1; …; nÜ with n à 12. The Gini coefficient G is defined
as
G à 1n✓n á 1 2✓Pnià1Ön á 1P iÜyi n ià1yi
◆◆
The coefficient ranges within [0,1]. If G à 0, the frequency of AMP is constant throughout the year without any monthly variation (uniform distribution of frequencies). If G à 1, all AMP occur during one month of the year with no occurrences for the rest of the year. The Gini coefficient, G, was calculated for each gauge using all years available which met the completeness criteria.
The distribution of AMP across the year was tested against uniformly distributed random numbers. To do so, we generated 1 000 random uniform distributions of length N à 12 and the resulting empirical dis-tribution of the Gini coefficients was used to derive the 95% significance level from the resulting collection of estimates.
2.7. Diurnal distribution of AMP
We examined the diurnal distribution of AMP1 hr by computing for
each record the hourly frequency of AMP1 hr as expressed by
HiÖi à 1; …; nÜ with n à 24 and by extracting the time of the day for the
maximum number of occurrences (modal hour). We then compared the
diurnal distribution of AMP1 hr with that of the hourly peak intensity of
AMP24 hr. The Gini coefficient was also estimated for the diurnal
dis-tribution following the same method as described above.
2.8. Convection available potential energy conducive to AMP1 hr and
AMP24 hr
Atmospheric instability, often realized through the convection available potential energy (CAPE), is generally thought to facilitate the
occurrence of precipitation extremes. Indeed, CAPE is a widely used measure that reflects to some extent the vertical velocity, which controls
the condensation rate and precipitation intensity (Lepore et al., 2015;
Lenderink et al., 2017). CAPE may thus provide insight on how “convective” precipitation extremes are. We investigate here the de-pendency of both hourly and daily precipitation extremes on CAPE and how this dependency varies in different climatic regions. CAPE forecasts
were extracted from ERA-Interim reanalyses (Dee et al., 2011) over the
1979–2016 period at 0.75 resolution. Forecasts are initialized at 0 000 and 1 200 UT and provide the instantaneous CAPE on a three-hourly basis. The three-hourly data has been interpolated to the GSDR gauges using a cubic weighting and then interpolated onto the hourly timescale using a spline function.
We examine CAPE both 24 h prior to and 24 h following AMP1 hr
and the hourly peak intensity of AMP24 hr in the corresponding grid cell.
We illustrate this relationship through four selected examples including Florida US, Kyushu Japan, northern Australia and the southern UK to elucidate how these events relate to atmospheric stability in both
trop-ical and extra-troptrop-ical zones. We then examine for AMP1 hr and
AMP24 hr the sensitivity to the maximum CAPE level observed over a
period extending from 24 h prior to AMP1 hr and to the hourly peak
intensity of AMP24 hr as CAPE is notoriously known to weaken as soon
as precipitation forms. Stations are then pooled together based on the maximum CAPE levels associated to AMP following the procedure
described in section 2.4. We report on the mean AMP1 hr/AMP24 hr as
well as the distribution of recording sites along the CAPE gradient.
Finally, we examine the sensitivity of AMP1 hr (AMP24 hr) to both CAPE
and storm duration (number of wet hours contributing to AMP24 hr)
though a bivariate analysis. 3. Results and discussion
3.1. Climatological features of AMP1 hr vs AMP24 hr
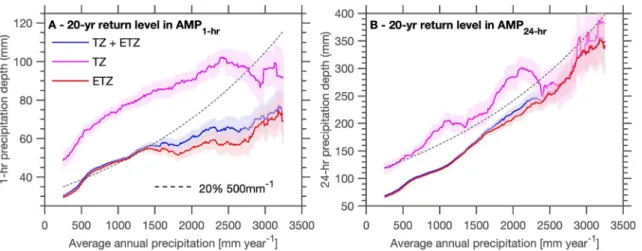
Fig. 2 shows the 20-yr return levels of AMP1 hr (Fig. 2a) and
AMP24 hr (Fig. 2b) along the AAP gradient. As expected, AMP24 hr
clearly intensify with AAP as seen in Benestad et al. (2012) with a rate of
intensification close to 20%/500 mm year 1 across a large moisture
range. In other words, regions with higher AAP have also the highest daily extremes. Interestingly, this rate of intensification is somewhat
lower for AMP1 hr in regions with higher AAP and this result holds in
both tropical and extra-tropical climates. This could be indicative of either an absence of relationship between hourly (convective) storms
and the moisture background in regions with higher AAP or a saturation effect of precipitation intensity. By contrast, the daily timescale aggre-gates light-to-moderate wet hours in precipitation-prone regions due to either favourable large-scale moisture advection or orographic effects
collectively providing more scope for AMP24 hr to increase at a higher
rate. In other words, moisture availability and favourable circulation
patterns are needed to sustain AMP24 hr while this effect is more limited
at the hourly timescale.
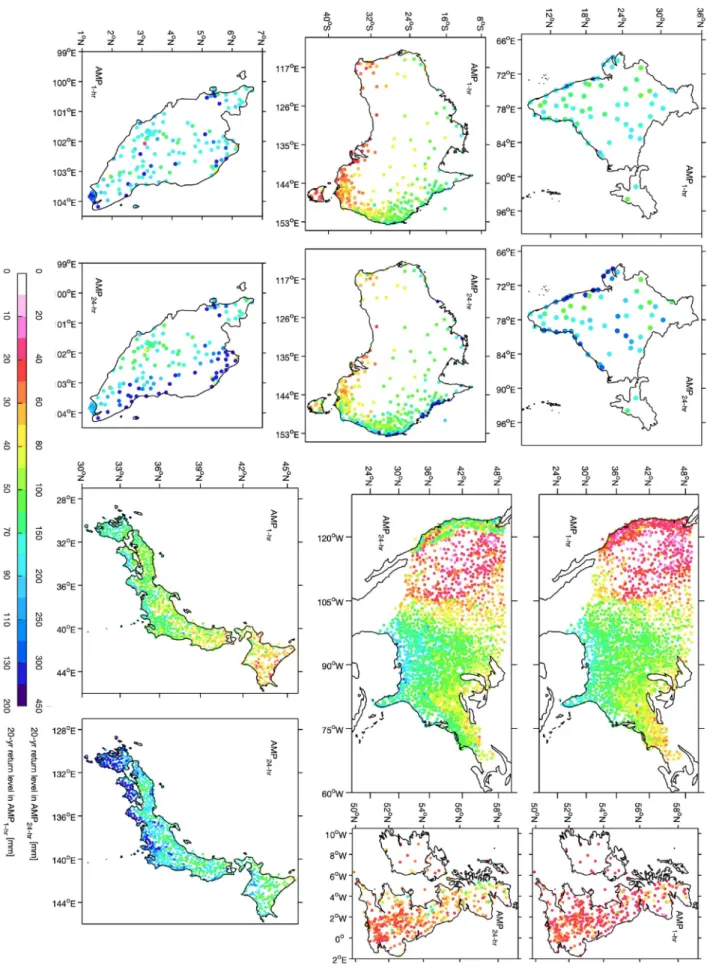
While both AMP1 hr and AMP24 hr are generally higher in the
tropical zone, striking differences between AMP1 hr and AMP24 hr are
evident in complex terrains (Fig. 3). Orographic enhancement of
pre-cipitation extremes featuring higher return levels along windward sides
seem to emerge mostly in AMP24 hr and are less pronounced in AMP1 hr
as seen along the west coast of the US, the eastern coastline of Australia (windward side of the Great Dividing Range) and peninsular Malaysia as well as the western coastlines of the UK (windward side of the High-lands) and India (windward side of the Western Ghats). This suggests
that AMP1 hr are mostly determined by the moisture content of storms
and are, unlike their daily counterparts, less sensitive to orographic
ef-fects, corroborating the results reported in Fig. 2.
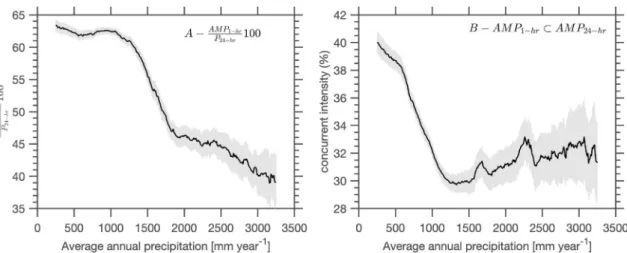
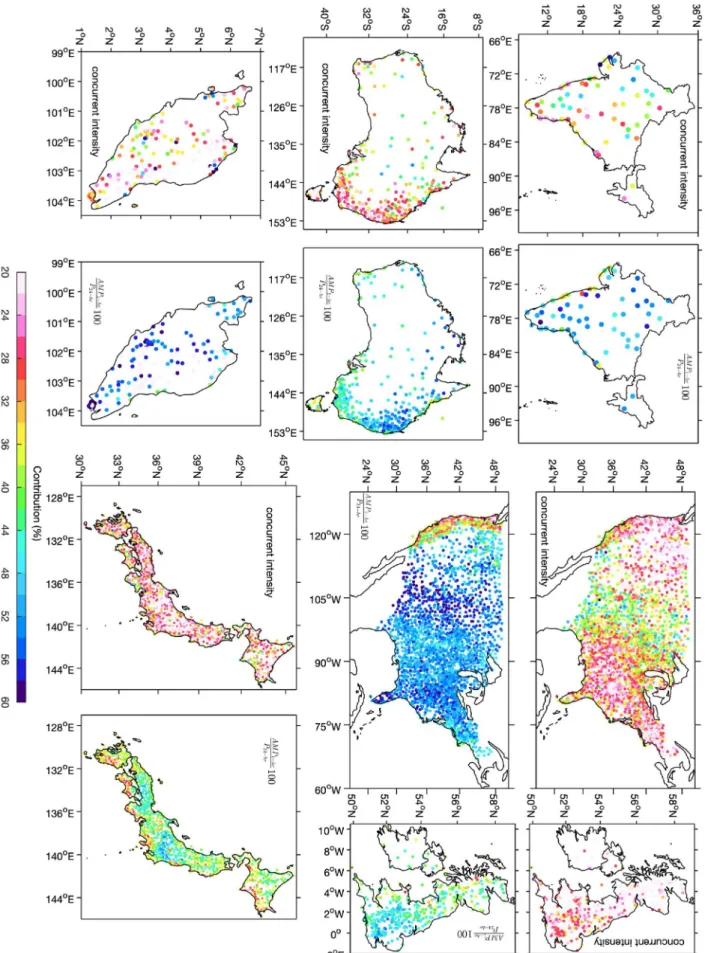
The concurrent intensity and AMP1 hr
P24 hr 100 are highest in regions of low
AAP (Fig. 4), exceeding 30% and 55% respectively at AAP below
1 500 mm year 1. The concurrent intensity exceeds 30% in India, parts
of Australia and in the central US (Fig. 5), a region where both AMP1 hr
and AMP24 hr are highly concentrated in spring/summer (see below
section 3.2) due to the seasonal interaction of the Great Plain low-level
jet with synoptic-scale flow (Wu and Raman, 1998). Collectively, these
results suggest that hourly precipitation extremes in the central US are
strong contributors to daily precipitation extremes. Also, AMP1 hr
P24 hr 100
appears to be much lower along windward sides where large-scale and persistent systems can sustain long-duration storms and where orographic enhancement can sustain a near-constant distribution of high precipitation rates over 24-hr. This is particularly evident along the west coast of the US and the British Isles as well as the east coast of peninsular Malaysia and Japan.
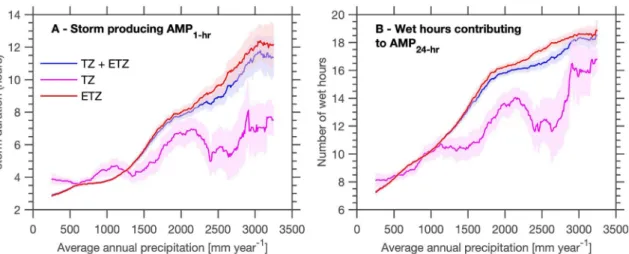
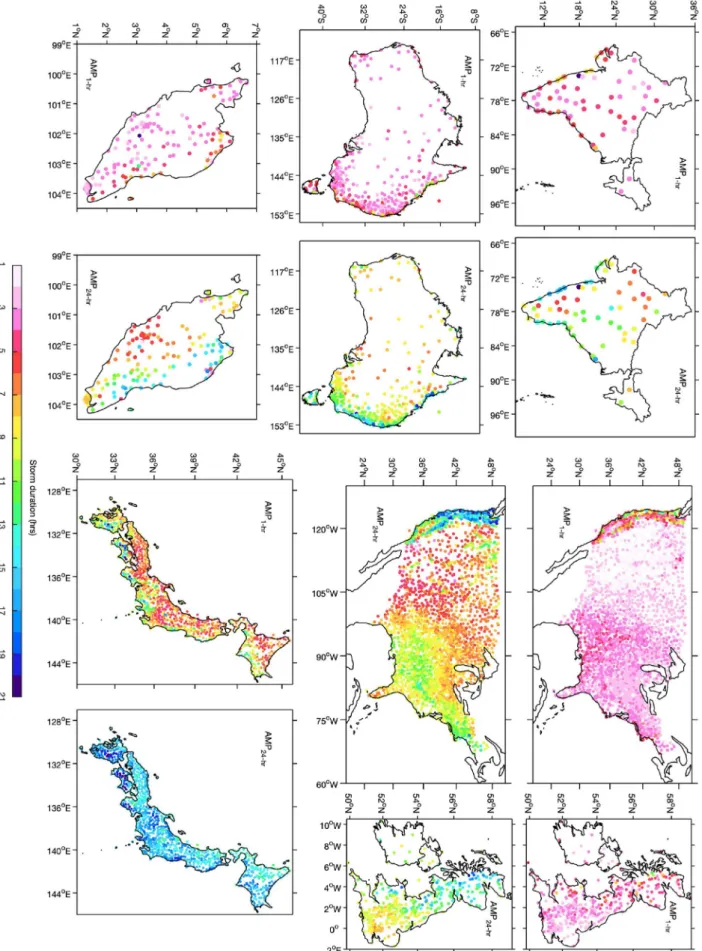
The duration of storms initiating AMP1 hr as well as the number of
wet hours contributing to AMP24 hr both increase with AAP (Fig. 6).
Globally, we find that >70% (95%) of AMP1 hr are embedded within
1–5 (1–10) hour storms (not shown) indicating that AMP1 hr are
asso-ciated on average with short-to-medium duration storms. This is
particularly evident in the tropical zone (Fig. 6a), suggesting that the
impact of cyclones on AMP1 hr might be quite limited. Indeed, a tropical
Fig. 2. 20-yr return level of a) AMP1 hr and b) AMP24 hr as a function of the climatological average annual precipitation (AAP) gradient in the tropical zone (TZ),
extra-tropical zone (ETZ) and both tropical and extra-tropical zones combined (TZ á ETZ). The 20-yr return levels were estimated from a generalized extreme value distribution of AMP observed at each rain gauge. The 95% confidence intervals of the composite means were computed using 1 000 bootstrapped datasets sampling at random 50% of the records in each AAP bin. The envelope of confidence indicates the 2.5 and 97.5 percentile of the composite means from the bootstrapped datasets. The dashed lines indicate a rate of intensification of 20% 500 mm 1.
Fig. 3. 20-yr return level of AMP1 hr and AMP24 hr. The 20-yr return levels were estimated from a generalized extreme value distribution of AMP observed at each
gauge. Note that the labels of the color bar indicate precipitation depth for AMP1 hr (bottom) and AMP24 hr (top). Both color bars are non-linear. (For interpretation
cyclone is unlikely to intercept landfall at the same location on an annual basis and the precipitation depth measured locally may not be as high as precipitation produced by a convective storm from the Eulerian perspective of a meteorological recording station. The primary excep-tions are the US northwest coast and the coastal fringe of eastern Japan
where storms initiating AMP1 hr are much longer and may last a full day
(Fig. 7).
More interesting is the limited number of wet hours contributing to AMP24 hr (Fig. 6b). Globally, <10 (15) wet hours are responsible for
>50% (80%) of AMP24 hr. This can be seen across Australia (<10 wet
hours), in the southeast of the British Isles (<10 wet hours), western
Malaysia (<7 wet hours) or the central US (<5 wet hours) (Fig. 7) where
precipitation extremes are often related to short-lived mesoscale convective complexes that have been found to persist for about 10 h (Laing and Fritsch, 1997). Using daily data in these regions would strongly underestimate the actual precipitation intensity during wet hours.
3.2. The seasonal distribution of AMP1 hr and AMP24 hr
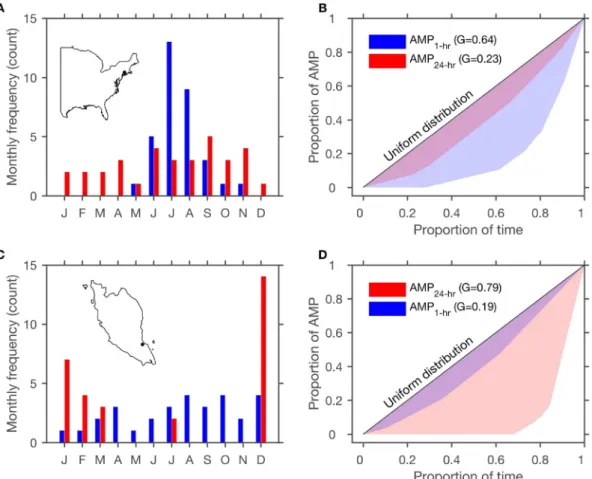
Two contrasting examples illustrating the seasonal timing as well as
the degree of seasonality of both AMP1 hr and AMP24 hr are provided in
Fig. 8. For a station located in Northeast, US (Fig. 8,a-b), it can be seen
that the seasonality is stronger for AMP1 hr (higher G) with a strong
peak in July–August while AMP24 hr are more spread throughout the
year and can occur at other times of the year (lower G). This reflects the fact that intense hourly storms in this area are clearly locked onto the seasonal cycle of convection and occur only during summer months while longer-duration extremes, tied to large-scale circulation operating independently from the local convection, are more evenly spread throughout the year. However, a contrasting example in Malaysia (Fig. 8c–d) suggests that the seasonal distribution may become wider for shorter-duration AMP (lower G). Indeed, short-duration convective storms in this region are generally possible at any time of the year due to the proximity to ocean and overall high humidity levels with a prefer-ential timing during the inter-monsoon seasons in peninsular Malaysia (Syafrina et al., 2015). Conversely, longer-duration extremes on the eastern side of the peninsula are strongly linked to seasonal large-scale monsoonal systems between December and March conveying enough moisture and favourable horizontal-vertical atmospheric structure to sustain precipitation extremes over daily or longer timescales. These two contrasting examples illustrate the complex seasonalities of precipita-tion extremes across timescales.
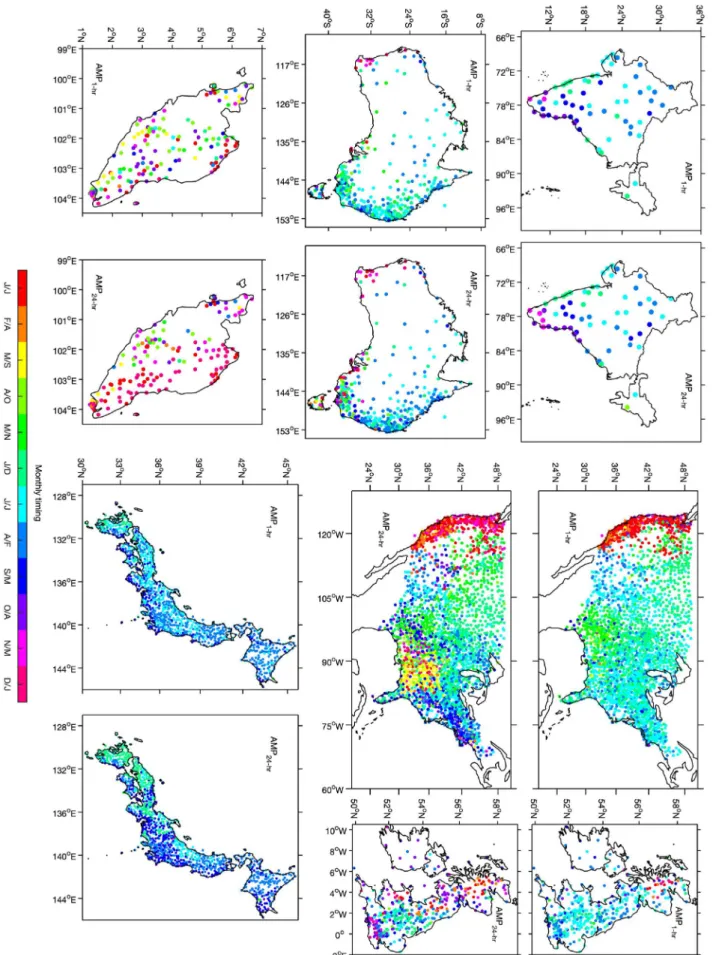
Fig. 9 focuses on the modal month of occurrence for AMP1 hr and
AMP24 hr at each site and provides a more global picture of these
sea-sonalities. While most AMP1 hr and AMP24 hr are well locked onto the
seasonal cycle and clearly occur in the summertime across much of the eastern two-thirds of the US, Japan, the British Isles and across much of Australia and India, they can also take place in the winter across parts of the world including Northwest Scotland, the coastline of Southwest Australia or the west coast of the US when atmospheric rivers embedded within jet stream events penetrate inland and initiate extreme storms
along the windward coast (Rutz et al., 2014; Barbero et al., 2018). The
seasonality may change at a specific location across resolutions
switching from a summer-driven regime for AMP1 hr to a winter-driven
regime for AMP24 hr as seen in the Northeast US and the western
windward side of the British Isles, reflecting the dominant role of large-scale (small-scale) systems in the cool (warm) season on longer-duration (shorter-duration) extremes. Changes in the seasonal timing of AMP over short distances may also reflect changes in wind regimes across the year, as seen in peninsular Malaysia where most AMP24 hr along the eastern (western) side take place in
Decem-ber–January (late winter/early spring) during the Northeast (South-west) Monsoon. Again, this windward/leeward contrast is less evident in
AMP1 hr, which are less dependent on large-scale circulation.
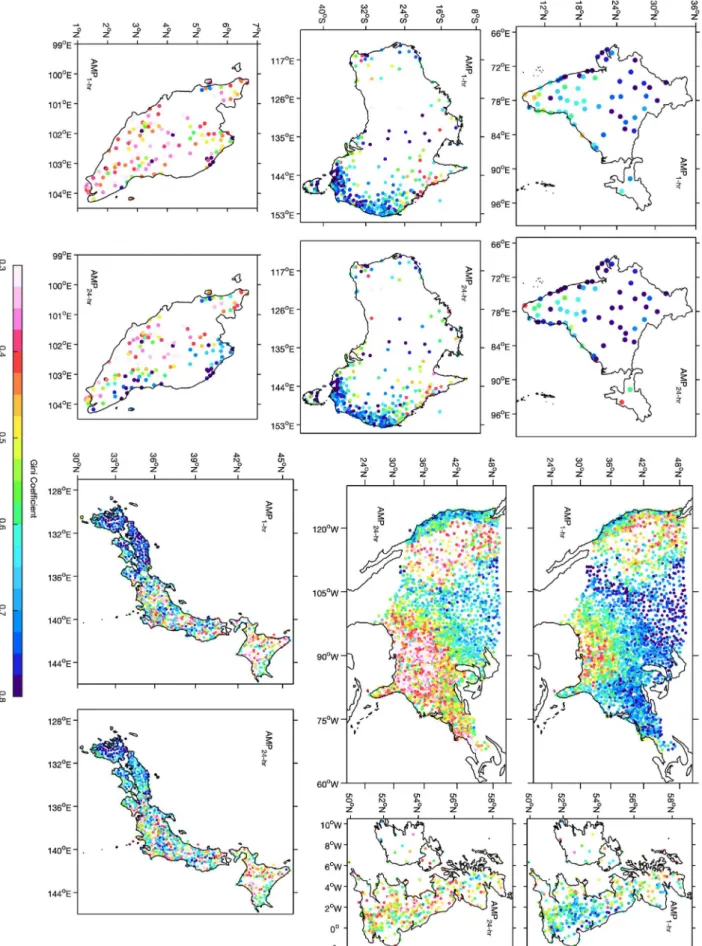
As expected, the seasonal concentration of AMP1 hr is generally
stronger (higher G) than that of AMP24 hr (Fig. S2) but some opposing
trends are found in India, along the east coast of Malaysia (Fig. 10)
where AMP24 hr occur specifically during the December–January
monsoonal season (see Fig. 8,c-d) or along the coastal fringe of the
western US where only cool-season atmospheric rivers can sustain such
intensities over 24-hr (Lamjiri et al., 2017). The strongest seasonality for
AMP1 hr is observed in Japan, tropical northern Australia and in a
re-gion extending from New Mexico in the US to the northern Great Plains where precipitation is concentrated both seasonally and into intense
storms (Canel and Katz, 2018). It is of interest to note that in these
re-gions, the wet season is generally the season during which the AMP is most likely to occur. By contrast, the lowest seasonalities are mostly found in regions where AMP takes place outside the rainy season, as seen for instance in Malaysia or southern Australia. In other words, the sea-sonality of annual maxima tends to be greatest when AMP is cyclical (i.e. AMP takes place in the wet season), whereas it tends to be less when it is counter cyclical (i.e. AMP can occur in the dry season).
3.3. The diurnal distribution of AMP1 hr and the hourly peak intensity of
AMP24 hr
For each gauge we examine the modal hour of AMP1 hr and of the
Fig. 4. a) Mean contribution (%) of AMP1 hr to the corresponding total 1-day accumulation referred here to as AMPP24 hr1 hr100 as a function of the average annual
precipitation (AAP) gradient. b) Percent of AMP1 hr embedded within AMP24 hr with a 1-day tolerance referred to here as concurrent intensity as a function of the
AAP gradient. The 95% confidence intervals of the composite means were computed using 1 000 bootstrapped datasets sampling at random 50% of the records in each AAP bin. The confidence envelope indicates the 2.5 and 97.5 percentile of the composite means from the bootstrapped datasets.
Fig. 5. Mean percent of AMP1 hr embedded within AMP24 hr with a 1-day tolerance (referred here to as concurrent intensity) and mean contribution (%) of AMP1 hr
to the corresponding total 1-day accumulation (referred here to as AMP1 hr P24 hr 100).
hourly peak intensity of AMP24 hr (Fig. 11). The timing of these
ex-tremes involves a range of key mechanisms including the destabilization of the boundary layer due to thermal convection, topographic lifting or
land-sea breezes (Evans and Westra, 2012). For a large portion of the
regions, AMP1 hr occur preferentially in the late afternoon (from
17:00–20:00). Atmospheric instability through solar heating generally initiates moist convection in mid-afternoon, but convective systems reach their precipitation peak a few hours later. This is in agreement with previous analyses reporting on a similar peak in the mean hourly precipitation intensity in mid-to-late afternoon in summer over northern
midlatitude land areas (Dai, 2001; Dai and Trenberth, 2004) and the
tropical zone (Kikuchi and Wang, 2008). The diurnal distribution of
AMP1 hr is clearly stronger (higher G) than that of the hourly peak
in-tensity of AMP24 hr (which are more evenly distributed throughout the
day) especially in Australia, Malaysia and Japan (see Fig. 11 but also
Figs. S3 and S4), indicating that AMP1 hr is more dependent on the
diurnal cycle. Surprisingly, AMP1 hr may also occur during the night
(from 21:00–24:00) across large portions of the world including tropical Australia, Japan, India and the central part of Malaysia. This night-time peak had already been observed across the central US east of the Rockies (Ploshay and Lau, 2010; Mooney et al., 2017) due to the initiation and downslope propagation of moist convection over the Rockies and the adjacent Great Plains, but was generally thought to be an exception. The delay between the usual peak in the mean precipitation intensity in
mid-to-late afternoon and the night-time occurrence of AMP1 hr in many
regions may relate to the size and the organization of the systems
initiating AMP1 hr. It is likely that these annual maxima are related to
large convective systems. Precipitation-cell size and intensity have been
shown to be positively correlated (Lochbihler et al., 2017). Indeed, large
organized mesoscale convective systems have lifetimes often exceeding
6–10 h (Feng et al., 2012) and often reach their maximum extent during
nighttime (Laing and Fritsch, 1997), which could be related to radiation
effects or the occurrence of a noctural low-level jet feeding intense
convection (Laing and Fritsch, 1997), but also to the time needed to
amalgamate smaller cloud systems into larger organized structures (Houze Jr, 2004; Moseley et al., 2016).
AMP1 hr also take place later (from 21:00–24:00) in the central part
of Malaysia and a few hours earlier (from 17:00–20:00) in the northern and southern parts of the peninsular. This may be due to the combina-tion of moisture flux convergence with the longitudinal extent of the peninsular expanding in the central part and thus delaying the timing of AMP1 hr with respect to coastal regions further south and north. This
propagation of the diurnal cycle with AMP1 hr occurring earlier in
coastal regions and propagating inland is also evident to some extent in
other islands such as Japan and the British Isles and is often referred to
as the diurnal marches (Garreaud and Wallace, 1997).
Early morning timings in the hourly peak intensity of AMP24 hr
around 05:00–08:00 are evident across parts of the US but also in coastal sectors of Japan, Southern Australia or the western side of the British
Isles as seen in Covey et al. (2016) and Kikuchi and Wang (2008) due to a
peak in relative humidity (Dai, 2001) and to the differential heating
between water and land surfaces that can generate local circulations.
Very few AMP1 hr occur at that time of the day in our analysis
sug-gesting that this early timing pertains only to less intense long-duration
storms as recently observed in the UK (Xiao et al., 2018).
3.4. Atmospheric stability associated to AMP1 hr and AMP24 hr
Fig. 12 illustrates the actual CAPE level observed 24 h prior to and
24 h after AMP1 hr and the hourly peak intensity of AMP24 hr in four
selected regions of the world spanning tropical (Northern Australia), subtropical (Kyushu, Southern Japan and Florida, Southeast US) and
midlatitude (Southern part of the British Isles) climates. AMP1 hr are
clearly associated with higher CAPE compared to the hourly peak
in-tensity of AMP24 hr and, in both cases, CAPE reaches a maximum 1–2 h
before the peak intensity of precipitation. The slight delay between the
peak in CAPE and AMP1 hr is not surprising as deep convection is
ex-pected to weaken CAPE through different mechanisms, including the upward transfer of heat released by the condensation of latent heat and the downdrafts cooling the lower troposphere through evaporation (Davies et al., 2013; Dong et al., 2018). Previous studies have suggested that antecedent CAPE might be a better predictor for subsequent
convective precipitation (Davies et al., 2013). The secondary peak seen
in Florida likely reflects the lag between the timing of some AMP with respect to the strong diurnal cycle included in CAPE in this region.
Based on the whole dataset, Fig. 13 shows that AMP1 hr (AMP24 hr)
intensify with increasing CAPE until 1 500 (1 000) Joules kg 1, a
threshold above which AMP1 hr (AMP24 hr) saturates as observed in
regional analyses in China (Dong et al., 2018), the central US (McCorkle
et al., 2016) and northern Australia (Davies et al., 2013). This saturation effect in precipitation intensity in response to CAPE shows that addi-tional factors such as specific humidity or dew point temperature (Lepore et al., 2015) also play a role at higher CAPE levels. As expected,
this saturation effect emerges in AMP24 hr first as high CAPE is in
gen-eral very localized and favours rather short-lived intense storms. Long-lasting precipitation systems such as tropical cyclones, mesoscale convective complexes or frontal systems have in general low-to-moderate CAPE levels but cover large areas and move relatively
Fig. 6. a) Mean duration (hours) of storms initiating AMP1 hr as a function of the climatological average annual precipitation (AAP) gradient in the tropical zone
(TZ), extra-tropical zone (ETZ) and both tropical and extra-tropical zones combined (TZ á ETZ). b) Same as a) but for the number of wet hours contributing to AMP24 hr. The 95% confidence intervals of the composite means were computed using 1 000 bootstrapped datasets sampling at random 50% of the records in each
slowly, resulting locally in large precipitation accumulations
contrib-uting to AMP24 hr.
By contrast, the relation between CAPE and AMP1 hr is stronger in
both tropical and extra-tropical zones as elevated CAPE levels over land
have been linked to scattered thunderstorms (Rutledge et al., 2002)
whose limited spatial extent do not really inhibit the surface warming
and the resulting CAPE. However, a saturation effect in AMP1 hr is still
observed at 1 500 J kg 1 (although this threshold is likely to vary
regionally) and is likely due to the short life cycle of convective storms
(<1 h) at higher CAPE levels. Dong et al. (2018) and Lepore et al. (2015)
also noted that the conversion of CAPE into kinetic energy becomes less efficient at higher CAPE and that convective inhibition may suppress the occurrence of updrafts even in the presence of higher CAPE levels. Additionally, higher CAPE levels with vertical wind shear and a strong steering flow can both contribute to fast-moving deep convective sys-tems, producing low local precipitation amounts.
Higher CAPE levels coincident with or prior to AMP1 hr are seen in
the central US and central Japan (Fig. 14), suggesting that the late-
afternoon and night-time AMP1 hr in these regions (Fig. 11) are
mostly convective in nature. While AMP1 hr are associated with average
maximum CAPE levels ranging from 1 000 to 1 500 J kg 1 across
peninsular Malaysia, AMP24 hr, generally thought to relate to large-
scale monsoonal systems, take place under more stable conditions along the windward side, with CAPE values ranging from 300 to
800 J kg 1, highlighting the weaker influence of convective processes on
daily extremes. These CAPE levels are above average for the time of the
year (Fig. S5), especially during AMP1 hr events, suggesting that the
difference between CAPE-triggering AMP1 hr and AMP24 hr is not only
due to their seasonality.
Finally, Fig. 15 summarizes some of the results shown above by
depicting the overall mean AMP1 hr across all regions in a two-
dimensional space depicted by both CAPE level and the duration of
storm producing AMP1 hr. As shown previously, AMP1 hr are more
sensitive to the spatial CAPE gradient (Fig. 15, left) and less sensitive to
storm duration (Fig. 15, top). Note that AMP1 hr increases with storms
>15 h but these conditions are only representative of a few sites mostly
located in southern Japan (see Fig. 7). The climate-niche associated with
the highest mean AMP1 hr was defined by a CAPE level ranging from
1 300 to 1 600 J kg 1 (Fig. 15, middle) and storm duration ranging from
10 to 15 h storms. By contrast, mean AMP24 hr clearly increases in a
linear fashion with an increasing number of wet hours (Fig. 16, top) but
responds only modestly to increased CAPE (Fig. 16, left) with most
AMP24 hr fed by 10–15 wet hours under rather low CAPE conditions.
This recipe is obviously likely to vary regionally. 4. Summary
This study provides 1) a multi-continental climatology of observed hourly and daily precipitation extremes, their magnitude, and their dependence on climatological average annual precipitation (AAP), 2) the mean length of storm producing hourly precipitation extremes as well as the mean number of wet hours responsible for daily extremes, 3) a climatology of their seasonal distribution, 4) a climatology of their diurnal distribution, and 5) an assessment of their dependence on at-mospheric stability across different climatic regions. The primary con-clusions are:
Fig. 8. a) Example of the monthly distribution of AMP1 hr (blue) and AMP24 hr (red) for one station in the Northeast US. b) The Gini coefficient is reported for each
resolution and is calculated as twice the area between the 1:1 line and the Lorenz curve representing the relationship between the proportion of time and the proportion of AMP (see Methods for further details). c-d) Same as a-b but for one station in Malaysia. (For interpretation of the references to color in this figure legend, the reader is referred to the Web version of this article.)
Fig. 9. Modal month of occurrence for AMP1 hr and AMP24 hr. The seasonality was reversed for the southern hemisphere such that the colorbar refers to the same
Fig. 10. Monthly distribution of AMP1 hr and AMP24 hr as measured by the Gini coefficient. Gini coefficients exceeding 0.46 are statistically significant at the 95%
confidence level. The significance was estimated from 1 000 random uniform distributions of length N à 12. The resulting empirical distribution was then used to derive the 95% significance level from the resulting collection of estimates.
Fig. 11. Modal 4-h blocks during which AMP1 hr and the hourly peak intensity of AMP24 hr take place. Following Evans and Westra (2012), the
saturation/-transparency indicates the strength of the diurnal distribution as measured by the Gini coefficient. Gini coefficients exceeding 0.42 are statistically significant at the 95% confidence level. The significance was estimated from 1 000 random uniform distributions of length N à 24. The resulting empirical distribution was then used to derive the 95% significance level from the resulting collection of estimates.
1) The magnitude of AMP correlates to the APP, with a rate of
inten-sification of the 20-year return level of AMP24 hr of about 20% per
500 mm year 1 increase in the AAP. We find that AMP1 hr intensify
at a slower rate but this does not prove that there is an upper constraint on short-duration extremes or a theoretical maximum of
how intense AMP1 hr can be. Hourly data mostly reflects the
convective scale which is thought to be relatively constant across different climates, as opposed to daily data that integrates
convection but also other processes responsible for precipitation duration such as large-scale dynamics, orographic effects, the spatial extent of the storm and its travelling speed. The link between wet- day mean precipitation and daily precipitation extremes has
already been emphasized by Benestad et al. (2012) and may be used
to deduce information on extreme values from the climatological state of a given site. Similar methods linking the AAP, the wet-hour mean precipitation or another metric based on the entire distribution
Fig. 12. Actual CAPE both 24 h prior to and 24 h following AMP1 hr (blue) and the hourly peak intensity of AMP24 hr (red) in four specific regions. The 95%
confidence intervals of the composite means were computed using 1 000 bootstrapped datasets sampling at random 50% of the records in each region (see map in the insert). The confidence envelope indicates the 2.5 and 97.5 percentile of the composite means from the bootstrapped datasets. (For interpretation of the references to color in this figure legend, the reader is referred to the Web version of this article.)
Fig. 13. a) Mean AMP1 hr and b) AMP24 hr as a function of the maximum CAPE level observed over a period extending from 24 h prior to AMP1 hr and to the hourly
peak intensity of AMP24 hr in the tropical zone (TZ), extra-tropical zone (ETZ) and both tropical and extra-tropical zones combined (TZ á ETZ). The 95% confidence
intervals of the composite means were computed using 1 000 bootstrapped datasets sampling at random 50% of the records. The confidence envelope indicates the 2.5 and 97.5 percentile of the composite means from the bootstrapped datasets.
of hourly rainfall to extreme events would be valuable when sample size issues arise.
2) Most AMP1 hr are initiated by short-duration storms (1–5 h), with
storm duration increasing with AAP. Likewise, AMP24 hr are found
to be the product of a limited number of wet hours ranging from about 7 h in regions of low AAP to 18 h in regions of high AAP, highlighting the added-value of hourly data in estimating actual precipitation intensity.
3) The seasonal distribution of AMP varies across different timescales and reveals complex patterns, with regional variations reflecting the prevalence of different seasonal triggering mechanisms. Most AMP1 hr in the midlatitudes are found to be strongly locked onto the
seasonal cycle and generally occur during summer-time while AMP24 hr occur more evenly throughout the year. The seasonality of
AMP can even switch at a specific location across different durations. This general pattern may reverse in monsoonal climates where the
seasonality of AMP24 hr is better defined than that of shorter-
duration AMP due to their strong dependence on the seasonal migration of large-scale systems such as the inter-tropical conver-gence zone.
4) AMP1 hr occur preferentially in late afternoon to late evening in
most parts of the world, slightly later than the peak generally observed in the mean diurnal cycle of precipitation intensity. This delay may be due to the fact that the most intense storms accumulate energy and moisture over a longer period and then produce more
intense precipitation once released. Alternatively, AMP1 hr may
originate from organized convection that needs more time to develop than single cell convective storms. In other words, the longer the
moisture building content, the more intense the storm. As AMP1 hr
occur by definition once a year, they are not expected to contribute substantially to the diurnal distribution of the mean hourly precipi-tation intensity.
5) AMP1 hr are correlated to a certain extent to CAPE, confirming the
prevalence of convective processes in shorter-duration precipitation extremes. However, the response of precipitation intensity is not linear and levels off beyond a certain CAPE threshold. This result is however not unexpected given that precipitation intensity is a
function of both CAPE and the amount of moisture available (Lepore
et al., 2015, 2016; Dong et al., 2018). The CAPE-precipitation
in-tensity relationship saturates even more quickly for AMP24 hr, for
which atmospheric instability plays only a secondary role. These results have multiple implications. As reported in previous works, the intermittent nature of precipitation is masked out in daily data, especially in the less precipitation-prone regions. For instance (Pendergrass and Knutti (2018)), have recently shown that half of total annual precipitation falls in only a few days across many regions of the world. This unevenness is expected to be stronger in hourly data given that precipitation is intermittent from one day to another but also within a day. Sub-daily data also enables a better characterization of the true precipitation intensity as well as a better understanding of processes driving extremes. Given the growing interest in sub-daily precipitation extremes in the literature, the hourly precipitation dataset used here can provide the hydroclimate community with better information on in-tensities initiating flash floods.
It is of interest to note that the seasonality of daily precipitation
Fig. 15. Left) Mean AMP1 hr (gray, bottom axis) and count of recording sites (blue, top axis) as a function of the maximum CAPE level observed over a period
extending from 24 h prior to AMP1 hr. Top) Mean AMP1 hr (gray, left axis) and count of recording sites (blue, right axis) as a function of the mean duration (hours) of
storms initiating AMP1 hr. Middle) Bivariate analysis of the influence of CAPE (left axis) and the duration of storms initiating AMP1 hr (bottom axis) on mean
AMP1 hr (contour) and on the distribution of recording sites (shading). (For interpretation of the references to color in this figure legend, the reader is referred to the
extremes shown here contrasts somewhat with the seasonality of daily
flooding depicted in previous studies (Villarini, 2016), highlighting the
dominant role of antecedent conditions in triggering floods (Berghuijs
et al., 2016; Bennett et al., 2018). A comparison of short-duration pre-cipitation and flash-flood seasonality may also help to better elucidate different triggering mechanisms for regional flash flooding.
Results reported here may also be useful for climate model evalua-tion. For instance, the ability of models to reproduce the storm duration initiating the annual maxima or other features such as the switch in the seasonality of extremes across durations at a specific site could be evaluated. In this regard, the use of the Gini coefficient might be useful in model evaluations at it summarizes the temporal distribution of precipitation through a day or a year into one single value. The late- afternoon and night-time peak in the most extreme hourly extremes should be evaluated in climate models as well. This is of primary importance as most models generally fail to simulate the diurnal cycle of precipitation in regions where the phase of the observed diurnal cycle of precipitation does not coincide with the time of maximum surface
temperature (Mooney et al., 2017) although convection permitting
models (CPMs) have been found to simulate the diurnal cycle more
realistically (Kendon et al., 2012; Prein et al., 2015).
The main limitation of this study is the uneven distribution of rain gauges across space. All statistics are based on hourly data-covered re-gions and thus only reflect the sampled rere-gions. A quality control pro-cess of the GSDR dataset is currently underway in other regions and will soon provide a more complete coverage that could be used to more accurately quantify sub-daily precipitation features on a more global scale.
Finally, further studies are needed to detect the effects of global warming on short-duration precipitation extremes across the world.
Global trend detection studies have so far relied on daily data (Westra
et al., 2013; Donat et al., 2017; Sippel et al., 2017) but the aggregation of
precipitation across a day may affect the sign of the trend in extreme
precipitation (Zheng et al., 2015; Morbidelli et al., 2018). A recent study
suggests that changes in hourly extremes may emerge before daily
ex-tremes (Kendon et al., 2018). On the other hand, trends in sub-daily
extremes have only been examined in nation-wide studies (Barbero
et al., 2017; Guerreiro et al., 2018; Ali and Mishra, 2018) and a more global assessment is still lacking. The GSDR dataset provides for the first time the opportunity to examine these research questions across different climate zones with a consistent methodology and assess some of the World Climate Research Programme (WCRP) Grand Challenges on Weather and Climate Extremes.
Acknowledgments
This work was supported by the INTENSE project. INTENSE is sup-ported by the European Research Council (grant ERC-2013-CoG- 617329). Hayley Fowler is funded by the Wolfson Foundation and the Royal Society as a Royal Society Wolfson Research Merit Award holder (grant WM140025).
Appendix A. Supplementary data
Supplementary data to this article can be found online at https://doi.
org/10.1016/j.wace.2019.100219. References
Ali, H., Mishra, V., 2018. Contributions of dynamic and thermodynamic scaling in subdaily precipitation extremes in India. Geophys. Res. Lett. 45. https://doi.org/1 0.1002/2018GL077065.
Bao, J., Sherwood, S.C., Alexander, L.V., Evans, J.P., 2017. Future increases in extreme precipitation exceed observed scaling rates. Nat. Clim. Chang. 7, 128–132. https:// doi.org/10.1038/nclimate3201. http://www.nature.com/doifinder/10.1038/ncl imate3201.
Barbero, R., Abatzoglou, J.T., Fowler, H.J., 2018. Contribution of large-scale midlatitude disturbances to hourly precipitation extremes in the United States. Clim. Dyn. 0, 1–12. https://doi.org/10.1007/s00382-018-4123-5. http://link.springer.com/10. 1007/s00382-018-4123-5.
Barbero, R., Fowler, H., Lenderink, G., Blenkinsop, S., 2017. Is the intensification of precipitation extremes with global warming better detected at hourly than daily resolutions? Geophys. Res. Lett. 44 https://doi.org/10.1002/2016GL071917. Beck, H.E., Vergopolan, N., Pan, M., Levizzani, V., van Dijk, A.I.J.M., Weedon, G.,
Brocca, L., Pappenberger, F., Huffman, G.J., Wood, E.F., 2017. Global-scale evaluation of 23 precipitation datasets using gauge observations and hydrological modeling. In: Hydrology and Earth System Sciences Discussions, pp. 1–23. https:// doi.org/10.5194/hess-2017-508. https://www.hydrol-earth-syst-sci-discuss.net/h ess-2017-508/.
Benestad, R.E., Nychka, D., Mearns, L.O., 2012. Spatially and temporally consistent prediction of heavy precipitation from mean values. Nat. Clim. Chang. 2, 544–547.
https://doi.org/10.1038/nclimate1497. https://doi.org/10.1038/nclimate1497. Bennett, B., Leonard, M., Deng, Y., Westra, S., 2018. An empirical investigation into the
effect of antecedent precipitation on flood volume. J. Hydrol. 567, 435–445. https:// doi.org/10.1016/j.jhydrol.2018.10.025.
Beranova, R., Kysely, J., Hanel, M., 2017. Characteristics of sub-daily precipitation extremes in observed data and regional climate model simulations. Theor. Appl. Climatol. 1–13. https://doi.org/10.1007/s00704-017-2102-0.
Berg, P., Moseley, C., Haerter, J.O., 2013. Strong increase in convective precipitation in response to higher temperatures. Nat. Geosci. 6, 181–185. https://doi.org/10.1038/ ngeo1731. http://www.nature.com/doifinder/10.1038/ngeo1731.
Berghuijs, W.R., Woods, R.A., Hutton, C.J., Sivapalan, M., 2016. Dominant flood generating mechanisms across the United States. Geophys. Res. Lett. 43, 4382–4390.
https://doi.org/10.1002/2016GL068070. https://doi.org/10.1002/2016GL068070. Blenkinsop, S., Fowler, H.J., Barbero, R., Chan, S.C., Guerreiro, S.B., Kendon, E.,
Lenderink, G., Lewis, E., Li, X.F., Westra, S., Alexander, L., Allan, R.P., Berg, P., Dunn, R.J.H., Ekstrom, M., Evans, J.P., Holland, G., Jones, R., Kjellstrom, E., Klein- Tank, A., Lettenmaier, D., Mishra, V., Prein, A.F., Sheffield, J., Tye, M.R., 2018. The INTENSE project: using observations and models to understand the past, present and future of sub-daily rainfall extremes. Adv. Sci. Res. 15, 117–126. https://doi.org/ 10.5194/asr-15-117-2018.
Blenkinsop, S., Lewis, E., Chan, S.C., Fowler, H.J., 2017. Quality-control of an hourly rainfall dataset and climatology of extremes for the UK. Int. J. Climatol. 37, 722–740. https://doi.org/10.1002/joc.4735.
Boughton, W., Jakob, D., 2017. Adjustment factors for restricted rainfall. Aust. J. Water Resour. 12, 37–47. https://doi.org/10.1080/13241583.2008.11465332. Brooks, H.E., Stensrud, D.J., 2000. Climatology of heavy rain events in the United States
from hourly precipitation observations. Mon. Weather Rev. 128, 1194–1201.
https://doi.org/10.1175/1520-0493(2000)128<1194:COHREI>2.0.CO;2. Canel, L., Katz, J., 2018. Trends in U.S. Hourly precipitation variance 19492009.
J. Hydrometeorol. 19, 599608. https://doi.org/10.1175/JHM-D-17-0097.1. Cort◆es-Hern◆andez, V.E., Zheng, F., Evans, J., Lambert, M., Sharma, A., Westra, S., 2016.
Evaluating regional climate models for simulating sub-daily rainfall extremes. Clim. Dyn. 47, 1613–1628. https://doi.org/10.1007/s00382-015-2923-4.
Covey, C., Gleckler, P.J., Doutriaux, C., Williams, D.N., Dai, A., Fasullo, J., Trenberth, K., Berg, A., 2016. Metrics for the diurnal cycle of precipitation: toward routine benchmarks for climate models. J. Clim. 29, 4461–4471. https://doi.org/10.1175/ JCLI-D-15-0664.1.
Dai, A., 2001. Global precipitation and thunderstorm frequencies . Part II : diurnal variations. J. Clim. 1112–1128.
Dai, A., Trenberth, K.E., 2004. The diurnal cycle and its depiction in the community climate system model. J. Clim. 17, 930–951. https://doi.org/10.1175/1520-0442 (2004)017<0930:TDCAID>2.0.CO;2.
Darwish, M., Fowler, H.J., Blenkinsop, S., Tye, M.R., 2018. A regional frequency analysis of UK hourly and multi-hourly extreme precipitation. International Journal of Climatology In Press 1–19. https://doi.org/10.1002/joc.5694.
Davies, L., Jakob, C., May, P., Kumar, V.V., Xie, S., 2013. Relationships between the large-scale atmosphere and the small-scale convective state for Darwin, Australia. J. Geophysic. Res. Atmos. https://doi.org/10.1002/jgrd.50645.
Dee, D., Uppala, S., Simmons, a., Berrisford, P., Poli, P., Kobayashi, S., Andrae, U., Balmaseda, M., Balsamo, G., Bauer, P., 2011. The ERA - interim reanalysis: configuration and performance of the data assimilation system. Quaterly Journal of the Royal Meteorological Society. https://doi.org/10.1002/qj.828.
Donat, M.G., Lowry, A.L., Alexander, L.V., O’Gorman, P.A., Maher, N., 2017. Addendum: more extreme precipitation in the world’s dry and wet regions. Nat. Clim. Chang. 7, 154–158. https://doi.org/10.1038/nclimate3160. http://www.nature.com/doifind er/10.1038/nclimate3160.
Dong, W., Lin, Y., Wright, J.S., Xie, Y., Yin, X., Guo, J., 2018. Precipitable water and CAPE dependence of rainfall intensities in China. Clim. Dyn. 0, 0. https://doi.org/ 10.1007/s00382-018-4327-8. https://doi.org/10.1007/s00382-018-4327-8. Doswell, C.A., Brooks, H.E., Maddox, R.A., 1996. Flash flood forecasting: an ingredients-
based methodology. Weather Forecast. 11, 560–581. https://doi.org/10.1175/1520- 0434(1996)011<0560:FFFAIB>2.0.CO;2. http://journals.ametsoc.org/doi/abs/10 .1175/1520-0434%281996%29011%3C0560%3AFFFAIB%3E2.0.CO%3B2. Evans, J.P., Westra, S., 2012. Investigating the mechanisms of diurnal rainfall variability
using a regional climate model. J. Clim. 25, 7232–7247. https://doi.org/10.1175/ JCLI-D-11-00616.1.
Feng, Z., Dong, X., Xi, B., McFarlane, S.A., Kennedy, A., Lin, B., Minnis, P., 2012. Life cycle of midlatitude deep convective systems in a Lagrangian framework. J. Geophysic. Res. Atmos. 117, 1–14. https://doi.org/10.1029/2012JD018362.
Fosser, G., Khodayar, S., Berg, P., 2014. Benefit of convection permitting climate model simulations in the representation of convective precipitation. Clim. Dyn. 44, 45–60.
https://doi.org/10.1007/s00382-014-2242-1.
Garreaud, R.D., Wallace, J.M., 1997. The diurnal March of convective cloudiness over the americas. Mon. Weather Rev. 125, 3157–3171. https://doi.org/10.1175/1520- 0493(1997)125<3157:TDMOCC>2.0.CO;2.
Groisman, P.Y., Knight, R.W., Karl, T.R., 2012. Changes in intense precipitation over the Central United States. J. Hydrometeorol. 13, 47–66. https://doi.org/10.1175/JHM- D-11-039.1. http://journals.ametsoc.org/doi/abs/10.1175/JHM-D-11-039.1. Guerreiro, S.B., Fowler, H.J., Barbero, R., Westra, S., Lenderink, G., Blenkinsop, S.,
Lewis, E., Li, X.F., 2018. Detection of continental-scale intensification of hourly rainfall extremes. Nature Climate Change. https://doi.org/10.1038/s41558-018- 0245-3. http://www.nature.com/articles/s41558-018-0245-3.
Houze Jr., R.a., 2004. Mesoscale convective systems-review paper. Rev. Geophys. 42, 1–43. https://doi.org/10.1029/2004RG000150.1.INTRODUCTION. http://www. agu.org/pubs/crossref/2004/2004RG000150.shtml.
Hur, J., Raghavan, S.V., Nguyen, N.S., Liong, S.Y., 2016. Evaluation of high-resolution satellite rainfall data over Singapore. Procedia Engineering 154, 158–167. https:// doi.org/10.1016/j.proeng.2016.07.437. https://doi.org/10.1016/j.proeng.2016.0 7.437.
Ivancic, T.J., Shaw, S.B., 2016. A U.S.-based analysis of the ability of the Clausius- Clapeyron relationship to explain changes in extreme rainfall with changing temperature. J. Geophys. Res.: Atmosphere 121, 3066–3078. https://doi.org/ 10.1002/2015JD024288. https://doi.org/10.1002/2015JD024288.
Katz, R.W., Parlange, M.B., Naveau, P., 2002. Statistics of extremes in hydrology. Adv. Water Resour. https://doi.org/10.1016/S0309-1708(02)00056-8.
Kendon, E.J., Ban, N., Roberts, N.M., Fowler, H.J., Roberts, M.J., Chan, S.C., Evans, J.P., Fosser, G., Wilkinson, J.M., 2017. Do convection-permitting regional climate models improve projections of future precipitation change? Bull. Am. Meteorol. Soc. https:// doi.org/10.1175/BAMS-D-15-0004.1.
Kendon, E.J., Blenkinsop, S., Fowler, H.J., 2018. When will we detect changes in short- duration precipitation extremes? J. Clim. https://doi.org/10.1175/JCLI-D-17- 0435.1.
Kendon, E.J., Roberts, N.M., Senior, C.A., Roberts, M.J., 2012. Realism of rainfall in a very high-resolution regional climate model. J. Clim. 25, 5791–5806. https://doi. org/10.1175/JCLI-D-11-00562.1.
Kikuchi, K., Wang, B., 2008. Diurnal precipitation regimes in the global tropics. J. Clim. 21, 2680–2696. https://doi.org/10.1175/2007JCLI2051.1.
Laing, A.G., Fritsch, J.M., 1997. The global population of mesoscale convective complexes. Q. J. R. Meteorol. Soc. 123, 389–405. https://doi.org/10.1256/ smsqj.53806.
Lamjiri, M.A., Dettinger, M.D., Ralph, F.M., Guan, B., 2017. Hourly storm characteristics along the U.S. West Coast: role of atmospheric rivers in extreme precipitation. Geophys. Res. Lett. 44, 7020–7028. https://doi.org/10.1002/2017GL074193.
https://doi.org/10.1002/2017GL074193.
Lenderink, G., Barbero, R., Loriaux, J., Fowler, H., 2017. Super-Clausius-Clapeyron scaling of extreme hourly convective precipitation and its relation to large-scale atmospheric conditions. J. Clim. 30 https://doi.org/10.1175/JCLI-D-16-0808.1. Lenderink, G., van Meijgaard, E., 2008. Increase in hourly precipitation extremes beyond
expectations from temperaturechanges. Nat. Geosci. 1, 511–514. https://doi.org/ 10.1038/ngeo262. http://www.nature.com/doifinder/10.1038/ngeo262. Lepore, C., Allen, J.T., Tippett, M.K., 2016. Relationships between hourly rainfall
intensity and atmospheric variables over the contiguous United States. J. Clim.
https://doi.org/10.1175/JCLI-D-15-0331.1.
Lepore, C., Veneziano, D., Molini, A., 2015. Temperature and CAPE dependence of rainfall extremes in the eastern United States. Geophys. Res. Lett. 42, 74–83. https:// doi.org/10.1002/2014GL062247.
Lewis, E., Fowler, H.J., Alexander, L., Dunn, R., McClean, F., Barbero, R., Guerreiro, S., Li, X.F., Blenkinsop, S., 2019. GSDR: a global sub-daily rainfall dataset. J. Clim. 32, 47154729. https://doi.org/10.1175/JCLI-D-18-0143.1.
Li, J., 2017. Hourly station-based precipitation characteristics over the Tibetan Plateau. Int. J. Climatol. https://doi.org/10.1002/joc.5281. https://doi.org/10.1002/201 7GL074193.
Lochbihler, K., Lenderink, G., Siebesma, A.P., 2017. The spatial extent of rainfall events and its relation to precipitation scaling. Geophys. Res. Lett. https://doi.org/ 10.1002/2017GL074857. https://doi.org/10.1002/2017GL074857.
Loriaux, J.M., Lenderink, G., Pier Siebesma, A., 2017. Large-scale controls on extreme precipitation. J. Clim. 30, 955–968. https://doi.org/10.1175/JCLI-D-16-0381.1. Luo, Y., Wu, M., Ren, F., Li, J., Wong, W.K., 2016. Synoptic situations of extreme hourly
precipitation over China. J. Clim. 29, 8703–8719. https://doi.org/10.1175/JCLI-D- 16-0057.1.
Masaki, Y., Hanasaki, N., Takahashi, K., Hijioka, Y., 2014. Global-scale analysis on future changes in flow regimes using Gini and Lorenz asymmetry coefficients. Water Resour. Res. https://doi.org/10.1002/2013WR014266.
McCorkle, T.A., Williams, S.S., Pfeiffer, T.A., Basara, J.B., 2016. Atmospheric contributors to heavy rainfall events in the Arkansas-red river basin. Advances in Meteorology. https://doi.org/10.1155/2016/4597912.
Mooney, P.A., Broderick, C., Bruy✓ere, C.L., Mulligan, F.J., Prein, A.F., 2017. Clustering of observed diurnal cycles of precipitation over the United States for evaluation of a WRF multiphysics regional climate ensemble. J. Clim. 30, 9267–9286. https://doi. org/10.1175/JCLI-D-16-0851.1.
Morbidelli, R., Saltalippi, C., Flammini, A., Cifrodelli, M., Picciafuoco, T., Corradini, C., Casas-Castillo, M.C., Fowler, H.J., Wilkinson, S.M., 2017. Effect of temporal aggregation on the estimate of annual maximum rainfall depths for the design of hydraulic infrastructure systems. J. Hydrol. 554, 710–720. https://doi.org/10.1016/ j.jhydrol.2017.09.050. https://doi.org/10.1016/j.jhydrol.2017.09.050.