HAL Id: hal-03019778
https://hal.archives-ouvertes.fr/hal-03019778
Submitted on 23 Nov 2020
HAL is a multi-disciplinary open access
archive for the deposit and dissemination of
sci-entific research documents, whether they are
pub-lished or not. The documents may come from
teaching and research institutions in France or
abroad, or from public or private research centers.
L’archive ouverte pluridisciplinaire HAL, est
destinée au dépôt et à la diffusion de documents
scientifiques de niveau recherche, publiés ou non,
émanant des établissements d’enseignement et de
recherche français ou étrangers, des laboratoires
publics ou privés.
Do future climate conditions change volatile organic
compound emissions from Artemisia annua? Elevated
CO 2 and temperature modulate actual VOC emission
rate but not its emission capacity
Juliane Daussy, Michael Staudt
To cite this version:
Juliane Daussy, Michael Staudt. Do future climate conditions change volatile organic compound
emissions from Artemisia annua? Elevated CO 2 and temperature modulate actual VOC emission
rate but not its emission capacity.
Atmospheric environment: X, Elsevier, 2020, 7, pp.100082.
ATMOSPHERIC ENVIRONMENT: X 7 (2020) 100082
Available online 2 June 2020
2590-1621/© 2020 The Authors. Published by Elsevier Ltd. This is an open access article under the CC BY-NC-ND license
(http://creativecommons.org/licenses/by-nc-nd/4.0/).
Do future climate conditions change volatile organic compound emissions
from Artemisia annua? Elevated CO
2
and temperature modulate actual VOC
emission rate but not its emission capacity
Juliane Daussy, Michael Staudt
*Centre d’Ecologie Fonctionnelle et Evolutive, CNRS, Univ Montpellier, Univ Paul Val�ery Montpellier 3, EPHE, IRD, 1919 Route de Mende, 34293, Montpellier, France
A R T I C L E I N F O
Keywords: Climate change Elevated CO2
Elevated temperature Volatile organic compound Sweet wormwood Isoprenoids
A B S T R A C T
Increasing temperature and atmospheric [CO2] can change plant VOC emissions, thereby providing a possible
feedback to climate change by altering particle and greenhouse gas formation. While evidence gathered on isoprene emission generally indicated an inhibitory effect of elevated CO2 on emission at moderate temperature,
it is unclear whether the emissions of other volatiles respond in a similar way. In a greenhouse study, we grew
Artemisia annua plants under two [CO2] regimes (400/800 ppm) combined with two temperature regimes (25/15
and 30/20 �C) and determined emissions at two assay [CO
2] (400/800 ppm) combined with two assay
tem-peratures (30/37 �C). Foliar VOC concentrations were unaffected by growth conditions and resembled emissions
consisting mainly of monoterpenes (>92%) and sesquiterpenes (>7%). Mean emission rates determined at 30 �C
and 400 ppm [CO2] ranged between 1.2 and 2.5 μg g 1h 1 (11–26 ng m 2s 1) with lowest values observed for
elevated-[CO2]-grown plants. However, this apparent negative effect of growth [CO2] was compensated by
increased plant growth. Irrespective of growth conditions, doubling assay [CO2] significantly reduced emissions
at 37 �C by about 30% and had no effect at 30 �C. Emissions always increased on the increase in assay
tem-perature, with monoterpenes responding more strongly than sesquiterpenes (mean %-increase of 17.5 and 12.5
�C-1). Our results suggest that the future evolution of VOC release from A. annua depends mainly on the
antagonistic emission responses to temperature and [CO2], while long-term acclimations play a minor role.
1. Introduction
Terrestrial vegetation releases into the atmosphere a large variety of organic molecules commonly called Biogenic Volatile Organic Com-pounds (BVOC). BVOCs differ in size and physicochemical properties but have all in common a relative high vapor pressure at ambient tem-perature and a low boiling temtem-perature (Kesselmeier and Staudt, 1999). Hence all BVOCs potentially evaporate out of the plant tissues and spread in the surrounding environment, where they may encounter other organisms. Many BVOCs are known to mediate interactions be-tween plants and other organisms: they are involved in plant repro-duction by attracting pollinators (Wright and Schiestl, 2009), have defense functions against pathogens and herbivores directly through their antimicrobial and repellent properties (Dudareva et al., 2013) or indirectly by attracting enemies of herbivores (Heil, 2008). Further-more, certain compounds may confer protection against abiotic stresses and/or serve as “airborne phytohormones” signaling stress between the
organs of a same plant, and between plants of a same or different species (Kessler et al., 2006).
However, once in the atmosphere BVOCs become part of the chem-ical processes that regulate several radiative forcing components and hence the earth’s climate. Notably, they alter greenhouse gas concen-trations by influencing the formation of ozone and the lifetime of methane in the troposphere and modify the optical properties of the atmosphere by favoring the formation and growth of secondary organic aerosols and cloud condensation nuclei (Sartelet et al., 2012; Ziemann and Atkinson, 2012). In particular larger molecules such as mono-terpenes (C10) and sesquimono-terpenes (C15) are efficient precursors for aerosol formation over rural, forested areas, while smaller BVOCs such as isoprene (C5) - which is globally the most emitted BVOC - has rather a modest productivity of particles (Jokinen et al., 2015; Zhang et al., 2018; McFiggans et al., 2019). The emissions of these terpenes are therefore potential actors to be considered in global climate change research, because climate change factors may affect their fluxes, which
* Corresponding author.
E-mail address: michael.staudt@cefe.cnrs.fr (M. Staudt).
Contents lists available at ScienceDirect
Atmospheric Environment: X
journal homepage: http://www.journals.elsevier.com/atmospheric-environment-x
https://doi.org/10.1016/j.aeaoa.2020.100082
in turn could feedback on climate evolution (e.g. Harper and Unger, 2018; Sporre et al., 2019).
Global climate change is characterized by an increase in mean tem-perature and the concentrations of greenhouse gases such as carbon dioxide, methane and ozone but also by the increase in the frequency and intensity of precipitation, drought and extreme weather events in general. Temperature and CO2 concentration have been continuously
rising since the end of the 19th century. Climate models predict that mean global surface temperature further rises up to 2–6 �C and mean
global [CO2] to 800 ppm by 2100 with no or relative moderate regional
differences compared to other climate factors such as precipitation (Pachauri et al., 2014). Therefore and because both factors are key drivers of the plant’s metabolism, rising temperature and [CO2] may
substantially change the BVOC fluxes from all vegetation cover over the world (Kulmala et al., 2004; Pe~nuelas and Staudt, 2010). However, es-timates of BVOC fluxes at large scales and how they evolve in a warmer CO2-enriched world are associated with large uncertainties (Jiang et al.,
2019).
Studies that investigate and model the influence of environmental factors on isoprenoid emissions typically dissociate between short-term and long-term effects (Grote and Niinemets., 2008; Niinemets et al., 2010; Guenther et al., 2012; Monson et al., 2012). Short-term effects imply fast changes of emission in response to changes of environmental drivers that come rapidly to a new steady state, usually within tenths of minutes (e.g. Monson et al., 1991; Staudt et al., 2003). By contrast long-term acclimation effects describe slow changes in the steady state emission rate at standard environmental conditions (30 �C temperature,
1000 μmol m 2 s 1 incident photosynthetic photon flux density and 400
ppm atmospheric [CO2]) also called basal emission rate or emission
capacity. Long-term changes typically proceed over hours, days or months and may involve gene activation, metabolic adjustments, phenological changes and leaf anatomical acclimations (Harrison et al., 2013; Staudt et al., 2017a). So far, the effects of temperature are better known and described than CO2 effects, and in both, the short-term
in-fluences better than their longer-term inin-fluences on emissions (for overview see Pe~nuelas and Staudt, 2010; Holopainen et al., 2018; Feng et al., 2019). Furthermore, the emissions of isoprene has been widely studied by the scientific community and its response to environmental factors is relatively well simulated, while there is more variability and uncertainty in the emission responses of higher isoprenoids. The foliar emission rate of isoprene is closely related to its biosynthesis rate, because in isoprene producing tissues the pool sizes of isoprene and its direct precursors are small and sustain emission only few minutes (Sharkey et al., 2007). Its emission is regulated on the short-term by both light and temperature (Grote and Niinemets, 2008; Harrison et al., 2013). Isoprene emission increases in response to temperature expo-nentially to an optimum around 40 �C, above which the emission
de-creases. In response to light, isoprene emission increases in a hyperbola shape similar to that of photosynthesis. As regards the short-term CO2
effect, many studies revealed that isoprene emission decreases with increasing [CO2] (Sharkey and Monson, 2014; Monson et al., 2016;
Rasulov et al., 2018; Lantz et al., 2019 and references therein). The re-ported degrees of isoprene inhibition at elevated [CO2] depended on the
applied CO2 levels (e.g. Monson and Fall, 1989), but also on the actual
leaf temperature (e.g. Loreto and Sharkey, 1990). Generally, the short-term inhibitory effect of high CO2 on isoprene emission becomes
reduced with increasing temperature and is completely offset at tem-peratures around 35 �C or higher. The CO
2 responsiveness of isoprene
emissions can also vary among plant species and be modulated by the plant’s growth conditions (e.g. Sharkey et al., 1991; Wilkinson et al., 2009).
Monoterpenes and sesquiterpenes are typically emitted by plants that store these BVOCs inside specialized secretory organs like resin ducts, glandular trichomes or oil cavities, where they are synthesized and accumulated during the leaf development (Turner et al., 2000;
Franceschi et al., 2005; Tissier et al., 2017). Buffered by large storage
pools, the release of terpenes from these organs is uncoupled from biosynthesis. It is essentially driven by the vapor pressure and the re-sistances along the diffusion paths (Staudt et al., 2017b). The emissions are not light dependent and the temperature response has no apparent temperature optimum. Emissions increase exponentially with tempera-ture, where the slope of the log-linear relationship (β-value) is used to describe and model the emission responsiveness to temperature (Guenther et al., 2012). However, numerous studies have been ques-tioned this paradigm by showing that terpene storing species also emit de-novo-synthesized terpenes that can be the same or different isomers with respect to their storage-derived emissions (e.g. Ghirardo et al., 2010; Staudt et al., 2019; Huang et al., 2018). It is therefore possible that a fraction of their emissions are also inhibited by elevated CO2 and show
a response pattern similar to that of isoprene as indicated by studies conducted on non-storing monoterpene emitters (e.g., Loreto et al., 1996; Rapparini et al., 2004). To our knowledge only seven studies have investigated the effects of elevated CO2 (alone or along with other
fac-tors) on constitutive terpene emissions from ten terpene storing plants, nine of which were diverse coniferous species and one the aromatic shrub rosemary. Of the ten investigated species, two showed decreased emissions (Taxodium distichum (Llorens et al., 2009), hybrid larch (Mochizuki et al., 2017)), two increased emissions (Metasequoia
glyp-tostroboides (Llorens et al., 2009), Cryptomeria japonica (Mochizuki et al., 2018)), and five unchanged emissions of terpenes in response to elevated CO2 (Pinus radiata (Juuti et al., 1990), Rosemary (Pe~nuelas and
Llusi�a, 1997), Pinus ponderosa and Pseudotsuga menziesii (Constable et al., 1999), Pinus sylvestris (R€ais€anen et al., 2008; Llorens et al., 2009)). The experiments of Constable et al. (1999) and R€ais€anen et al. (2008)
combined growth CO2 treatments with two growth temperature
treat-ments, but only in the latter study emissions were reported for all treatments. Based on temperature normalized emission rates, R€ais€anen et al. (2008) observed significantly increased terpene emissions from Scots pine grown under both elevated CO2 and elevated temperature,
whereas growth under elevated CO2 alone had no significant effect, and
growth under elevated temperature alone significantly decreased the emission rate. However, neither this work on Scots pine nor any other above cited studies on terpene emissions, dissociated experimentally long-term acclimation effects of growth under elevated CO2 from the fast
responses of emissions to CO2, and its possible modulation by
temper-ature as evidenced for isoprene emission. Thus according to our litera-ture survey, much more experimental work on terpene storing plants is needed to understand and predict how their BVOC emissions respond to future climate conditions.
In order to contribute filling this gap, we designed an experiment, in which we grew Sweet wormwood plants (Artemisia annua L., Asteraceae) under two CO2 regimes combined with two temperature regimes and
determined emissions at two assay [CO2] (400 and 800 ppm) combined
with two assay temperatures (30 and 37 �C). More specifically, we
addressed the following questions:
- Which VOCs are released at what rates from A. annua foliage under environmentally controlled conditions and how do emissions compare with the foliar VOC concentrations?
- Does the actual emission rate of BVOCs respond to changes in assay CO2 and if so does the CO2 responsiveness depend on the actual assay
temperature ?
- Does growth under warmer and/or CO2 enriched atmospheres
modulate the fast emission responses to CO2?
- Do growth conditions affect the overall VOC emission capacity and/ or foliar VOC concentrations?
We chose A. annua in the present study, because it is a widely distributed, strongly aromatic herb. Native to Asia, it was naturalized throughout the world and is cropped in many countries under warm temperate climates. In fact, A. annua is the only source of artemisinin, a non-volatile endoperoxide sesquiterpene lactone, identified as the
compound active against protozoan parasites of the genus Plasmodium responsible for malaria (Gershenzon and Dudareva, 2007; Xiao et al., 2016). A. annua culture involves environmental risks due to the toxicity of artemisinin leached in soil and groundwater (Herrmann et al., 2013).
A. annua is also considered as an invasive weed species, whose
distri-bution has continuously expanded in Europe, and is expected to further increase with global climate warming (Follak et al., 2013). Its essential oil, which is also used in perfumery and cosmetics, is produced and stored in peltate glandular trichomes and contains mainly monoterpenes and sesquiterpenes (Woerdenbag et al., 1993; Tissier et al., 2017; Des-rosiers et al., 2019).
2. Material and methods
2.1. Plant material and long-term treatments
A. annua seeds were obtained from the supplier ChilternSeeds (UK).
They were grown from end of April to beginning August 2018 in four identical glasshouse compartments at the Center for Functional and Evolutionary Ecology under two temperature regimes combined with two CO2 regimes: normal temperature and ambient CO2 (25/15 �C day/
night temperature and 400 ppm CO2 concentration, referred to hereafter
as: “Ambient”), elevated temperature and ambient CO2 (30/20 �C, 400
ppm [CO2], “þT”), normal temperature and elevated CO2 (25/15 �C,
800 ppm [CO2], “þCO2”), and both elevated temperature and CO2 (30/
20 �C, 800 ppm [CO
2], “þT þ CO2”). Plants were repeatedly sown
during the period in order to have tests plants of similar size and development stage at any time of the experiment. For sowing, seeds were mixed with fine sand and then scattered on the surface of a mixture of compost and sand. Individual, well developed seedlings were trans-planted into homemade cylindrical pots (2.8 L volume, 15 cm diameter, 16 cm height) containing the same substrate mixture used previously. The pots were inside lined with a Teflon sheet (FEP, 50 μm thickness),
which at the upper open pot side was double folded over the border and
fixed with a silicon sealing ring taking care to let about 10 cm of Teflon sheet extending beyond the pot border.
2.2. Plant exposure system
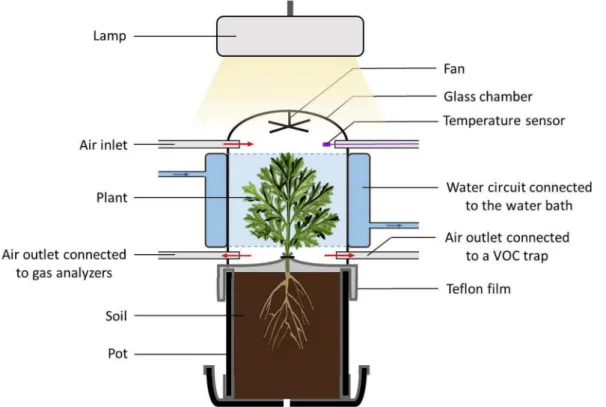
Volatile emissions were determined by dynamic headspace tech-nique using a system allowing to study VOC emissions from the whole foliage of small plants under environmentally controlled conditions. The system was composed of two double walled glass chambers settled side by side, closed on top by a removable glass lid and open underside to enable the installation of the potted plants (Fig. 1). The inner headspace volume of the chambers was about 5 L. Homogenous mixing of the air in the chambers was maintained by small Teflon fans fixed at the chamber lids (motor outside). Temperature control of the chambers was carried out by circulating water from a water-bath around the double walled chamber section. A programmable temperature controller regulated constantly the temperature of the water bath to achieve the target air temperature measured by a thermocouple inside the chamber head-space. Additional thermocouples (Chrom-Constantan, OMEGA) were inserted to survey the chamber air temperatures. Photosynthetic Photon Flux Density (PPFD) was monitored with two quantum sensors (LI-COR, PAR-SB 190, Lincoln, NE, USA) located outside the chambers at middle height of the plants. A programmable LED lamp (LX60 Heliospectra AB, G€oteburg, Sweden) illuminated the chambers with a PPFD of approx. 600 μmol m 2 s 1. Temperature and PPFD values were recorded by a
data logger (21x; Campbell Scientific Ltd., Shepsherd, UK).
The chambers were continuously flushed with charcoal filtered ambient air via PFA tubing at constant rates regulated by mass flow controllers (Mass Stream, M þ W Instruments GmbH, Leonhardsbuch, Germany). Pure CO2 was injected from a 5 L tank via high precision mass
flow regulators (El-Flow Select, Bronkhorst France S.A.S., Montigny-les- Cormeilles, France) to achieve the warranted CO2 concentrations inside
the chambers. CO2 concentrations were manually adjusted before and
during the acclimation phases of the plants to assay conditions and
Fig. 1. Enclosure system used for the measurement of VOC emissions from the entire foliage of Artemisia annua plants. The red arrows indicate the direction of the
airflow. The double walled middle section of the chamber with the temperature-regulated water circuit is shown in blue. (For interpretation of the references to colour in this figure legend, the reader is referred to the Web version of this article.)
generally changed little once photosynthesis had reached steady state. The CO2 concentrations of the air entering and leaving the chambers
were continuously measured and recorded by infrared gas analyzers (LI- COR 840 combined with LI-COR 7000, LI-COR Inc., Lincoln, Nebraska, USA).
2.3. VOC sampling and measurement protocol
Prior installation of the plants inside the chambers, the Teflon sheet protruding the upper pot border was gently wrapped around the stem basis and loosely sealed with a Teflon tape to separate the soil with the root system from the above ground organs (Fig. 1). The glass chambers having the same diameter as the pots were then carefully placed on the pots with plants and sealed outside with a sealing ring to improve the air tightness of the system. The plants were mounted in the experimental device the night before the experiment started (on average 17 h) and flushed with charcoal filtered ambient air at a high rate (~3 L min 1) to
remove any residuals of VOC bursts that potentially occurred during plant installation (Niinemets et al., 2011). Indeed, preliminary tests showed that even tiny movements of the leaves caused for example by switching on the enclosure fan triggered temporary emission increases that were still detectable after 1 h.
The measurements were started in the next morning around 9 a.m. To measure VOC emissions, the chamber flow rate was reduced to 1 L min 1 (chamber flushing half-time ca. 3.4 min) and CO2 concentration
and air temperature were set to one of the following four assay condi-tions: Standard temperature and normal CO2 (30 �C, 400 ppm [CO2],
referred to hereafter as: “30 � 400”), high temperature and normal CO2
(37 �C, 400 ppm [CO
2], “37 � 400”), standard temperature and high
CO2 (30 �C, 800 ppm [CO2], “30 � 800”), and both high temperature
and high CO2 (37 �C, 800 ppm [CO2], “37 � 800”). These assay
tem-peratures were chosen to detect the possible interaction of temperature on CO2 responsiveness as shown for isoprene emissions. At 37 �C, which
lies in the range of temperatures optimal for VOC emissions and supra- optimal for net-photosynthesis, the inhibitory effect of high CO2 on
emissions typically disappears (Sharkey and Monson, 2014; and other references cited above). Furthermore, 30 �C is the standard temperature
commonly applied to determine the plant’s emission capacity for emission modelling (Guenther et al., 2012). VOC emissions of each replicate plant were subsequently measured at the four assay conditions, whereby the order of the assay conditions was randomly reversed to avoid a potential bias associated with potential intrinsic diel variation in emissions. Before VOC sampling plants were maintained at target assay conditions for at least 30 min after photosynthesis had reached a new steady-state. After the last measurement around 3 p.m., plants were removed and the foliage was harvested for the determination of surface area and dry weight and the extraction of stored VOCs. On the whole, six replicate plants per growth treatment were measured at the 4 assay conditions, whereby the order of growth treatments was randomly changed throughout the duration of the experiment.
VOCs in the chamber air were trapped on adsorbent cartridges (stainless steel, Perkin Elmer, Villebon, France) packed with two ab-sorption polymers (Tenax TA and Carbotrap). 2 L of air from the chambers with or without plants (i.e., background measurement) was drawn through the tubes at 0.2 L min 1 by mean of pumps and mass flow
regulators. Background measurements were made approx. 50 min after plants were removed from the chambers while continuously flushed with clean air at the same rate. To close the open bottom of the cham-bers, two pots filled with substrate and lined with Teflon sheets (iden-tical to the pots with plants) were fitted under the chambers. Additional empty chamber measurements were made at extra days without any plant measurements to check temporal variations of background con-centrations and memory effects in the device.
2.4. Solvent extraction of stored VOCs
After VOC emission measurements, five leaflets of the plant were cut, rapidly weighed on a microbalance (on average 0,52 g) and plunged into 10 mL of dichloromethane. The extraction tube was placed for 10 min in an ultrasonic bath, then vortexed for 1 min and left for 1 h at room temperature. After maceration, the plant material was removed. An in-ternal standard of 4 mL biphenyl (0.1 mg mL-1) was added to the extract before concentration to a volume of 225 μL in a moderate nitrogen flow.
The concentrated sample was stored at 20 �C until analysis.
2.5. VOC analysis
All VOC analysis were carried out at the Ecological Chemical Anal-ysis Platform of the CEFE institute. Volatiles trapped on adsorption cartridges were analyzed by GC-MS using an automatic thermal desorption system (TD-20, Shimadzu France, Marne-la-Vall�ee, France) coupled to a Shimadzu GC-MS QP2010 Plus equipped with a DB5 col-umn (30 m � 0.25 mm i.d., 0.25 μm film thickness). Trapped VOCs were
thermally desorbed and injected in splitless mode into the column after pre-concentration in a cold trap with the following temperature pro-gram: desorption 15 min at 230 �C, preconcentration at 30 �C on a
Tenax TA cold trap, injection 5 min at 230 �C, transfer-line 200 �C. The
GC oven program was: 2 min at 40 �C, 5 �C min 1 to 200 �C, 10 �C min 1
to 270 �C held for 6 min. Leaf extracts were analyzed by a second
Shi-madzu GC-MS QP2010 Plus instrument equipped with the same DB5 column. An aliquot of 1 μL of the concentrated leaf extracts was injected
with a split ratio of 4. The GC oven temperature program was: 40 �C for
1 min, 3.2 �C min 1 to 100 �C, 2.90 �C min 1 to 170 �C, 10 �C min 1 to
250 �C held for 6 min. Both GC-MS used helium as carrier gas at a
constant flow of 1 mL min-1. The MS ion sources were operated at 70 eV and 200 �C.
GC-MS data were processed using the GC-MS Solution package, Version 4.11 (Shimadzu Corporation 2013). Identification of the com-pounds was realized by comparing mass spectra and retention indices with those of authentic VOC standards, databases (Wiley 9, Nist 11, Adams) and alkane standards. For quantification, we used standard so-lutions of (Z)-3-hexenylacetate, linalool, methyl salicylate and β-car-yophyllene in three different concentrations (approximately 100, 10 and 1 ng μl 1 each compound), which were prepared from authentic pure
standards (Fluka, Sigma) using methanol as solvent. Each substance represents a class of VOCs typically found in A. annua. Multipoint cali-brations for all standards revealed a good linear dependency of peak area to the respective compound concentration. For each standard VOC, the slope of the linear relationship was used as calibration factor (peak area ng 1) for all molecules of the same VOC class (i.e. LOX,
mono-terpenes, phenolic compounds, sesquiterpenes). On average, the cali-bration factors of the four selected standard VOCs diverged by 30% with the lowest sensibility observed for methyl salicylate and the highest for β-caryophyllene.
2.6. Calculations and statistics
The emission rate of a given VOC was calculated as the difference between the VOC concentration in the chamber with plant and the concentration in the empty chamber (zero in many cases), multiplied by the chamber air flow rate and divided by either the dry weight or the projected leaf area of the enclosed foliage. VOC amounts in the leaf extracts were calculated from the amount of internal standard weighed for differences in the calibration factors of the VOC classes. Foliar VOC concentrations were expressed per leaf dry weight, which was estimated from the fresh weight of the measured leaflets and the ratio of fresh weight to dry weight determined on adjacent leaflets. Fresh and dry weights (24 h at 60 �C) were measured on a microbalance (Mettler,
model AE 100) and leaf area from scans using the Image J software. It should be noted that losses of stored VOCs occurring during foliage
harvest, leaf area determination and oven drying have likely lead to a slight underestimation of the foliage dry weight (<1%, cf. Table 1, see also Portillo-Estrada et al. (2015) on this issue).
The photosynthesis rate A was calculated according to Von Caem-merer and Farquhar, 1981 (equation (1)):
A ¼ue s� � ce co� � 1 we � 10 3 1 wo � 10 3 �� ; μmol m 2s 1� (1)
where ue, the molar flows of air entering the glass chambers (mol s-1), s is
the leaf area (m2), ce/co the mole fractions of CO2 entering/leaving the
glass chambers (μmol mol-1), and we/wo the mole fraction of water
vapor entering/leaving the glass chambers (mmol mol-1). It should be
noted that water condensation occasionally occurred at high assay temperature in the chamber outlet and tubing. Therefore, transpiration and stomatal conductance data were not considered in this study. The underestimation of wo due to water condensation causes however only
small errors in the calculation of the photosynthesis rates (relative error
<5%).
Statistical analyses were performed using R Software (version 3.5.2.). Variables were log transformed after testing the normality and homoscedasticity of residuals. Differences were considered as significant at a probability level of P<0.05 and as marginally significant at a probability level of P<0.1. For VOC emission and photosynthesis data, no interactions between the effects of assay conditions and growth conditions were found (Linear mixed model fit by REML with log- transformed values: F ¼ 0.842; degrees of freedom (df) ¼ 9; P ¼ 0.58 and F ¼ 0.916; df ¼ 9; P ¼ 0.52). The effects of assay and growth treatments were therefore treated independently in our study. The effect of assay treatments on VOC emission (total and single compound clas-ses) and photosynthesis rate were tested with a linear mixed model with
repetition as a random effect and growth condition as a fixed effect. Differences between assay treatments were tested with post-hoc t-tests using Satterthwaite’s method and the rates of increase and decrease in emissions were compared using paired Wilcox test. The effect of growth conditions on VOC emission (total and single compound classes) and photosynthesis rate measured at standard conditions was tested with a one-way Anova followed by a Tukey post-hoc test, and further on the pooled emission or photosynthesis data measured at the four different assay conditions with a linear mixed model with repetition as a random effect and assay conditions as a fixed effect. The effect of growth con-ditions on foliar VOC concentration, leaf dry mass per projected leaf area (LMA), leaf water content and plant biomass was tested with a one-way Anova, followed by a Tukey post-hoc test.
3. Results
3.1. Volatiles stored and emitted by A. annua
Overall, 29 compounds were found in A. annua leaf extracts and 23 in the emissions, of which 21 were common (Fig. 2, Table 1, see also supplementary data Table S1). The great majority of VOCs were iso-prenoids, mostly non-oxygenated and oxygenated monoterpenes (MTs) and non-oxygenated sesquiterpenes (SQs). In addition, one alkene and several non-identified compounds could be detected. Artemisia ketone was by far the most emitted compound accounting for about the half of the total VOC release (42.5–52.3%). The second major emitted VOCs were α-pinene (4.0–14.9%) and 1.8-cineole (8.3–12.1%) followed by
camphor (5.0–8.2%), β-pinene (2.6–5.2%), artemisia alcohol (2.3–4.8%) and the SQ (E)-β-caryophyllene (3.6–5.2%).
The other compounds found in the emissions represented less than
Table 1
Mean � SEM (n ¼ 6) VOC emission rates and foliar VOC concentrations of Artemisia annua plants grown under four temperature and CO2 regimes: Ambient: 25 �C and
400 ppm, þT: 30 �C and 400 ppm, þCO
2: 25 �C and 800 ppm, þT þ CO2: 30 �C and 800 ppm. All emissions were determined at standard assay conditions (30 �C and
400 ppm [CO2]). Emissions and contents are expressed per g foliage dry weight. Tr: Trace amounts (<0.01 μg g 1 h 1); -: not detected in the samples; NI: Non-
Identified peak with retention time; oxMT: oxygenated MT; MTs, SQs, Other semi-volatiles: Sum of monoterpenes, sesquiterpenes and other non-emitted, non- identified compounds; *: tentative identification (for more details see Supplementary Table S1).
VOC Ambient þT þCO2 þT þ CO2
Emission Content Emission Content Emission Content Emission Content
[μg g1 h 1] [μg g1] [μg g1 h 1] [μg g1] [μg g1 h 1] [μg g 1] [μg g 1 h 1] [μg g1] α-Pinene 0.13 � 0.07 17.82 � 10.2 0.20 � 0.07 26.95 � 6.14 0.16 � 0.02 29.42 � 3.75 0.41 � 0.13 31.24 � 9.2 Camphene 0.03 � 0.01 5.83 � 1.74 0.02 � 0.01 3.91 � 1.29 0.02 � 0.01 4.26 � 0.89 0.06 � 0.02 4.15 � 1.16 β-Pinene 0.06 � 0.02 10.87 � 3.68 0.03 � 0.01 4.05 � 0.62 0.06 � 0.02 6.84 � 1.77 0.10 � 0.04 4.41 � 1.15 1,8-Cineole 0.26 � 0.06 17.68 � 5.06 0.17 � 0.04 13.36 � 5.06 0.11 � 0.04 11.78 � 5.32 0.20 � 0.09 5.94 � 2.73 Artemisia ketone 1.32 � 0.39 100.03 � 22.04 0.58 � 0.12 55.71 � 19.88 0.62 � 0.07 50.36 � 8.95 0.99 � 0.25 59.64 � 7.07 Sabinene hydrate 0.02 � 0.01 1.39 � 0.57 tr 1.93 � 0.70 tr 1.79� 0.47 0.01 � 0.01 1.96 � 0.43 Artemisia alcohol 0.08 � 0.02 11.1 � 3.23 0.03 � 0.01 8.00 � 2.64 0.03 � 0.01 6.84 � 1.51 0.10 � 0.03 9.05 � 1.95 (E)-Pinocarveol 0.02 � 0.01 2.26 � 1.49 0.01 � 0.01 4.39 � 1.6 0.01 � 0.004 3.82 � 0.43 0.02 � 0.01 4.93 � 1.32 Camphor 0.17 � 0.05 26.06 � 9.35 0.08 � 0.04 20.18� 6.54 0.06 � 0.02 16.9 � 4.1 0.27 � 0.17 20.94 � 7.18 (Z)-Verbenol* – 1.04 � 0.34 – 1.24 � 0.29 – 0.94 � 0.16 – 0.93 � 0.14 Pinocarvone 0.01 � 0.01 3.72 � 2.35 0.02 � 0.01 6.26 � 2.36 0.01 � 0.003 5.39 � 0.83 0.04 � 0.01 7.53 � 1.61 Myrtenal tr 1.86 � 0.5 tr 0.89 � 0.28 tr 1.09 � 0.07 0.01 � 0.003 1.10 � 0.28 Myrtenol – 1.35 � 0.33 tr 0.81 � 0.22 tr 0.85 � 0.09 tr 1.09 � 0.29 Tridec-1-ene* 0.04 � 0.01 0.66 � 0.19 0.03 � 0.01 0.59 � 0.19 0.03 � 0.01 0.33 � 0.09 0.04 � 0.01 0.64 � 0.14 OxMT* – 0.28 � 0.24 – 0.52 � 0.25 tr 0.48 � 0.21 tr 0.19 � 0.1 NI:22.89 tr – 0.01 � 0.01 – tr – – – α-Copaene tr 0.98 � 0.43 tr 0.44 � 0.08 tr 0.84 � 0.1 tr 1.34 � 0.51 (E)-β-Caryophyllene 0.09 � 0.03 4.48 � 2.35 0.06 � 0.02 2.53 � 0.45 0.04 � 0.01 3.99 � 0.7 0.11 � 0.05 7.31 � 2.13 Geranyl acetone tr – 0.01 � 0.01 – tr – tr – α-Humulene tr 0.3 � 0.2 tr 0.14 � 0.04 tr 0.24 � 0.05 0.01 � 0.004 0.46 � 0.14 (E)-β-Farnesene 0.03 � 0.02 3.32 � 1.05 tr 0.37 � 0.13 tr 3.13 � 0.85 tr 2.52 � 1.02 β-Chamigrene* tr 0.09 � 0.09 tr 0.04 � 0.04 tr 0.01 � 0.01 tr 0.03 � 0.03 Germacrene-D 0.02 � 0.01 6.96 � 3.75 tr 2.52 � 0.45 tr 5.22 � 0.79 0.01 � 0.002 7.62 � 1.97 β-Selinene 0.04 � 0.01 5.76 � 1.74 0.04 � 0.03 8.11 � 5.21 tr 0.14 � 0.03 0.03 � 0.02 1.84 � 1.47 Arteannuin b* – 33.28 � 8.91 – 31.22 � 8.82 – 15.28 � 2.4 – 24.95 � 6.77 Other semi-volatiles – 18.66 � 4.90 – 18.00 � 5.14 – 10.31 � 1.56 – 13.55 � 4.03 MTs 2.12 ± 0.54 201.27 ± 45.50 1.15 ± 0.27 148.20 ± 42.37 1.11 ± 0.14 140.76 ± 25.18 2.23 ± 0.62 153.08 ± 20.55 SQs 0.19 ± 0.07 55.16 ± 13.19 0.13 ± 0.04 45.37 ± 13.47 0.06 ± 0.02 28.85 ± 2.75 0.18 ± 0.07 46.07 ± 11.07 Total 2.35 ± 0.52 275.75 ± 60.41 1.34 ± 0.29 212.16 ± 60.91 1.20 ± 0.15 180.25 ± 26.71 2.45 ± 0.68 213.35 ± 29.31
4% of the total VOC release.
Among the emitted VOCs, geranyl acetone and one non-identified compound (RT 22.89) were not detected in the leaf extracts but almost regularly in the emissions albeit at trace level. All other emitted VOCs were also observed in the leaf extracts with relative abundances similar to those of the emissions. However, the second major stored compound, a highly oxygenated SQ tentatively identified as arteannuin B, as well as a MT alcohol tentatively identified as verbenol and six non- identified compounds were exclusively found in the leaf extracts. Except verbenol, these stored but apparently non-emitted VOCs eluted all very late on our analytical column, hence were compounds having a very low volatility.
3.2. Emission responses to changes in assay temperature and CO2 Changing assay [CO2] and/or temperature significantly changed
total VOC emission rates ([CO2]: F ¼ 6.30; df ¼ 1; P ¼ 0.014;
temper-ature: F ¼ 239.95; df ¼ 1; P<0.001) (Fig. 3a) regardless of the climate conditions where plants were grown (F ¼ 0.84; df ¼ 9; P ¼ 0.58). The effect of assay [CO2] on emissions depended on assay temperature (CO2-
temperature interaction: F ¼ 2.79; df ¼ 1; P ¼ 0.09). At 30 �C, switching
assay [CO2] from 400 to 800 ppm had no significant effect on VOC
emission rates, whereas at 37 �C it significantly decreased volatile
emissions by about a third. The inhibitory CO2 effect on emissions at 37 �C was significant for both VOC classes (MTs, SQs) and all individual
major compounds with the exception of β-pinene and artemisia alcohol. Increasing assay temperature from 30 to 37 �C always significantly
increased emission rates of the individual compounds and the sum of VOCs. On average, the total VOC release of A. annua was about 3 times higher at 37 �C than at 30 �C (17% increase per �C). Assuming a log-
linear relationship between temperature and emission as applied in
emission models for storage-derived VOCs (Guenther et al., 2012), the resulting global slope β is 0.16 �C-1 (see supplementary data Table S2
and Fig. S1a). Due to the negative CO2 effect on emission at 37 �C, the
apparent rate of emission increase with temperature increase was marginally significantly greater at 400 ppm (19% �C 1, β ¼ 0.17) than at
800 ppm (15% �C 1, β ¼ 0.14) (V ¼ 204, P ¼ 0.07). Among compound
classes, MT emissions responded more strongly to temperature than SQ emissions (F ¼ 8.14, df ¼ 1, P ¼ 0.005). However, this compound spe-cific difference in the temperature responses was very similar at both assay [CO2] (F ¼ 0.22, df ¼ 1, P ¼ 0.64; MTs: 20%- and 15%- increase �C 1; SQs: 15%- and 10%-increase �C 1 at 400 and 800 ppm assay
[CO2], respectively; see also supplementary data Table S2 for β-values
and Figs. S1a and b).
Switching assay temperature from 30 �C to 37 �C consistently
decreased photosynthesis rates (Fig. 3b). The rate of decrease was significantly greater at 400 ppm than at 800 ppm (respectively 15.6% and 9.4%. V ¼ 38, P ¼ 0.0007). On the contrary, the photosynthesis rates of A. annua plants significantly increased when assay CO2 concentration
was doubled from 400 to 800 ppm. The rate of increase was significantly greater at 37 �C than at 30 �C (respectively 29.8% and 20.9%. V ¼ 32, P
¼0.0003).
3.3. Acclimation effects of growth conditions on VOC production
Growth conditions had only minor effects on the VOC production of
A. annua foliage. The mean emission rates measured at the standard
assay conditions of 30 �C and 400 ppm CO
2 ranged between 1.2 and 2.5
μg g 1 h 1 (11–26 ng m 2 s 1) of the four populations with the lowest
and highest value observed for the plants grown under elevated CO2 and
normal temperature and under elevated CO2 and elevated temperature
respectively (Table 1).
Fig. 2. Comparison of the composition of emitted and stored VOCs of Artemisia annua foliage. (a) Percentage contributions of the seven major compounds plus the
This apparent acclimation effect on the foliage emission capacities was however not significant for the sum of VOC emissions, for the sum of MTs and SQs emissions and for the major VOCs except for artemisia alcohol that was marginally higher in emissions of plants from the þT þ CO2 treatment than emissions of plants from “þT” and “þCO2” treat-ments (P ¼ 0.05 and P ¼ 0.09 respectively) (see supplementary data
Fig. S2a). Using the pooled emission data from the measurements made at the four different assay condition, our statistical analysis indicated reduced VOC emissions of the plants grown at elevated CO2 and normal
temperature with respect to plants grown at normal CO2 and
tempera-ture (Fig. 4a).
This negative acclimation effect of elevated growth CO2 on total
mean VOC emission rates was also marginally significant for the emis-sions of the main compound artemisia ketone (F ¼ 1.21, df ¼ 3, P ¼ 0.055), but not significant for the emissions of the other major VOCs or the sum of MTs and SQs. However, there was no more significant effect of growth CO2 when Anova analyses were run with emission rates
expressed per leaf area. Likewise, average VOC emissions per plant were not different among growth treatments suggesting that at whole plant scale any negative effect of elevated CO2 on the foliar emission capacity
was compensated by the CO2 fertilization effect on plant growth. Total
or individual VOC emission rates per dry weight or leaf area from plants grown under elevated temperature with either normal or elevated CO2
were not significantly different from all others. Growth conditions had also no significant effect on the foliar concentration of individual VOCs or VOC classes (Fig. 4b). In fact, foliar VOC concentrations were highly variable among replicate plants, especially within the population grown under ambient conditions.
3.4. Acclimation effects of growth conditions on primary metabolism
Growth conditions did not significantly affect the mean photosyn-thesis rate (F ¼ 1.44, df ¼ 3, P ¼ 0.26, measured at same assay condi-tions), plant height (F ¼ 0.80, df ¼ 3, P ¼ 0.51) and total leaf area (F ¼ 0.69, df ¼ 3, P ¼ 0.57) of A. annua plants (Table 2). However, growth under elevated CO2 had a global positive effect on the mean dry and
fresh biomass of the plants (dry biomass: F ¼ 6.91, df ¼ 1, P ¼ 0.02; fresh biomass: F ¼ 4.25, df ¼ 1, P ¼ 0.05). Consequently, the leaf mass per area (LMA) and the relative water content were respectively higher and lower in the þT þ CO2 treatment than in the ambient treatment (LMA: F
¼5.05, df ¼ 3, P ¼ 0.01; water content: F ¼ 2.83, df ¼ 3, P ¼ 0.06).
4. Discussion
One purpose of our study was to identify the VOCs emitted by
A. annua plants and to quantify the emission rates under undisturbed,
environmentally controlled conditions. The relative composition we observed in the foliar VOC emissions closely resembled that of the foliar VOC contents, especially when considering that some asymmetry be-tween the compositions is expected due to differences in the volatility of the individual VOCs and due to limitations in the VOC extraction method, notably unaccounted losses of light VOCs during the concen-tration step of leaf extracts (Ormeno et al., 2011). The compositional similarity of foliar VOC emissions and extract suggests that the great majority of the emitted VOCs came from the essential oil stored at the tip of the glandular trichomes covering foliage and stems. However, two minor emitted compounds were not detected in the leaf extracts, perhaps because our extraction method was not sensitive enough. Alternatively, these emissions are not part of the essential oil but derive
Fig. 3. VOC emissions (a) and photosynthesis (b) of whole Artemisia annua foliage measured at two assay [CO2] (400, 800 ppm) combined with two assay
tem-peratures (30, 37 �C). Boxes display the medians (central lines), the first and third quartiles (bottom and top borders of the box) respectively. The whiskers extend to
the most extreme data points. Symbols indicate the different CO2 and temperature conditions, in which the plant were grown. Superscript letters denote significant
from other small VOC pools. Geranyl acetone for example might be secondary formed from the breakdown of non-volatile metabolites such as carotenoids (Fruekilde et al., 1998; Kask et al., 2016). On the whole, the VOC composition we observed in the emissions as well as in the leaf extract agrees with the results of previous studies on A. annua. Artemisia ketone was always identified as the main compound (Woerdenbag et al.,
1993; Rapparini et al., 2008; Nibret and Wink, 2010), though its pro-portion may vary with the chemotype (Woerdenbag et al., 1993), the season and the method of VOC extraction (Ormeno et al., 2011; Nekoei et al., 2012).
As a highly aromatic plant that stores large amounts of VOCs in its glandular trichomes, A. annua emissions may essentially contribute to the atmospheric VOC load in rural landscapes where it is cultivated or commonly appears as ruderal or weed species. However, VOC emission rates of aromatic plants determined by enclosure techniques might be easily overestimated, since any mechanical stress leads to the rupture of trichomes, which causes large emission bursts (Niinemets et al., 2011). To avoid such artifacts we used large enclosures avoiding any contact between foliage and chamber wall and flushed chambers overnight after installation of the plants. Proceeding in this way, we observed that the whole foliage of individual A. annua plants released VOCs at rates of 1–5
μg g 1 h 1 under standard assay temperature. This is in the range of
those reported by other terpene storing plants (Kesselmeier and Staudt, 1999; Biogenic VOC emission database http://www.es.lancs.ac.uk/cnh group/download.html; �Simpraga et al., 2019) but 1–2 orders of
magnitude lower than those reported by Rapparini et al. (2008) for the same species. The aforementioned emission enhancement by mechani-cal stress might be the main reason for this discrepancy in addition to other methodological and biological sources of variation such as the choice of cultivar, measurement scale and conditions.
Growing A. annua under warmer and/or CO2-enriched atmospheres
hardly affected their overall BVOC emission capacities and had no sig-nificant effect on the short-term responses of emissions to assay CO2 and
temperature. Nevertheless, elevated-[CO2]-grown plants tended to have
a lower BVOC emission capacity per foliage dry weight, although this
Fig. 4. Effect of growth under different temperature and CO2 regimes on (a), total amount of VOCs emitted under the four assay conditions (symbols) and (b), total
foliar VOC concentration (μg g 1 DW) of Artemisia annua plants. Boxes display the medians (central lines), the first and third quartiles (bottom and top borders of the
box) respectively. The whiskers extend to the most extreme data points. Superscript letters denote significant differences between the means of n ¼ 6 replicate plants per growth treatment (VOC emissions: F ¼ 2.60; df ¼ 3; P ¼ 0.08; foliar VOC concentration: F ¼ 0.66; df ¼ 3; P ¼ 0.59).
Table 2
Effect of growth under elevated temperature (T) and/or [CO2] on photosynthesis
rate, plant height, foliage dry, fresh weight and leaf area, LMA and water content of Artemisia annua. Means � SEM (n ¼ 24) annotated with different letters are significantly different and * indicate an effect of elevated CO2 as a single factor.
Mean photosynthesis rates were calculated from the measurements made at standard assay conditions (30 �C and 400 ppm [CO2]).
Growth
conditions Photosynthesis (m2 s 1) μmol Height (cm) Dry weight (g) Fresh weight (g)
Ambient 10.62 � 0.52 12.83 � 0.79 0.82 �0.08 5.47 �0.61 þCO2 10.75 � 0.97 11.83 � 0.85 1.05 �0.12 * 6.58 �0.70 * þT 12.16 � 0.79 11.50 � 0.48 0.82 �0.13 5.08 �0.83 þT þ CO2 10.07 � 0.41 12.33 � 0.49 1.15 �0.12 * 6.33 �0.34 * Growth conditions Leaf area (cm2) LMA (g m2) Water content (%)
Ambient 293.59 � 24.04 27.96 � 0.66 a 84.80 � 0.36 a þCO2 326.64 � 44.70 31.88 � 1.16 ab 84.05 � 0.32 ab þT 281.79 � 34.61 29.36 � 1.52 ab 84.01 � 0.52 ab þT þ CO2 320.66 � 15.83 35.49 � 2.22 b 81.93 � 1.29 b
effect was compensated by higher growth rates. Furthermore, the lower emission capacity was attributed to an increase in LMA (Table 2) rather than to a true change of the emission source strength. The increase in LMA was mostly due to an increase in the leaf’s dry matter density (for example due to increased starch accumulation under elevated [CO2]) as
indicated by the significant decrease in leaf water content. Changes in leaf structure and composition are commonly observed in plants grown under elevated CO2 (Zvereva and Kozlov, 2006; Poorter et al., 2009; Sun
et al., 2012).
However, growth conditions had no significant effect on VOC con-tents of A. annua foliage that largely varied among individual plant replicates. Intraspecific chemical diversity in VOC production commonly exists in VOC storing plants (see e.g. Woerdenbag et al., 1993; Wu et al., 2011), which could have also increased the data vari-ability in our study of both, VOC contents and emissions. In addition, sporadic losses of VOCs during the extraction might have been contributed to data scattering, most likely some inevitable rupture of trichomes during the leaf sample preparation (i.e. the dissection, weighing and transfer of leaflets to the solvent). Finally as for emissions, variation in foliar VOC contents based on concentrations may not necessarily reflect changes in VOC production but can also result from dilution or concentration effects (Koricheva, 1999) thus further increasing the inconsistency of results within and among studies. Indeed, previous studies examining changes in the yield and composi-tion of essential oils of aromatic herbs or oleoresin of conifers grown under elevated CO2 and/or elevated temperature reported contrasting
effects, of which the majority found no or negative effects of elevated CO2 (Table 3).
Regarding the short-term influences of [CO2] and temperature,
doubling [CO2] decreased emissions at high assay temperature but not
at standard temperature, whereas switching temperature from 30 to 37
�C always strongly increased emissions, though the degree of increase
was apparently higher at low assay [CO2] than at high assay [CO2].
Thus, our results revealed a possible interaction in the temperature and CO2 responses of emissions, suggesting that either the positive effect of
temperature is attenuated by high [CO2] or the inhibitory effect of [CO2]
is enhanced by high temperature. This observation discords with the aforementioned conclusion of storage derived emissions. If A. annua VOC emissions are sustained by the large preformed reservoirs in the tips of its glandular trichomes, they should be insensitive to changes of [CO2] and any temporary variation in the plant’s metabolism. Even
changes in stomatal aperture should not affect the emission rate, because it is unlikely that the VOCs stored in the extracellular sub-cuticular cavity of the apical trichome cells diffuse back inside and along the subapical, stalk and basal trichome cells into the leaf parenchyma to leave the leaf via the stomata. Hence, emissions should depend solely on temperature driving the volatilization and diffusion through the cuticle of the trichome tips. A possible explanation for this apparent discrep-ancy is that a second, CO2-responsive de-novo synthesis VOC pool exists
in the photosynthetic leaf parenchyma, which fuels a fraction of the total
A. annua VOC release. Indeed, Tellez et al. (1999) found small amounts of SQs in the foliage extracts of glandless A. annua phenotypes and traces of ocimene indicating that isoprenoids are also produced outside tri-chomes. However, we found no ocimene emission in our study and there was no difference between the apparent CO2 responses of compound
classes. Furthermore, high-CO2 inhibition of de-novo synthesized
iso-prenoid emissions in photosynthesizing tissues occurs typically at low temperatures and not at high temperatures (Sharkey and Monson, 2014), which is the opposite what we have observed in the present study on A. annua emissions. An alternative explanation is that the CO2
sen-sitive part of the emissions stemmed from the young growing leaves and apex of the enclosed foliage. R€ais€anen et al. (2008) observed that elevated CO2 and temperature affects terpene emissions from Scots pine
saplings only during the period of shoot growth indicating that the responsiveness of emissions could be associated with oleoresin synthesis in the growing tissues. In A. annua as for many other VOC storing plants
(e.g. Turner et al., 2000; Vendemiatti et al., 2017), the production of essential oil takes place in developing trichomes and ceases when the reservoirs are filled and foliage becomes mature (Towler and Weathers, 2015; Tan et al., 2015). There, large amounts of isoprenoids are de-novo synthesized in the non-green apical trichome cells and subsequently actively excreted into the subcuticular space (Olsson et al., 2009; Tissier et al., 2017), during which a fraction could leak out in the air. Indeed, Lu et al. (2002) observed that that the transcript level of a terpene synthase is much higher in juvenile than in mature leaves of A. annua and that the temporal variations in transcript levels correlates with those of foliar emissions and contents. This suggests that some terpenes produced in juvenile foliage are not entirely sequestered and stored in glandular trichomes, but are released directly after synthesis (Lu et al., 2002). Given that the isoprenoid production there relies at least partly on photosynthate imports via phloem transport (Schuurink and Tissier, 2019), is influenced by stress hormones (Hao et al., 2017) and cross talks with other secondary metabolite pathways (Ma et al., 2018), it is plau-sible that it respond differently to CO2 than the constitutive synthesis of
isoprene in photosynthetic source tissues.
To conclude, we observed no relevant long-term, acclimation effect of elevated temperature and CO2 on the overall VOC production
ca-pacity of A. annua plants, apart from a general CO2 fertilization effect on
plant growth and leaf structure. Thus our results suggest that consid-ering short-term responses of emissions is sufficient to predict their future evolution. Contrary to isoprene emissions, A. annua emissions became CO2-inhibited at high temperature and not at moderate Table 3
Overview of the effects of growth under elevated CO2 concentrations or elevated
temperature on foliar VOC concentrations of aromatic herbs or conifers reported in the present and previous studies.
CO2 effect Plant species References
↗ Rosmarinus
officinalis Pe~nuelas and Llusi�a, (1997) Thymus vulgaris Vurro et al. (2009)
Valeriana
jatamansi Kaundal et al. (2018) ↘ Salvia officinalis Nowak et al. (2010)
Melissa officinalis Shoor et al. (2012)
Pseudotsuga
menziesii Litvak et al., 2002; Snow et al., 2003 Pinus sylvestris Sallas et al. (2003)
Picea abies Sallas et al. (2003)
Eucalyptus
camaldulensis Bustos-Segura et al. (2017)
¼ Artemisia annua Present study
Artemisia
tridentata Johnson and Lincoln, (1990) Pinus sylvestris Kainulainen et al., 1998, Heyworth et al.,
1998 a; Sallas et al., 2001
Pinus ponderosa Constable et al. (1999)
Pseudotsuga
menziesii Constable et al. (1999) Eucalyptus globulus McKiernan et al. (2012)
Eucalyptus
pauviflora McKiernan et al. (2012)
Temperature
effect Plant species References
↗ Picea abies Sallas et al. (2003)
Pinus sylvestris Sallas et al. (2003)
Pseudotsuga
menziesii Litvak et al. (2002) ↘ Pseudotsuga
menziesii Snow et al., 2003; Duan et al., 2019
b
Valeriana
jatamansi Kaundal et al. (2018)
¼ Artemisia annua Present study
Pseudotsuga
menziesii Duan et al., 2019
b
a No effect except an increase in α-pinene. b Depending on the tree’s provenance.
temperature thus reducing the apparent temperature response of 19% emission increase per �C to 15% �C 1. More in deep studies over larger
CO2 and temperature ranges are needed to corroborate and precise the
antagonistic interaction between these two factors and the underlying mechanisms. Furthermore, we need to know whether this phenomena is common in BVOC storing plant species and whether it is constrained to the growing vegetative phase. If so, the release of VOCs from A. annua and possibly other aromatic plants would increase less rapidly in a warmer and more CO2-enriched world due to the more frequent
nega-tive feedback of CO2 on their emissions.
Credit author statement
Juliane Daussy: Investigation, Formal analysis, Resources, Valida-tion; Visualization, Writing - Original Draft - Review & Editing
Michael Staudt: Conceptualization, Methodology, Validation, Writing - Original Draft - Review & Editing, Supervision, Project administration, Funding acquisition
Declaration of competing interest
The authors declare that they have no known competing financial interests or personal relationships that could have appeared to influence the work reported in this paper.
Acknowledgements
This study was funded by the project “ODORSCAPE” of the French National Research Agency (ANR15-CE02-010-01) with support of the LabEx CeMEB, an ANR “Investissements d’avenir” program (ANR-10- LABX-04-01). We thank M�elanie Colombier for carrying out preliminary tests and Dr. Maude Toïgo for her valuable advices on statistical ana-lyses. We are grateful to all members of the PACE and TE platform staffs for their technical assistance, and in particular to Bruno Buatois and David Degueldre.
Appendix A. Supplementary data
Supplementary data to this article can be found online at https://doi. org/10.1016/j.aeaoa.2020.100082.
References
Bustos-Segura, C., Dillon, S., Keszei, A., Foley, W.J., Külheim, C., 2017. Intraspecific diversity of terpenes of Eucalyptus camaldulensis (Myrtaceae) at a continental scale. Aust. J. Bot. 65, 257–269. https://doi.org/10.1071/BT16183.
Constable, J.V., Litvak, M.E., Greenberg, J.P., Monson, R.K., 1999. Monoterpene emission from coniferous trees in response to elevated CO2 concentration and climate warming. Global Change Biol. 5, 252–267. https://doi.org/10.1046/j.1365- 2486.1999.00212.x.
Desrosiers, M.R., Towler, M.J., Weathers, P.J., 2019. Artemisia annua and artemisia afra essential oils and their therapeutic potential. In: Essential Oil Research. Springer, Cham, pp. 197–209. https://doi.org/10.1007/978-3-030-16546-8_6.
Duan, Q., Kleiber, A., Jansen, K., Junker-Frohn, L.V., Kammerer, B., Han, G., Zimmer, I., Rennenberg, H., Schnitzler, J.-P., Ensminger, I., Gessler, A., Kreuzwieser, J., 2019. Effects of elevated growth temperature and enhanced atmospheric vapour pressure deficit on needle and root terpenoid contents of two Douglas fir provenances. Environ. Exp. Bot. 166, 103819. https://doi.org/10.1016/j.envexpbot.2019.103819. Dudareva, N., Klempien, A., Muhlemann, J.K., Kaplan, I., 2013. Biosynthesis, function
and metabolic engineering of plant volatile organic compounds. New Phytol. 198, 16–32. https://doi.org/10.1111/nph.12145.
Feng, Z., Yuan, X., Fares, S., Loreto, F., Li, P., Hoshika, Y., Paoletti, E., 2019. Isoprene is more affected by climate drivers than monoterpenes: a meta-analytic review on plant isoprenoid emissions. Plant Cell Environ. 42, 1939–1949. https://doi.org/10.1111/ pce.13535.
Follak, S., Dullinger, S., Kleinbauer, I., Moser, D., Essl, F., 2013. Invasion dynamics of three allergenic invasive Asteraceae (Ambrosia trifida, Artemisia annua, Iva xanthiifolia) in central and eastern Europe. Preslia 85, 41–61.
Franceschi, V.R., Krokene, P., Christiansen, E., Krekling, T., 2005. Anatomical and chemical defenses of conifer bark against bark beetles and other pests. New Phytol. 167, 353–376. https://doi.org/10.1111/j.1469-8137.2005.01436.x.
Fruekilde, P., Hjorth, J., Jensen, N.R., Kotzias, D., Larsen, B., 1998. Ozonolysis at vegetation surfaces: a source of acetone, 4-oxopentanal, 6-methyl-5-hepten-2-one,
and geranyl acetone in the troposphere. Atmos. Environ. 32, 1893–1902. https:// doi.org/10.1016/S1352-2310(97)00485-8.
Gershenzon, J., Dudareva, N., 2007. The function of terpene natural products in the natural world. Nat. Chem. Biol. 3, 408. https://doi.org/10.1038/nchembio.2007.5. Ghirardo, A., Koch, K., Taipale, R., Zimmer, I.N.A., Schnitzler, J.P., Rinne, J., 2010.
Determination of de novo and pool emissions of terpenes from four common boreal/ alpine trees by 13CO2 labelling and PTR-MS analysis. Plant Cell Environ. 33, 781–792. https://doi.org/10.1111/j.1365-3040.2009.02104.x.
Grote, R., Niinemets, Ü., 2008. Modeling volatile isoprenoid emissions–a story with split ends. Plant Biol. 10, 8–25. https://doi.org/10.1055/s-2007-964975.
Guenther, A.B., Jiang, X., Heald, C.L., Sakulyanontvittaya, T., Duhl, T., Emmons, L.K., Wang, X., 2012. The Model of Emissions of Gases and Aerosols from Nature version 2.1 (MEGAN2.1): an extended and updated framework for modeling biogenic emissions. Geosci. Model Dev. (GMD) 5, 1471–1492. https://doi.org/10.5194/gmd- 5-1471-2012.
Hao, X., Zhong, Y., Fu, X., Lv, Z., Shen, Q., Yan, T., Shi, P., Ma, Y., Chen, M., Lv, X., Wu, Z., Zhao, J., Sun, X., Li, L., Tang, K., 2017. Transcriptome analysis of genes associated with the artemisinin biosynthesis by jasmonic acid treatment under the light in artemisia annua. Front. Plant Sci. 8. https://www.frontiersin.org/ar ticle/10.3389/fpls.2017.00971.
Harper, K.L., Unger, N., 2018. Global climate forcing driven by altered BVOC fluxes from 1990 to 2010 land cover change in maritime Southeast Asia. Atmos. Chem. Phys. 18, 16931–16952. https://doi.org/10.5194/acp-18-16931-2018.
Harrison, S.P., Morfopoulos, C., Dani, K.G.S., Prentice, I.C., Arneth, A., Atwell, B.J., Barkley, M.P., Leishman, M.R., Loreto, F., Medlyn, B.E., Niinemets, Ü., Possell, M., Pe~nuelas, J., Wright, I.J., 2013. Volatile isoprenoid emissions from plastid to planet. New Phytol. 197, 49–57. https://doi.org/10.1111/nph.12021.
Heil, M., 2008. Indirect defence via tritrophic interactions. New Phytol. 178, 41–61. https://doi.org/10.1111/j.1469-8137.2007.02330.x.
Herrmann, S., Jessing, K.K., Jørgensen, N.O., Cedergreen, N., Kandeler, E., Strobel, B.W., 2013. Distribution and ecological impact of artemisinin derived from Artemisia annua L. in an agricultural ecosystem. Soil Biol. Biochem. 57, 164–172. https://doi. org/10.1016/j.soilbio.2012.08.011.
Heyworth, C.J., Iason, G.R., Temperton, V., Jarvis, P.G., Duncan, A.J., 1998. The effect of elevated CO 2 concentration and nutrient supply on carbon-based plant secondary metabolites in Pinus sylvestris L. Oecologia 115, 344–350.
Holopainen, J.K., Virjamo, V., Ghimire, R.P., Blande, J.D., Julkunen-Tiitto, R., Kivim€aenp€a€a, M., 2018. Climate change effects on secondary compounds of forest trees in the Northern Hemisphere. Front. Plant Sci. 9 https://doi.org/10.3389/ fpls.2018.01445.
Huang, J., Hartmann, H., Hellen, H., Wisthaler, A., Perreca, E., Weinhold, A., Racker, A., van Dam, N.M., Gershenzon, J., Trumbore, S., Behrendt, T., 2018. New perspectives on CO2, temperature, and light effects on BVOC emissions using online measurements by PTR-MS and cavity ring-down spectroscopy. Environ. Sci. Technol. 52, 13811–13823. https://doi.org/10.1021/acs.est.8b01435.
Jiang, J., Aksoyoglu, S., Ciarelli, G., Oikonomakis, E., El-Haddad, I., Canonaco, F., O’Dowd, C., Ovadnevaite, J., Minguillon, M.C., Baltensperger, U., Pr�ev^ot, A.S.H., 2019. Effects of two different biogenic emission models on modelled ozone and aerosol concentrations in Europe. Atmos. Chem. Phys. 19, 3747–3768. https://doi. org/10.5194/acp-19-3747-2019.
Johnson, R.H., Lincoln, D.E., 1990. Sagebrush and grasshopper responses to atmospheric carbon dioxide concentration. Oecologia 84, 103–110. https://doi.org/10.1007/ BF00665602.
Jokinen, T., Berndt, T., Makkonen, R., Kerminen, V.M., Junninen, H., Paasonen, P., et al., 2015. Production of extremely low volatile organic compounds from biogenic emissions: measured yields and atmospheric implications. Proc. Natl. Acad. Sci. Unit. States Am. 112, 7123–7128. https://doi.org/10.1073/pnas.1423977112. Juuti, S., Arey, J., Atkinson, R., 1990. Monoterpene emission rate measurements from a
Monterey pine. J. Geophys. Res.: Atmospheres 95 (D6), 7515–7519. https://doi.org/ 10.1029/JD095iD06p07515.
Kainulainen, P., Holopainen, J.K., Holopainen, T., 1998. The influence of elevated CO2 and O3 concentrations on Scots pine needles: changes in starch and secondary metabolites over three exposure years. Oecologia 114, 455–460. https://doi.org/ 10.1007/s004420050469.
Kask, K., K€annaste, A., Talts, E., Copolovici, L., Niinemets, Ü., 2016. How specialized volatiles respond to chronic and short-term physiological and shock heat stress in Brassica nigra. Plant Cell Environ. 39, 2027–2042. https://doi.org/10.1111/ pce.12775.
Kaundal, M., Bhatt, V., Kumar, R., 2018. Elevated CO2 and temperature effect on essential oil content and composition of valeriana jatamansi jones. With organic manure application in a Western Himalayan region. J. Essential Oil Bearing Plants 21, 1041–1050. https://doi.org/10.1080/0972060X.2018.1497547.
Kessler, A., Halitschke, R., Diezel, C., Baldwin, I.T., 2006. Priming of plant defense responses in nature by airborne signaling between Artemisia tridentata and Nicotiana attenuata. Oecologia 148, 280–292. https://doi.org/10.1007/s00442- 006-0365-8.
Kesselmeier, J., Staudt, M., 1999. Biogenic volatile organic compounds (VOC): an overview on emission, physiology and ecology. J. Atmos. Chem. 33, 23–88. https:// doi.org/10.1023/A:1006127516791.
Koricheva, J., 1999. Interpreting phenotypic variation in plant allelochemistry: problems with the use of concentrations. Oecologia 119, 467–473. https://doi.org/10.1007/ s004420050809.
Kulmala, M., Suni, T., Lehtinen, K.E.J., Maso, M.D., Boy, M., Reissell, A., et al., 2004. A new feedback mechanism linking forests, aerosols, and climate. Atmos. Chem. Phys. 4, 557–562. https://doi.org/10.5194/acp-4-557-2004.