Dry Process Fluorination of Uranium Dioxide Using Ammonium Bifluoride
byCharles Burnett Yeamans
B.S., Chemical Engineering and Nuclear Engineering (2001) University of California, Berkeley
Submitted to the Department of Nuclear Engineering as One Element of Fulfillment of the Requirements for the Degree of Master of Science in Nuclear Engineering
at the
MASSACHUSETTS INSTIl
Massachusetts Institute of Technology OF TECHNOLOGY
September 2003 DEC
0 5
200LIBRARIES
© 2003 Massachusetts Institute of Technology all rights reserved
Signature of Author:
Department of Nuclear Engineering June 30, 2003
Certified by:
Kenneth R. Czerwinski Associate Professor of Nuclear Engineering Thesis Supervisor Certified by: Techn1 '' ' Accepted by: . John R. FitzPatrick ;al Laboratory Fhesis Reader Jeffery Coderre Chair, Department Committee on Graduate Studies
SCIENCE
UTE
3
Dry Process Fluorination of Uranium Oxides using Ammonium Bifluoride
byCharles Burnett Yeamans
Submitted to the Department of Nuclear Engineering as Partial Fulfillment of the Requirements for the Degree of Master of Science in Nuclear Engineering
ABSTRACT
An experimental study was conducted to determine the practicality of various unit operations for fluorination of uranium dioxide. The objective was to prepare ammonium uranium fluoride double salts from uranium dioxide and ammonium bifluoride, then decompose these salts to uranium tetrafluoride through heating to temperatures near 425 'C in either a fluidized bed or a stirred bed. Fluorination in the stirred bed was attempted without pretreatment of the reagents. For the fluidized bed experiments, reagents were ball-milled prior to being heated in the bed. Experiments were conducted in either argon or 4% hydrogen in argon.
The ball mill appeared to be an effective technique for fluorinating uranium dioxide with ammonium bifluoride. Samples changed color from brown to bright green, and no oxides could be detected in the
x-ray diffraction pattern of the product.
It was found that stainless steel is a suitable material of construction for reaction vessels, whereas mild steel parts corroded quickly. Only a small degree of fluidization provided adequate mixing in fluidized beds, but a paddle mixing the stirred beds left an unmixed region around the bed perimeter. Results from the stirred beds showed the initial fluorination reaction completed only when the reagents were heated to 110 'C for at least three hours under argon. Decomposition took place under argon with a temperature ramp up to 425 'C. The product UF4 contained less than 1% oxide as an impurity, and the decomposition appeared to be complete.
Fluidized beds were run with both argon and 4% hydrogen in argon as carrier gases. Experiments with 4% hydrogen in argon produced uranium tetrafluoride, with ammonium uranium pentafluoride and uranium dioxide as impurties. Experiments in argon produced uranium tetrafluoride, with uranyl difluoride, ammonium diuranyl pentafluoride and triuranium octoxide as impurities. Minimum temperatures and times needed to decompose the double salt in the fluidized beds were 200 minutes at 115 'C, a 500-minute ramp to 425 *C, and 200 minutes at 425 'C. The intermediate double salt produced at 110 'C appeared to be triammonium uranium septafluoride.
Thesis Supervisor: Kenneth R. Czerwinski
Associate Professor, Department of Nuclear Engineering Thesis Reader: John R. FitzPatrick
Dedicated to Steve Yeamans, Bill Burnett, and David Pierce
In Los Alamos: Michael Martinez was absolutely indispensable, and without him I'm sure I never would have completed this project. Bobby Gonzalez, Gene Zimmerman, and Toby Romero got me the stuff to keep my equipment running, whether it had to be bought, made, borrowed, or "borrowed." Lorraine Vigil shoveled through the snowstorm of paperwork, and Louis Rivera kept me company, as was required by security regulations. Brad Shake made sure I had the tools and safety glasses I needed. Amy Canstefneda did most of the preliminary work without being able to take much credit. The library staff humored my requests for obscure articles from long-defunct journals and found most of them among dusty storage room shelves.
In Cambridge: Karen Noyes, Gini Curran, and Jon Plaue know all the secret doors, cabinets, handshakes, signs, rooms, and forms it takes to navigate through MIT, as well as answering all of my stupid questions about where to find things. Mathieu Salanne translated all of my French and Belgian references, and for that I owe him a hamburger and French fries (which he informs me are actually Belgian). In addition to that, his work on the project I was supposed to be doing was nothing short of phenomenal, thus diverting enough attention from me to work on this one without harassment. Andy Gallant suggested enough changes to my experimental equipment such that it would actually be possible to construct, and then streamlined it through the machine shop ahead of all the undergraduate thesis projects.
The University of California, Berkeley Department of Nuclear Engineering will allow me to pursue my dream of cleaning up other people's radioactive garbage now that MIT has given up on it. Per Peterson talked me into being a nuclear engineer because it's important.
My advisor Ken Czerwinski, a.k.a. Flipper and a member of the LFHCfS, continues to be the
grooviest cat ever to grace the sciences. He has given me the freedom to do this project for no better reason than I wanted to pursue it. As always, he sends his love. John FitzPatrick came up with this whole idea, and then let me take it with me.
I'd like to thank any deities and/or godlike entities who may have assisted me in this project, although no such help was solicited nor knowingly accepted.
Apologies: Susan KcKinney, I'm sorry I argued so much that you had to kick me out of high school chemistry. All molecular motion does cease at 0 *C and I was wrong to insist that it didn't. To the sociology department at Berkeley, sociology is not a "pseudoscience," nor is its research methodology "systematically and pathologically unscientific." I was wrong to say those things,
among others, and I'm sorry I made your Sociology 3 professor cry. Louie Cernicek, sorry about your back yard, man. Next time I'll do a more thorough job of gluing the fins on the rocket. Mrs. Fox, I never should have flipped you off. That was very rude of me, even though you deserved it. Mrs. Dorin, it was petty of me to repeatedly suggest that it was both trivial and pointless to complete ream after ream of long-division practice sheets. I can't imagine where my life would be without long division... oh the long division I have done since then. You were right to give me even more reams of long-division practice sheets to teach me how to be a better human being. Oh, and I'm sorry I flipped you off, even though you deserved it. Principal Paluzcek, elementary school was not "a big fat waste of my time" and you and your teachers were not "glorified babysitters" and I'm sorry about attempting to tamper with your brakes. In addition, I apologize for making you spend so much time talking to me about my behavior. I can't help but think that if I had just been quiet, paid attention, walked on the sidewalk, followed the rules, and done as I was told I could have done something with my life... maybe even gone to college. Oh, and I'm sorry I flipped you off, even though you deserved it.
Contents
Abstract Acknowledgements Contents List of Figures List of Tables Introduction Motivation Experimental Overview Chapter 2: Background2.1 Physical and Chemical Properties of Uranium Compounds 2.1.1 Oxides
2.1.2 Fluorides and Ammonium Fluorides
2.2 Chemical Behavior of the Ammonium-Uranium-Fluoride System 2.3 Common Methods for Preparation of Uranium Tetrafluoride 2.4 Fluidized Bed Technology in Uranium Processing
2.5 Fluidized Bed Behavior Chapter 3: 3.1 3.2 Chapter 4: 4.1 4.2 4.3 4.4 4.5 4.6 4.7
Experimental Equipment and Procedure General Considerations
Experimental Descriptions
3.2.1 Ambient Temperature Fluorination 3.2.1.1 Unagitated Reactants
3.2.1.2 Manually Agitated Reactants 3.2.1.3 Mechanically Agitated Reactants 3.2.2 Stirred Bed
3.2.3 Fluidized Beds
3.2.3.1 Small Glass Column 3.2.3.2 Large Glass Column
3.2.3.3 Full-Scale Stainless Steel Column 3.2.3.3.1 Experimental Apparatus
3.2.3.3.2 Temperature Monitoring and Control 3.2.3.3.3 Temperature Cycles
3.2.3.3.4 Feedstock Analytical Methods
General Comments Uranium Mass Fraction
Soluble Uranyl Fluoride Content Oxygen Content Nitrogen Content Thermogravametric Analysis X-Ray Diffraction page 3 Chapter 1: 1.1 1.2 11 11 12 13 13 13 14 14 17 17 17 21 21 21 21 21 22 22 22 24 24 24 26 26 27 27 28
Chapter 5: Results and Discussion
5.1 Fluorination of Uranium Dioxide
5.1.1 Unagitated Reactants
5.1.2 Mechanically Mixed Reactants 5.1.2.1 Stirred Bed
5.1.2.2 Ball Mill
5.1.2.3 Small Fluidized Bed
5.2 Decomposition of the Double Salt
5.2.1 Stirred Bed Reactor 5.2.2 Fluidized Bed
5.2.2.1 Intermediate Product
5.2.2.2 Final Product: UF4
5.3 Materials Durability and Structural Integrity 5.4 Bed Fluidization
Chapter 6: Conclusion
6.1 Effectiveness of Ball Mill Technique for Fluorination 6.2 Effects of Plateau Temperatures
6.2.1 Lower Plateau Temperature 6.2.2 Upper Plateau Temperature 6.3 Effects of Hold Times
6.3.1 Lower Hold Time 6.3.2 Upper Hold Time 6.4 Effects of carrier gas
6.5 Suitability of Construction Materials
6.6 Fluidized Bed versus Stirred Bed
6.6.1 Advantages of the Stirred Bed 6.6.2 Advantages of the Fluidized Bed
References
Appendix A: Engineering Drawings of Stainless Steel Column
Appendix B: X-ray Diffraction Patterns and Search Match Results
Appendix C: ICP-AES Data
C-I Total Uranium
C-I Water Soluble Uranium
Appendix D: Heating Cycles
Appendix E: Carrier Gas Flow Data
Appendix F: Sample Masses and Experimental Yields
page 33 33 33 33 33 34 37 39 39 40 40 43 50 50
List of Figures
page
2.1 Phase Diagram of the Uranium Oxide System 13
2.2 Structure of Uranium Tetrafluroide 14
2.3 X-ray Diffraction Patterns of (NH4)2UF6 Phases 16
2.4 Flow Regimes for Upward Flow of Gas through a Particle Bed 19
3.1 Stirred Bed Apparatus 23
3.2 Heating Schedules for Mechanically Agitated Reagents 23
3.3 Full Scale Glass Column 25
3.4 Detail of Full Scale Glass Column 25
3.5 Main Column Piece 26
3.6 Frit Disk 26
3.8 Measured Temperatures versus Time for Sample CBY-05 28
5.1 Ambient Temperature Fluorination 33
5.2 Product after Incomplete Fluorination in Stirred Bed 34
5.3 Ambient Temperature Fluorination, Fine U0 2 34
5.4 Ambient Temperature Fluorination, Coarse U0 2 35
5.5 TGA Curve of Ball-Milled Sample 36
5.6 TGA Weight Loss Rate Curves of Ball-Milled Samples 37
5.7 TGA Curves of Small Column Samples 38
5.8 X-ray Diffraction Pattern of U02 with Corundum Standard, Intensity vs. 20 40
5.9 TGA Curve of Intermediate Product Sample, Removed at 110 *C 41
5.10 TGA Weight Loss Rate Curve of Intermediate Sample 42
5.11 TGA Curves of Final Product Samples 44
5.12 X-ray Diffraction Pattern of UF4 with Corundum Standard, Intensity vs. 20 44 5.13 X-ray Diffraction Patterns of U0 2, UF4, and Samples Prepared in 4% H2 45
5.14 Results of Nitric Acid Dissolution 47
5.15 Results of Water Dissolution 49
6.1 Samples Prepared from U02 with Different Particle Sizes 51
6.2 X-ray Diffraction Pattern of Intermediate Product 53
6.3 Temperature Measurements for Samples CBY-02a and CBY-02b 54 6.4 X-ray Diffraction Patterns of Samples CBY-02a and CBY-02b 54
A.1 Bottom Column Part 61
A.2 Middle Column Part 62
A.3 Top Column Part 63
B. 1 Search Match List and X-ray Diffraction Pattern for U02 Sample 65 B.2 Search Match List and X-ray Diffraction Pattern for U308 Sample 65
page Search Match List and X-ray Diffraction Pattern for Small Column Sample
Search Match List and X-ray Diffraction Pattern for Ball-Milled Sample Prepared from Coarse U02
Search Match List and X-ray Diffraction Pattern for Ball-Milled Sample Prepared from Fine U02
B.4 B.5 B.6 B.7 B.8 B.9 B.10 B.11 B.12 B.13 B.14 D.1 D.2 D.3 D.4 D.5 D.6 Diffraction Pattern Diffraction Pattern Diffraction Pattern Diffraction Pattern Diffraction Pattern Diffraction Pattern Diffraction Pattern Diffraction Pattern for for for for for for for for Sample Sample Sample Sample Sample Sample Sample Sample CBY-01 CBY-02a CBY-02b CBY-03 CBY-04 CBY-05bl CBY-05gr CBY-06 Heating Cycle Heating Cycle Heating Cycle Heating Cycle Heating Cycle Heating Cycle Match List and X-ray Match List and X-ray Match List and X-ray Match List and X-ray Match List and X-ray Match List and X-ray Match List and X-ray Match List and X-ray Search Search Search Search Search Search Search Search CBY-01 CBY-02 CBY-03 CBY-04 CBY-05 CBY-06
2.1 List of Tables
page
3.1 Important Values from Temperature Cycles 28
4.1 Strong X-ray Diffraction Peaks of Corundum 31
5.1 Theoretical Weight Loss Values for Compounds in the Ammonium 35 Uranium Fluoride System
5.2 Search Match List for Small Column Samples 37
5.3 Impurity Analysis on Intermediate Products from Stirred Bed Experiments 39 5.4 Impurity Analysis on Final Products from Stirred Bed Experiments 39
5.5 Search Match List for U0 2 Sample 40
5.6 Masses and Yields of Fluidized Bed Samples 43
5.7 X-ray Diffraction Pattern Match for Sample UF4 45
5.8 Search Match List for Final Product Prepared in 4% Hydrogen 46
5.9 Theoretical Chemical Analysis Values 46
5.10 Chemical Analysis Results 47
5.11 Results of Water Dissolution 48
5.12 Adjusted Water Dissolution Results 48
5.13 Soluble Uranium not Attributable to Uranium Tetrafluoride or Uranium 49 Oxides
6.1 Search Match List for Intermediate Product Samples 52
C. I Calibration Standard Data for Total Uranium Dissolution Analysis 77 C.2 Unknown Sample Data for Total Uranium Dissolution Analysis 77 C.3 Calibration Standard Data for Water Soluble Uranium Dissolution Analysis 78 C.4 Unknown Sample Data for Water Soluble Uranium Dissolution Analysis 78
E. 1 Carrier Gas Flow Values 83
E.2 Calibration of Flowmeter for Air at 1 atm, 70 'F 83
Chapter 1: Introduction
1.1
Motivation
Ammonium bifluoride (NH4HF2, also known as ammonium hydrogen fluoride) has
been shown to fluorinate uranium dioxide (U0 2), and has been used successfully in the
preparation of both tetravalent uranium fluoride salts and ammonium uranium fluoride double salts. Uranium dioxide can be converted to uranium tetrafluoride (known as "green salt" in the nuclear power industry) by a number of industrially accepted methods. The commonly deployed industrial processes use powerful fluorinating agents such as hydrogen fluoride at temperatures above 600 'C [1]. Since ammonium bifluoride is much less toxic than hydrogen fluoride, and the temperatures involved would be below 460 'C, it may prove a better industrial fluorinating agent. Equipment could be constructed from less exotic engineering materials; 300-series stainless steel is compatible with ammonium bifluoride whereas nickel or Monel is required to handle the more powerful fluorinating agents [2]. Uranium tetrafluoride can be reduced to uranium metal with calcium metal and iodine [3] and is also an intermediate in the production of uranium hexafluoride, used for isotopic enrichment of uranium by gaseous diffusion, through the Fluorox process reaction with air at 800 'C [4]:
2UF4 + 02 -+ U0 2F2 + UF6
This work attempts to demonstrate, on a small scale, the feasibility of operating a fluidized bed process for the production of uranium tetrafluoride. Fluidized beds represent one of the most studied chemical engineering unit operations, but since the primary focus herein is on the applicability of this technology and not its optimization, very little effort has been devoted to fluidized bed performance relative to the ammonium uranium fluoride system thermochemistry. After finishing work with the stirred bed apparatus, it became apparent that a better method for keeping reagents well mixed while removing decomposition products would be necessary in order to develop an effective chemical process. The fluidized bed presents itself as the logical option since a carrier gas provides a means of agitation and heat transfer to reactants, while at the same time removing the more volatile decomposition products and excess reagents. A fluidized bed has a distinct advantage over a rotating drum, also commonly employed for processes involving solid-solid chemistry, in that it has no moving mechanical parts. Mechanical simplicity, from which reliability usually follows,
constitute the foundation of any practical chemical engineering process, and constitutes the primary motivation for use of a fluidized bed.
1.2 Experimental Overview
Uranium dioxide will be converted to uranium tetrafluoride by fluorination with ammonium bifluoride to form the intermediate double salt tetra-ammonium uranium octafluoride dehydrate, (NH4)4UF8-2H20. This double salt will then be thermally
decomposed, yielding uranium tetrafluoride and ammonium fluoride.
The first objective of this project was to investigate the chemistry of the ammonium uranium fluoride system in a somewhat practical setting: the stirred bed reactor. Samples of reaction products were taken after both the initial fluorination and after decomposition of the double salt. At the intermediate stage, the primary impurity is oxygen remaining from incomplete fluorination of U0 2. Excess ammonium bifluoride reagent and ammonium
fluoride may also be present. After the vessel was heated above 400 "C, decomposition should be complete, with partially decomposed ammonium uranium fluoride salts and uranium oxides as the primary impurities. Although a stirred bed demonstrated the chemistry, it fell short in enough practical areas to warrant development of a better unit operation.
The second, more practically applicable objective was to demonstrate this process in a fluidized bed reactor. The fluidized bed concept attempts to affect the same chemistry as the stirred bed, with analysis focused on the same points; however, it was necessary to first determine the proper operating conditions, in particular the gas flow rate, before an apparatus could be finalized. By first running a small sample in a glass chromatography column, visual observation confirmed proper bed fluidization. A full-scale glass column provided an exact analog for the final apparatus: a stainless steel column contained within a tube furnace to provide the full range of desired temperatures. The stainless steel column attempts to demonstrate effectiveness of the fluidized bed process for uranium fluorination, the materials compatibility of stainless steel with this process, and the suitability of pure argon or hydrogen in argon as a carrier gas.
Chapter 2: Background
2.1
Physical and Chemical Properties of Uranium Compounds
2.1.1 Oxides
Uranium dioxide is a brown or black solid with a cubic structure, melting at 2878 'C, and having a bulk density between 2.0 and 5.0 grams per cubic centimeter [5]. Finely divided uranium dioxide appears brown, whereas coarser-grained material appears black. Even small amounts of oxidation to higher oxides (UO2+8) will also cause U0 2 to appear black.
Non-stoichiometric oxides of uranium, UO2+x, where x is a continuous variable between 0 and 1, form spontaneously from the stoichiometric dioxide in the presence of oxygen (Figure 2.1). Tetrauranium nonoxide (U409, or U02.2 5), a black solid, constitutes a genuine phase in the
phase diagram of uranium oxide. It forms slowly at 20 'C from uranium dioxide in the presence of oxygen. Uranium dioxide is most easily prepared from higher oxides by reduction with hydrogen at 300-600 *C. U308 is generally the most stable oxide of uranium in air. Even under conditions where U308 is not the stable phase, it is often formed since the reaction of U0 2 with oxygen is rapid compared to the reaction of U308 with oxygen.
w
V
O: Ur
11 111
]aa
Figure 2.1 - Phase Diagram of the Uranium Oxide System: from Galkin NP, Sudarikov BN, et. al., Technoloqy of Uranium, translated from Russian by USAEC, Springfield, Va : available from the U.S. Dept. of Commerce, Clearinghouse for Federal Scientific and Technical Information, 1966, p 18.
2.1.2 Fluorides and Ammonium Fluorides
Uranium tetrafluoride is a green solid with a slightly distorted square antiprismatic structure (eight-fold uranium-fluorine coordination, Figure 2.2). It melts at 960 'C and has a negligible vapor pressure at ambient temperature. Bulk density of the tetrafluoride is between 2.0 and 4.5 g/cc, depending on the method of preparation. UF4 is stable in air up to at least
600 *C. The hydrated octafluoride double salt is a bright lime-green solid. Other ammonium uranium salts are light green.
U F4
Square Antiprism
Figure 2.2 - Structure of Uranium Tetrafluoride
Uranyl difluoride (U0 2F2) is light yellow. It is stable in air up to 300 'C, after which
it begins to decompose to U308. Above 110 'C, hydrated forms lose water to form anhydrous
uranyl difluoride. It is highly soluble in water (65.6 weight % at 25 C). Preparation is easiest from U0 3 and gaseous hydrogen fluoride at 300 'C, and can also be prepared with
greater difficulty from aqueous solutions of U0 3 and hydrofluoric acid [6].
2.2
Chemical Behavior of the Ammonium-Uranium-Fluoride System
Uranium (IV) oxide and 10% excess ammonium bifluoride will react at 80-125 0C in an argon atmosphere to yield the dehydrated ammonium-uranium fluoride double salt (NH4)4UF8 [7]. Ammonium bifluoride sublimes at 126 'C [8]. Although there is some debate
as to the actual behavior of the chemical system, current knowledge indicates it behaves as described by Wani, Patwe, et. al. [9].
Fluorination: 1) U0 2 + 4 NH4
-HF
2 -* (NH4)4UF8-2H20 80-125 OC 2) (NH4)4UF8-2H
20 -+ (NH4)4UF8 + 2H20 Decomposition: 3) (NH4)4UF8 -> (NH4)3UF7 + NH4F 4) (NH4)3UF7 -* (NH4)2UF6 + NH4F 125-425 0C 5) (NH4)2UF6 -+ NH4UF5 + NH4F 6) NH4UF5 -> UF4 + NH4FSome older literature reports only NH4UF5 in the decomposing system, although the
conditions described most likely lead to the formation of (NH4)4UF8. Benz, Douglass, et al.,
[10] prepared samples of ammonium uranium fluoride compounds using a thermogravametric analyzer to control both temperature and atmosphere. Any sample that could be removed from the apparatus, remaining chemically and thermally stable, was considered a stationary arrest. Compounds inferred from their weight, but not actually removed and analyzed, were considered non-stationary arrests. Stationary arrests of (NH4)2UF6, NH4UF5, and NH4F-3UF4
as well as a non-stationary arrest of (NH4)4UF8 were reported. Some experiments were done
under argon, others under vacuum, but the decomposition was always reported to complete near 425 0C. The tetrafluoride is sufficiently stable to preclude decomposition of the
tetrafluoride to the trifluoride [11].
Previous TGA studies of compounds in the ammonium uranium fluoride system suggest the existence of a large number of stable and metastable uranium tetrafluoride-ammonium fluoride compounds. Three polymorphic species were found for NH4UF5, while
four were found for (NH4)2UF6 [12]. The decomposition of ammonium uranium
pentafluoride contains two discrete steps [13]. The heavier compounds, between (NH4)4UF8s2H20 and (NH4)2UF6, are somewhat difficult to identify by TGA alone because
one ammonium fluoride molecule has mass similar to two water molecules. Decomposition of the double salt can easily be confused with the loss of hydrate water from (NH4)4UF8-2H20. Modem literature sites crystallographic evidence that the system does
contain the doubly hydrated octafluoride, and decomposition is sequential starting with the hydrate water and continuing to ammonium fluoride from the dehydrated compounds.
Powder x-ray diffraction patterns are known for most compound in the ammonium uranium fluoride system, with the most identifiable being the four phases of (NH4)2UF6 (Figure 2.3). The distinct low 20 peak may be used to identify this intermediate species, as no other ammonium uranium (IV) fluoride or uranium oxide has this peak. Ammonium uranyl fluoride compounds have their most intense peak between 110 and 13'.
60 4S 40 36 30 to to to ~
Figure 2.3 - X-ray Diffraction Patterns of (NH4)2UF6 Phases: The peak just below 150 distinguishes these compounds from any other in the system of interest.
from Penneman RA, Kruse FH, et. al., Inorganic Chemistry, 3 #3 (1964), 309-315.
The use of ammonium bifluoride does raise the issue of solid-solid surface chemistry, but reaction kinetics are sufficiently fast if the reactants are finely ground and the bed is agitated during the reaction [14]. As a fluorinating agent, ammonium bifluoride is sufficient to fluorinate the tetravalent oxide, but will not, by itself, fluorinate tetravalent uranium to UF6.
As a reducing agent, no evidence is given for ammonium bifluoride reducing uranium oxides. Uranyl difluoride (U02F2) will form when uranium dioxide reacts with ammonium bifluoride
in the presence of oxygen in the range of 25-180 'C [15]. Uranyl difluoride also forms from the reaction of U308 and ammonium bifluoride in an inert atmosphere.
2.3
Common Methods for Preparation of Uranium Tetrafluoride
Uranium tetrafluoride can be prepared through the decomposition of ammonium uranium pentafluoride, NH4UF5, which is commonly prepared by precipitation from aqueous
uranium solutions. Ammonium diuranate, (NH4)2U207, when reduced with zinc in
hydrochloric acid, forms uranium tetrachloride dissolved in aqueous ammonium chloride. Upon treatment with aqueous hydrofluoric acid, ammonium uranium pentafluoride precipitates. This can then be filtered and dried [16]. In another aqueous process, ammonium uranium fluoride is precipitated directly from an aqueous uranium (IV) solution with aqueous ammonium bifluoride [17]. Mixtures of ammonium bifluoride and hydrazine fluoride have also been used to produce ammonium uranium pentafluoride [18]. The decomposition of ammonium uranium pentafluoride has been studied both on a laboratory scale, [19,20,21] and an industrial scale (see section 2.4). In the ammonium uranium (VI) fluoride system, double salts of ammonium fluoride and uranyl difluoride can be reduced to uranium tetrafluoride using a stream of Freon-12 (dichlorodifluoromethane) at 450-500 *C. [22]
2.4
Fluidized Bed Technology in Uranium Processing
A successful fluidized bed plant for the decomposition of ammonium uranium pentafluoride was built and operated in South Africa in the early 1960's. Feedstock was obtained from aqueous precipitation. Nitrogen was used to fluidize beds of approximately 500 kg of ammonium uranium pentafluoride per batch. Twenty six such batches were treated to produce UF4 with less than 20 ppm nitrogen [23].
2.5
Fluidized Bed Behavior
Fluidized beds are common as unit operations in chemical processes involving
solid-solid chemical reactions. A carrier gas is forced upward through a vertical bed of small solid particles, expanding and agitating the bed, giving it many properties of a liquid. In this state, powders can be made to flow through valves and piping, so fluidization is a common method of powder transport in the absence of a chemical reaction. When a reaction is desired, a fluidized bed provides the degree of homogenization required for high yields in a mechanically simple way compared to rotating blades or drums. Preheating the carrier gas
provides a simple method of temperature control within the bed, and due to the high degree of mixing, heat and mass gradients within the bed are virtually non-existent.
The degree and nature of bed fluidization depend largely on the properties of both the powder and carrier gas. The Archimedes number. Ar, Equation (2.1), is a representation of particle size.
Ar=d 3PAP' =(d,*)3 (2.1)
A descriptive nondimensional fluid velocity is given by Equation (2.2).
U*=U- P (2.2)
where
U = actual upward superficial fluid velocity, volumetric flow per total cross-sectional area
p = fluid density
Ap = difference between fluid density and particle theoretical density
= fluid viscosity
dp= mean particle diameter g = gravitational constant
Grace [24] gives a map describing bed operation within a wide parameter space of d* and U*. Particles are grouped based upon mean size and density. Uranium dioxide is generally in the form of Geldart Group B particles [25].
For spherical particles, the terminal fluid velocity, alternately interpreted as the velocity at which particles are entrained in the carrier gas stream and carried out of the bed, is approximately fifty times the minimum flow needed to fluidize the bed [26]. This gives a great deal of leeway in the operating parameters of a fluidized bed.
Different fluidization regimes (Figure 2.4) are characterized by an increasing bed void fraction as upward gas flow is increased. In the aggregative fluidization regime, individual particles remain largely in contact with one another, ideal for a bed in which a chemical reaction between two components is desired. A freeboard distance must be given above the top of the bed to allow for particles thrown up by normal spouting action to fall back into the bed without being carried out of the system. This can be estimated as the transport
disengagement height (TDH). For columns on the order of 0.01 m in diameter, the theoretical TDH is less than 0.1 m at all gas flows where aggregative fluidization occurs [27].
>171
'KY'
Q4
1XED &A) t aBut4O SLUG FLOW TUPRuum NPEUMAnCFASU
O REGIM REGIME EmFLIDAZAII ON CONV NG
W1LAYf D
ROWLING AOGtGA~jVF FLUIDI ZATION
INCREASING Ut
Figure 2.4 - Flow Regimes for Upward Flow of Gas through a Particle Bed: The aggregative
flow regimes are ideal for bed in which a surface chemical reaction is desired.
T
Chapter 3: Experimental Equipment and Procedures
3.1 General Considerations
The decomposition of the ammonium-uranium fluoride system has been shown to take place at temperatures in the range of 425 'C. After all of the uranium oxide reacts to form the double salt, the temperature is ramped to -425 'C to decompose the tetra-ammonium uranium octafluoride to produce an intermediate ammonium-uranium fluoride salt and ammonium fluoride. The bed is maintained at an elevated temperature to complete the decomposition of the salt to pure uranium tetrafluoride.
3.2 Experimental Descriptions
At ambient lab temperature (-20 *C), uranium dioxide and ammonium bifluoride were mixed both manually and mechanically. Heating of the reactants was carried out in both stirred and fluidized beds. Any experiment involving decomposition of ammonium fluoride double salts was done in a fume hood. Uranium oxide used in the stirred bed trial and the manually agitated ambient temperature trial was fairly coarse, thus the black color. For all other trials, the uranium dioxide used was Alfa-Aesar Lot #K22M14, 99.8% metal basis
U0
2,finely divided (30 pm), brown in appearance. Ammonium bifluoride was supplied by Aldrich Chemical: 99.999%, Batch #14207AB. Both pure argon and 4% hydrogen in argon were supplied by BOC Gases.
3.2.1 Ambient Temperature Fluorination
3.2.1.1
Unagitated Reactants
At ambient temperatures (-20 *C), reactants can be mixed in Pyrex beakers because etching of glass by ammonium bifluoride is slow at these temperatures. Ammonium bifluoride rapidly etches glass at higher temperatures.
3.2.1.2 Manually Agitated Reactants
44.8 g of finely ground ammonium bifluoride was mixed with 52.4 g uranium dioxide. A small borosilicate glass beaker placed in a fume hood contained the reactants. Contents of the beaker were blended with a scoop once daily until the color was homogeneous throughout the mixture. Progress was monitored visually for a period of 17 days.
3.2.1.3 Mechanically Agitated Reactants
14.60 g uranium dioxide and 12.98 g ammonium bifluoride were placed in a ball mill (Spex Certiprep 8000M mixer/mill) for twenty minutes. The ball mill shakes the material contained in the vessel with several small stainless steel balls. The final product is finely divided but compacted, which was then ground by hand in an agate mortar to free the powder.
3.2.2 Stirred Bed
The reaction was attempted in a stainless steel stirred bed vessel (Figure 3.1) with a diameter of six inches surrounded by a tube furnace capable of producing temperatures up to 600 'C. The entire apparatus was contained within a ventilation hood to prevent personnel exposure to radioactive material and hazardous chemicals. A programmable electronic controller connected to a thermocouple maintained the furnace tube temperature within 10 *C of the setpoint. A separate thermocouple measured the temperature inside the reaction vessel. Finely ground ammonium bifluoride (88.2 g) was mixed with of uranium dioxide (100 g). An argon flow rate of 0.05 standard cubic feet per hour maintained an inert atmosphere within the reaction vessel. The temperature ramp began after loading material into the crucible, which was located near the bottom of the vessel. A Dayton 4Z435 gear motor, providing 26.2 in-lbs of torque at 7 rpm, turned a paddle with %" of clearance from the inside of the crucible. Mild steel shimstock (0.005") was added to the outside of the paddle blades in an attempt to eliminate the gap between the paddle blades and the crucible wall.
Figure 3.1 - Stirred Bed Apparatus: A crucible sat within the reactor vessel (left) and reactants
were stirred by a paddle (right). The coating of rust visible in these pictures was the result of corrosion of mild steel shimstock that had been attached to the paddle to aid in complete mixing. Very little corrosion of stainless steel parts was seen.
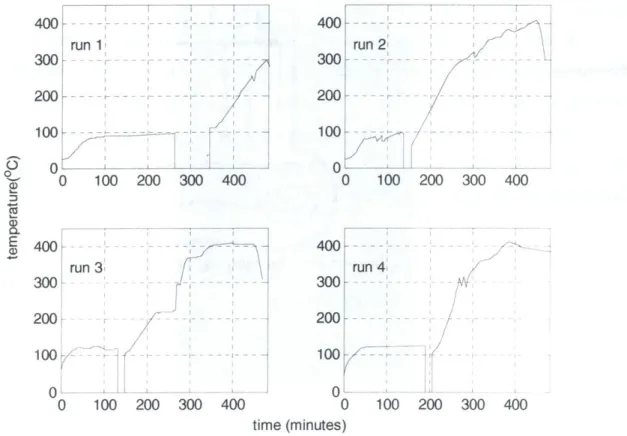
Four different heating schedules were considered (Figure 3.2).
400 ---run1 300
200k
- - -- 100--0 0 100 400-run 3 300 200 100v 0 0 -I 200 300 400 400 -. -run 2 300 200 100 0 0 100 400 -run 4 300 200 --200 300 400 100 100 200 300 400 100 200 300 400 time (minutes)
Figure 3.2 - Heating Schedules for Mechanically Agitated Reactants: These trials are
characterized by the lower plateau temperature and duration, and the maximum temperature and
Trials 1 and 2 held the sample at -80 *C while trials 3 and 4 held the sample near 120 'C. Trial 3 held the sample above 400 'C for two hours whereas trial 4 allowed the temperature to drop below 400 'C for most of the upper temperature plateau. Samples from trials I and 2 were not analyzed due to distinctly black U0 2 visible in the final product.
3.2.3 Fluidized Beds
3.2.3.1 Small Glass Column
An 8.6 mm glass disposable chromatography column fitted with an argon flow line was loaded with 1.5 g U0 2 and 1.25 g NH4HF2. Argon was forced upward through the
column frit at flows sufficient to fluidize the bed. The column was run in this manner at ambient temperature for ten days. Initial observations on the smaller column showed a significant variation between the calculated and actual bed properties.
3.2.3.2 Large Glass Column
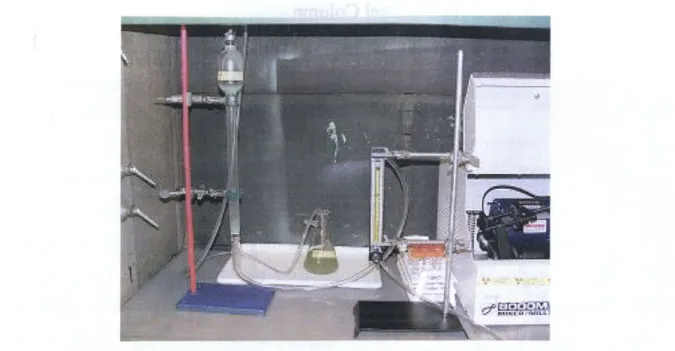
A full scale, unheated apparatus (Figure 3.3) was made from a pesticide chromatography column (Kimble-Kontes 420600-0000, 22 mm ID) loaded with 6.08 g of ball-milled material. Heating was not available in this setup as NH4HF2 rapidly etches
borosilicate glass at elevated temperatures; however, this setup enabled the determination of appropriate argon flow ranges, eliminating much of the experimental uncertainty in bed fluidization since it could be verified visually in this setup (Figure 3.4).
Figure 3.3 - Full Scale Glass Column: Argon flow is regulated and measured by the flowmeter at right, and flows upwards through the column at left. A water bubbler (at center) retains any uranium powder that may escape the system.
Figure 3.4 - Detail of Full Scale Glass Column During Operation:
. .. ... ....
3.2.3.3 Full-Scale Stainless Steel Column 3.2.3.3.1 Experimental Apparatus
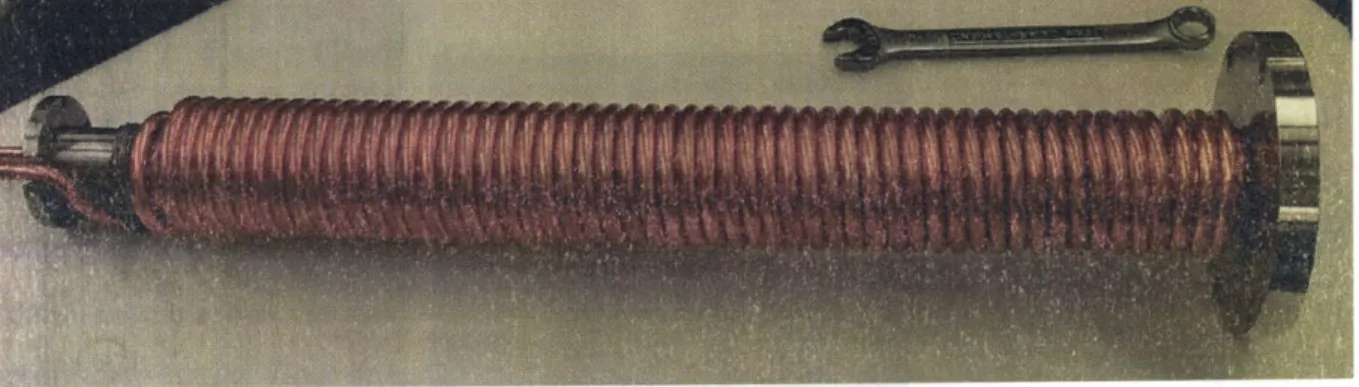
The final setup constructed from stainless steel allowed for heating to achieve the full range of required temperatures. See Appendix A for detailed engineering drawings. The full-s cale column confull-sifull-sted of a one-inch diameter 304 full-stainlefull-sfull-s full-steel pipe (Figure 3.5), mounted vertically and fitted with a 20 gm mesh disk (Figure 3.6) to support the bed. Fifteen inches of freeboard provided particle arresting, as did an expansion to two-inch diameter just upstream of the gas outlet. Carrier gas flowed through copper tubing wound around the outside of the main tube as a pre-heater before passing through the bed. The tube was supported in the center of a two-inch tube furnace (Barnstead/Thermolyne 21100), which kept the bed at a controlled temperature (Figure 3.7). Thermocouples inserted below the bed and at the top of the freeboard section measured temperature, recorded by a digital thermometer (VWR Double Thermometer with Computer Output #23226-656) fitted with Type K thermocouples.
Figure 3.5 - Main Column Piece: Copper tube was wound around the column to act as a
pre-heater for the inlet argon stream. The bed is located at the bottom of the column, which is on the far right side of this photo.
Figure 3.7 - Full Scale Steel Column: The entire setup was contained in a fume hood.
3.2.3.3.2
Temperature Monitoring and Control
Rigid Type K thermocouples were mounted at both ends of the column. The primary thermocouple sat about 1/8" below the bed, vertically in the gas stream. A secondary thermocouple measured temperature near the column outlet, just above the top column flange. Temperature was controlled by the built-in controller (Eurotherm 2116) on the furnace. Furnace tube temperature could be set, as well as ramp rates and dwell times. Since the temperature difference between the furnace tube and the bed varied slightly between trials, furnace setpoints were adjusted accordingly to maintain proper bed temperature.
3.2.3.3.3 Temperature Cycles
Heating cycles were designed to heat the bed to a lower plateau temperature within five degrees of 115 'C. Upper plateaus were designed to hold the bed within five degrees of 425 'C. Hold times are given for the actual measured values, not set dwell times, and are reported based on the time for which the measured temperature was within two degrees of the given bed temperature value. The outlet temperature responded much more slowly to changes in furnace tube temperature, thus the actual outlet temperature hold times were less than those for the bed temperature. Table 3.1 contains important parameters for heating cycles used. Figure 3.8 plots a typical heating cycle.
lower plateau upper plateau
sample time (min) bed temp outlet temp time (min) bed temp outlet temp
CBY-01 112 81 68 132 427 257
CBY-02 64 101 n/a 156 439 183
CBY-03 186 108 80 116 437 185
CBY-04 172 111 73 n/a n/a n/a
CBY-05 245 120 75 238 428 179
CBY-06 190 114 91 262 426 215
Table 3.1 - Important Values from Temperature Cycles
500 400 300 --- IEDI ---O 200 -- -- - --- -- --- --- -- - --- - -- - - --- --- E--100 - -- - - --- 0 -0 200 400 600 800 1000 1200 1400
time (mi- bed temperature
- upper temperature
Fi gure 3.8 - Measured Temperatures versus Time
for
Sample CBY-053.2.3.3.4
Feedstock
Most fluidized bed samples (CBY-02 through CBY-06) were prepared using a ball-milled mixture of ammonium bifluoride and uranium dioxide with 2.37% excess ammonium bifluoride by weight. Sample CBY-01 was prepared from a similar feedstock that had not been ball-milled.
Chapter 4: Analytical Methods
4.1
General Comments
Different analytical methods were used to analyze stirred bed samples than were used to analyze fluidized bed samples. This chapter describes all methods used, and to which samples they apply. In general, the method used was selected based on availability. The thermogravametric analyzer was not purchased until after the stirred bed experiments were completed, nor was the x-ray diffraction equipment available at that point. For this reason, the samples from the fluidized bed experiments received significantly better analytical treatment than those from the stirred bed.
4.2 Uranium Mass Fraction
For samples prepared in the stirred bed reactor, uranium mass fractions were determined by liquid scintillation counting.
For those prepared in fluidized beds, a small sample, in the range of 10mg, was removed and dissolved in 1OmL concentrated nitric acid. The dissolved sample was diluted with de-ionized water to 25 mL in a volumetric flask. This solution was transferred to a scintillation vial from which 1mL of solution was pipetted to a separate vial with 7mL of dionized water. This brought the uranium and acid concentration into a proper range for inductively-coupled plasma atomic emission spectroscopy (ICP-AES), usually 0.01 to 0.05 grams uranium per liter. The ICP-AES instrument used was a SpectroFlame PMC FMD-07 (SN 4605/92). Calibration curves were obtained for each session from standard samples prepared by dilution of a PlasmaCAL 1000 gg/mL uranium standard (Lot SC22359 1).
4.3
Soluble Uranyl Fluoride Content
To exploit the solubility difference between uranium (IV) and uranium (VI) compounds, water dissolution was performed to determine the fraction of uranium in water soluble species. 25 mg samples were dissolved in dionized water. After nine hours, these samples were diluted to 25 mL and the uranium concentration measured using ICP-AES.
4.4
Oxygen Content
Material prepared in the stirred bed were analyzed for oxygen content by heating samples in a graphite crucible to 1000 IC under an inert atmosphere. The CO concentration was then measured, and the oxygen content of the sample interpolated using a calibration curve.
4.5 Nitrogen Content
Samples prepared in the stirred bed were analyzed for total nitrogen content by ion chromatography. Free NH3 and soluble NH4/ was determined by water dissolution, followed by ion chromatography.
4.6 Thermogravametric Analysis
Thermogravametric analysis was performed on a Perkin Elmer, Pyris 1 TGA using sample sizes between 5 and 40 mg. There was no offgas analysis. Details of heating cycles are provided with each data set in the lower part of all TGA data figures. Argon was used as both a blanket gas and pneumatic gas. There was no oxygen removal system on the gas inlet.
4.7 X-Ray Diffraction
X-ray diffraction patterns were obtained with a Rigaku RU200 x-ray tube with a rotating copper anode. The copper Kai line was used for the analysis in a 185 mm diffractometer. Samples were run using the maximum power available from the tube: 18 kW, operating at 60 kV and 300 mA. Sample scans covered a 2-theta range from ten to one hundred degrees, and patterns were analyzed using JADE (version 5.0) software. This software removed amorphous background peaks and Ka2 lines from the raw pattern. Output is a list of possible matches to known compounds based on the observed pattern. This software contained powder diffraction files for most uranium compounds, but these files were listed as "questionable." Data analysis takes on a much more heuristic character with the apparent lack of reliable data, as patterns from unknown samples could be compared to those obtained with standard uranium compound samples. Similar peak locations and sizes can be compared, but no quantitative analysis can be performed with this method.
Corundum (A1203) was added to samples in order to calibrate the 20 axis. Corundum
lines are present in all XRD patterns. The stronger lines contained in the JADE powder diffraction file are shown in Table 4.1.
20 1/l& 25.578 0.45 35.152 1.00 37.776 0.21 43.355 0.66 52.549 0.34 57.496 0.89 61.298 0.14 66.519 0.23 68.212 0.27 76.869 0.29 77.224 0.12
Chapter
5:
Results
5.1
Fluorination of Uranium Dioxide
5.1.1 Unagitated Reactants
Experiments at ambient temperature (-20 C) demonstrated that fluorination of UO2 to
(NH4)4UF8-2H20 progresses slowly: visible amounts of unreacted U0 2 and NH4-HF2
remained after 17 days (Figure 5.1). When heated to near 125 *C, this reaction proceeds quickly.
0 days 2 days 10 days 14 days 17 days
Figure 5.1 - Ambient Temperature Fluorination: The reaction between ammonium bifluoride and
uranium dioxide progressed slowly at room temperature, evident by the slow change from black uranium dioxide to the green ammonium fluoride double salt.
5.1.2 Mechanically Mixed Reactants
5.1.2.1
Stirred Bed
Because no samples from the stirred bed were taken before the heating cycle began, any conclusions about the effectiveness of fluorination must be made based upon samples from intermediate decomposition stages. Oxides in the intermediate may be left over from incomplete fluorination or come from oxygen in the cover gas. Based on the visible presence of uranium oxides in stirred bed trials I and 2 (Figure 5.2), and the lack of visible oxide in trials three and four, it appears that three hours at 80 'C is not sufficient to allow' the fluorination reaction to go to completion if the reactants are not finely ground.
5.1.2.1
Trial #1 Trial #2
Figure 5.2 - Product After Incomplete Fluorination in Stirred Bed: Black
U02 powder is visible in green UF4. The fluorination reaction is slow at 800C.
Ball Mill
After being ground for twenty minutes in the ball mill, the mixture of finely divided uranium dioxide and ammonium bifluoride turned the color of hydrated ammonium uranium octafluoride (Figure 5.3). A ball-milled mixture with larger-grained uranium dioxide showed no color change initially (Figure 5.4); however, after being left for 24 hours, the color of the mixture was similar to that of the product from the experiment with finer uranium dioxide.
Figure 5.3 - Ambient Temperature Fluorination, Fine U02: When the brown reagents (left)
were ground in a ball mill for twenty minutes, a pronounced color change to bright green (center)
occurred. After the powder was fluidized in argon for two days, the color was slightly lighter (right).
Figure 5.4 - Ambient Temperature Fluorination, Coarse U02: When black U02 and NH4HF2 (left) were ground in a ball mill for twenty minutes, no color change occurred initially (right). After twenty four hours, the color was similar to that of the product from finer-grained uranium dioxide. The larger particle size slows the fluorinations reaction, but not so severely as to impede actual processing.
Samples prepared using the ball mill from both coarse and fine U0 2 were analyzed
using TGA (Figure 5.5 and Figure 5.6). The analysis of Benz, Douglass, et. al., used TGA run times near 1000 hours, but since this amount of time was not available, shorter runs were used. Different heating cycles were used in an attempt to economize time expenditure, and since later analysis revealed both ball-milled samples to be the same material, TGA data was interpreted assuming analysis of one sample could be applied to the other. The first heating cycle used appeared to be too fast to allow for the decomposition steps to complete in a discrete and identifiable manner, so a slower heating cycle was used. Theoretical weight fraction values for TGA of (NH4)4UF8-2H20 are shown in Table 5.1.
species
composition
molecular fraction of
U F
NH
4H
20
0
weight
initial wt.
(NH4)4UF82H20 1 8 4 2 0 498.2 E1.000 (NH4)4UF8 1 8 4 0 0 462.1 0.928 (NH4)3UF7 1 7 3 0 0 425.1 0.853 (NH4)2UF6 1 6 2 0 0 388.1 0.779 NH4UF5 1 5 1 0 0 351.0 0.705 UF4 1 4 0 0 0 314.0 0.630 U0 2 1 0 0 0 2 270.0 0.542 Ammonium to the blue Table 5.1 - Theoretical Weight Loss Valuesfor Compounds in theUranium Fluoride Double Salt System: These values correspond dashed lines drawn on subsequent TGA plots.
A loss of what was most likely hydrate water and some ammonium fluoride occurred below 80 'C, and further loss of ammonium fluoride continued up to 110 *C. At 110 0C, the product weight matched that calculated for (NH4)3UF7. Another distinct loss step began near
150 'C with a final weight matching that of (NH4)2UF6. All weight loss steps above 200 C
did not lead to a weight corresponding to any compound observed in the ammonium uranium fluoride system. The sharpest weight loss occurred at 278 *C, with one additional distinct step starting just above 300*C.
50 100 (NH )UF*2H O 4 20 (NH)U~44 8 (NH ) UF 43 7 (NH4)2UF6 (NH')UF UF 150 200 250 300 350 400 450 500 temperature (OC) -- - --- ---- ---- --- - -- --- - - --- - -- - - - --~~ -- - - - - - - -500 --- --- --400 300-- -200 --100 ----- -0 0 100 200 300 400 500 time (min) 600 700 800 900 1000
Figure 5.5 - TGA Curve of Ball-Milled Sample: (upper) Dashed lines show theoretical plateau
values for various intermediate compounds in the ammonium uranium fluoride system. The curve starts above a mass fraction of one to account for removal of excess ammonium bifluoride. The lower plot shows the heating cycle used.
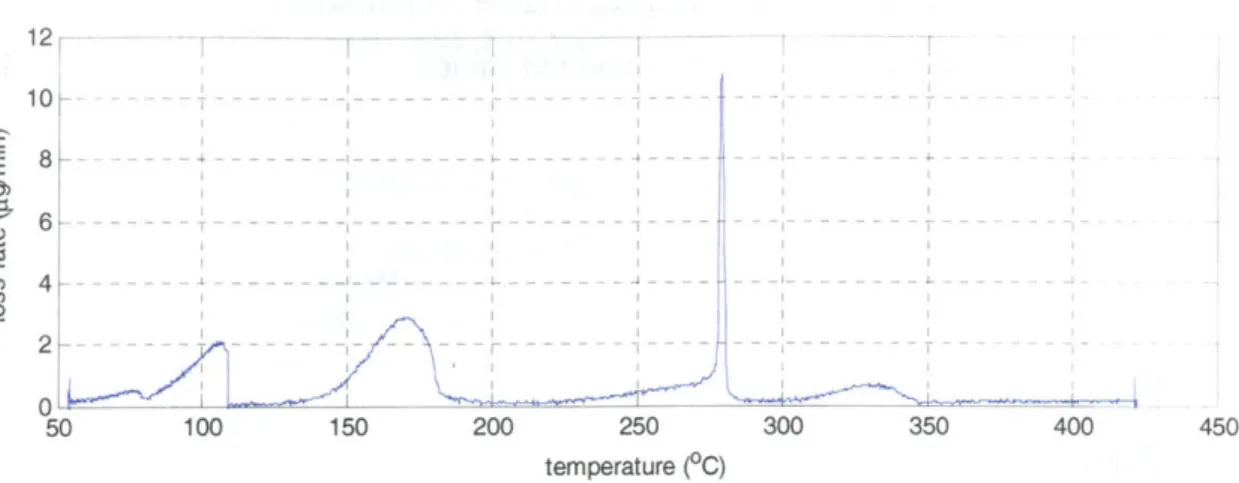
0.9 CU 0. 0.8 0 0.6 0 .. . . .. .. ... ... ... ... ... . .....
12,
C
0
50 100 150 200 250 300 350 400 450
temperature (OC)
Figure 5.6 - TGA Weight Loss Rate Curves of Ball-Milled Samples: Rate of weight loss is plotted versus temperature. Five distinct weight loss steps are observed.
Since no powder diffraction file existed for the hydrated double salt, these samples could only be analyzed for the presence of uranium oxides. It was assumed interference from the pattern of (NH4)4UF8-2H20 would not be strong enough to preclude the observation of
uranium oxides, and that a pattern in which no uranium oxides were detected was sufficient evidence for complete fluorination. No uranium oxides could be identified in the XRD spectra of the ball-milled products.
5.1.2.3
Small Fluidized Bed
Samples produced in the small fluidized bed were light green in color and showed no visible signs of dark U0 2. XRD analysis did not identify the compound formed, but
identified excess NH4HF2, and did not identify the presence of U0 2 (Table 5.2). No powder
diffraction file existed for the hydrated double salt, (NH4)4UF8-2H20, therefore it is possible
for the compound to be present without being identified.
pattern match figure of merit comment
Corundum, Al203 6.3 standard used for 20 calibration
NH4HF2 25.9 excess reagent
Al(OH)3 32.4 spurious match
A1603N4 43.6 spurious match
Aluminum Oxide, A1203 39.8 likely from corundum standard
Table 5.2 - Search Match List for Small Column Samples: Only excess ammonium bifluoride
and corundum were identified in the small column sample. No uranium oxides were matched, demonstrating the completeness of the fluorination reaction after one week without any mechanical grinding of the reagents.
TGA curves from small column samples (Figure 5.7) showed at least three distinct
weight loss steps, but weight loss exceeded expected values.
1.1 (NH)4UF*2H O (NH4)4UF' (NHUF7 (NH4)2UF' (NH4 UF, UF K 0 50 100 150 200 250 300 temperature (OC) 3 350 400 450 500 500 CBY-smco I2-TGA 1 4 0 0- -'- - - - --300 - ~_ CBY-smcol2-TGA2 200J C100 - --- -E 0 0 20 40 60 80 100 time (min)
Figure 5.7 - TGA Curves of Small Column Samples: At least three distinct weight loss steps are
evident. The second trial, CBY-smcol2-2, was an attempt to gain greater resolution in the higher temperature region by slowing the ramp rate. Weight loss exceeds expected values.
1 0.9 0.8 0.7 0.6 0.5 0.3 . ..... .... ... ... ... . .... ...
5.2
5.2.1
Decomposition of the Double Salt
Stirred Bed Reactor
Samples from trials 3 and 4 were taken after the lower heating plateau and from the final product. These samples were dried at 120 'C to remove atmospheric water and analyzed for oxygen and nitrogen impurities, and for overall uranium content (Tables 5.3 and 5.4).
sample
uranium (g/g)
oxygen (ppm)*
intermediate run #3 0.5155 270 intermediate run #4 0.5187 1700
pure (NH4)4UF8 0.5149 0
99% (NH4)4UF8 with
U02 as the impurity 0.5171 1000
* assuming U02 is the only impurity present at this stage
Table 5.3 - Impurity Analysis on Intermediate Products from Stirred Bed Experiments
uranium
oxygen
Nitrogen (pg/g)
sample
(g/g)
(ppm)
Total NHg/NH
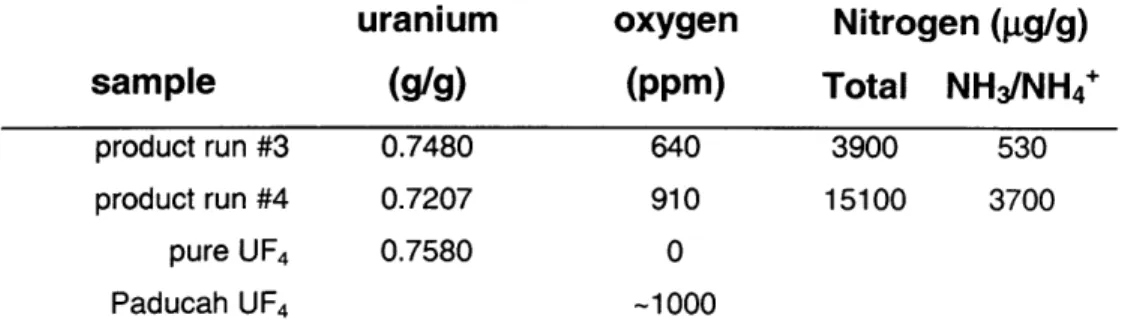
4'
product run #3 0.7480 640 3900 530
product run #4 0.7207 910 15100 3700
pure UF4 0.7580 0
Paducah UF4 -1000
5.2.2
Fluidized Bed
5.2.2.1
Intermediate Product
Samples removed from the column after a dwell time of 172 minute at 110 'C were analyzed to determine the chemical speciation at this temperature and to detect signs of uranium oxides. UO2 produces a simple x-ray diffraction pattern (Figure 5.8), with the most
intense peak at 28.2', and is easily identified by JADE (Table 5.5). Scans were run over a 20
range from 100 to 100'.
LKLI
10 20 30 40 50 60 70 80 90 100
Figure 5.8 - X-Ray Diffraction Pattern of U02 with Corundum Standard, Intensity versus 2 0. This pattern was obtained from U02 used as a starting material. Although this scan begins at 20=200,
no significant peaks exist below 20* in the pattern of U02.
pattern match figure of merit comment
U0 2 1.7 likely species
Corundum, A1203 6.0 standard used for 20 calibration Table 5.5 - Search Match List for U02 Sample: U02 and the corundum standard were the only likely species identified by x-ray diffraction.
-TGA curves of the intermediate product (Figure 5.9) yield no useful information on the composition of the intermediate. Since no oxygen trap was installed in the inlet line to the TGA, oxidation of the sample may have occurred, and would explain the constant weight loss slope apparently superimposed over the discrete steps of the double salt decomposition.
(NH 4)3UF 7 (NH )2UF (NH 4}UF 5 UF4 150 200 25C 300 temperature (OC) 350 400 450 500 intermediate product
removed after dell at 110 0C
50 100 150 200 250
time (min)
Figure 5.9 - TGA Curve of Intermediate Product Sample, Removed at 110 'C: This sample
was removed from the column after the dwell period at 110 *C. Product is expected to be an ammonium uranium fluoride double salt close in stoichiometry to (NH4)3UF7.
1.05 1 0.95 -0.9 0.85 i o> 0) 0 & 0 E a) 0.75-4 0.7 -100 500 400 T 300 - 200-100 0 0
By comparing the rate of weight loss from an intermediate sample to that of a ball-milled sample, it is possible to determine if the intermediate decomposes through the same steps as the starting material once the starting material has been brought to the temperature at which the intermediate was made. Figure 5.10 shows such a plot; however, the ramp rates for the two samples were different. This means the plots cannot easily be directly compared. It can be seen that the plots do have similar features, with those for the intermediate being more spread out along the temperature axis. This follows from the intermediate analysis being done at a faster ramp rate than for the starting material.
15 10 -E 0 1 1II 50 100 150 200 250 300 350 400 450 temperature (OC)
ball mill product
intermediate decomposition product
Figure 5.10 - TGA Weight Loss Rate Curve of Intermediate Product: Rate of weight loss is
plotted versus temperature. Features appear similar to those in the plot for the ball-milled samples, but since ramp rates and sample sizes were different (2 *C per minute for the intermediate versus one *C per minute for the bal milled sample), the two plots cannot be directly compared.
I~-5.2.2.2
Final Product: UF
4After the full heating cycle, samples were typically light green in color with a visible coating of darker material on the outside of particles and clumps of particles. Interior areas of larger particle clumps contained no brown or black uranium oxides, indicating the oxygen source was most likely external to the bed. For samples prepared in argon, the darker color
was black. The sample prepared in 4% hydrogen had a brown coating. Yields were above
97.8% once carrier gas flow (Appendix E) was lowered to the channelized fluidization regime.
Table 5.6 - Masses and Yields of Fluidized Bed Samples
sample initial mass theoretical UF4 yield actual final mass gross yield
9 9 9 CBY-01 2.8042 1.7248 1.2749 73.9% CBY-02* 2.7958 1.7196 1.3508 78.6% CBY-03 2.857 1.7573 1.5275 86.9% CBY-04' 2.8018 2.3333 2.3036 98.7% CBY-05 2.8218 1.7356 1.6982 97.8% CBY-06 2.814 1.7308 1.72282 99.5%
* Since the high argon flow rate carried a large amount of the sample onto the top flange of the column, the number given here is the sum of both samples CBY-02a (top flange) and CBY-02b (bed).
This sample was an attempt to decompose the sample to its intermediate product at 110 'C. Based on TGA analysis, the intermediate product appears to be (NH4)3UF7, so this value was used instead of that for LF4in calculating theoretical yield.
Final product samples from beds fluidized by both argon and 4% hydrogen in argon were analyzed with a simple TGA heating ramp. Pure UF4 should show only a slight weight