The MIT Faculty has made this article openly available.
Please share
how this access benefits you. Your story matters.
Citation
Richardson, Hilary et al. “Development of the Social Brain from Age
Three to Twelve Years.” Nature Communications 9, 1 (March 2018):
1027 © 2018 The Author(s)
As Published
http://dx.doi.org/10.1038/s41467-018-03399-2
Publisher
Nature Publishing Group
Version
Final published version
Citable link
http://hdl.handle.net/1721.1/115209
Terms of Use
Attribution 4.0 International (CC BY 4.0)
Development of the social brain from age three to
twelve years
Hilary Richardson
1
, Grace Lisandrelli
1
, Alexa Riobueno-Naylor
2
& Rebecca Saxe
1
Human adults recruit distinct networks of brain regions to think about the bodies and minds
of others. This study characterizes the development of these networks, and tests for
rela-tionships between neural development and behavioral changes in reasoning about others’
minds (‘theory of mind’, ToM). A large sample of children (n = 122, 3–12 years), and adults
(n = 33), watched a short movie while undergoing fMRI. The movie highlights the characters’
bodily sensations (often pain) and mental states (beliefs, desires, emotions), and is a feasible
experiment for young children. Here we report three main
findings: (1) ToM and pain
net-works are functionally distinct by age 3 years, (2) functional specialization increases
throughout childhood, and (3) functional maturity of each network is related to increasingly
anti-correlated responses between the networks. Furthermore, the most studied milestone in
ToM development, passing explicit false-belief tasks, does not correspond to discontinuities
in the development of the social brain.
1Department of Brain and Cognitive Sciences, Massachusetts Institute of Technology, Cambridge, MA 02139, USA.2Department of Psychology, Wellesley
College, Wellesley, MA 02481, USA. Correspondence and requests for materials should be addressed to H.R. (email:[email protected])
123456789
O
ver the past decade, fMRI research has made significant
progress identifying functional divisions of labor within
the adult social brain
1. For example, while many areas of
human cortex show elevated responses while looking at, listening
to, or thinking about other people, studies of these cortical
responses suggest a striking division between regions responding
preferentially to internal states of others’ bodies, versus internal
states of others’ minds
2–6. Both bodily sensations, like hunger and
pain, and mental states, like beliefs and desires, are internal states
of other people; both are important for observers’ reasoning about
others’ actions and reactions, to facilitate the observer’s own
prosocial (e.g., helping) or antisocial (e.g., competing) choices. In
spite of these similarities, a robust dissociation between responses
to others’ bodies and minds has been replicated across a wide
range of paradigms: when human adults think about other
peo-ple, our cortical responses are surprisingly dualist
7.
An important extension of this work is to study the emergence
of these functionally specialized brain regions during
develop-ment. The current study investigates the developmental origins of
the cortical dissociation between others’ bodies and minds, and
the links between cortical and cognitive changes in children’s
social development.
Although children’s developing understanding of others’ minds
(their
‘theory of mind’ (ToM)) has been studied intensively
8, we
know very little about the neural changes that support this
development. One cause of this gap in knowledge is that most
behavioral studies on ToM focus on children younger than 5
years old
9,10. For example, one active debate in developmental
psychology concerns children and infants’ ability to reason about
false beliefs
11. Children’s ability to explicitly predict or explain
another person’s actions based on her false beliefs has been
interpreted as depending on a conceptual leap occurring around
age 4 years
12–14. However, recent measures of spontaneous
looking and helping suggest that even toddlers may be sensitive to
others’ false beliefs
15,16. By contrast, fMRI studies of ToM
rea-soning have focused on children older than 5 years old
17–23,
adolescents
24,25, and adults
26–28. Prior neuroimaging studies thus
leave open questions of core interest concerning early stages of
theory of mind development.
Based on theories in developmental psychology, we derive
three predictions for observations in the social brain regions of
young children. First, success on explicit false-belief tasks could
reflect an important conceptual leap or discontinuity in ToM
development, as theories of others’ internal states are dramatically
altered by insight into the representational nature of mental
states
29,30. According to this view, the division between cortical
responses to others’ bodies versus minds might emerge
con-currently with childrens’ explicit understanding of false beliefs.
Second, success on explicit false-belief tasks could reflect
devel-opment in other domain-general brain regions, removing earlier
performance limitations (such as response inhibition and
selec-tion, and production of verbal response)
31–33. According to this
view, spontaneous processing of others’ mental states within
domain-specific regions for ToM might be similar in children
who pass and fail explicit false-belief tasks. Third, success on
explicit false-belief tasks could be a single step in the ongoing
conceptual development of ToM, which begins before—and
continues after–false-belief reasoning
34–37. According to this
view, change within ToM brain regions might occur both before
and after children explicitly reason about false-beliefs. Of course,
these predictions only reflect a subset of those that could be
derived from each theoretical perspective, and are not mutually
exclusive; reality could include a mixture of these three views.
The present study characterizes development of brain regions
recruited for reasoning about others’ minds and bodies, in a large,
cross-sectional sample of children between the ages of 3–12 years
old. These 122 children and a reference group of 33 adults,
watched a short, animated movie that included events evoking the
mental states and physical sensations of the characters, while
undergoing fMRI. Watching this movie is feasible for young
children—it is short, engaging, and does not require learning a
task. This movie has been validated as activating ToM brain
regions and the pain matrix in adults
38. ToM brain regions
include bilateral temporoparietal junction, precuneus, and dorso-,
middle-, and ventromedial prefrontal cortex
26–28. The pain
matrix includes brain regions recruited when perceiving the
physical pain and bodily sensations of others: bilateral medial
frontal gyrus, insula, and secondary sensory cortex, and dorsal
anterior middle cingulate cortex
39. Within both functional
net-works, individual regions have been implicated with specific
functions (for example, insula and cingulate cortex for
nocicep-tive pain
39, and prefrontal cortex for reasoning about emotions
and preferences
40). Here, we collapse across specific functions,
and operationalize ToM and pain networks as regions recruited
generally for reasoning about others’ internal mental and physical
states, respectively
38.
We measured three features of children’s hemodynamic
responses during the movie. First, we conducted inter-region
correlation analyses to test the degree to which ToM and pain
brain regions operate as functionally distinct networks (i.e., high
within-network, and low between-network correlations)
41,42.
Because results suggested that networks for ToM and pain are
distinct even in the youngest children, we used the average
response of each network in the next two analyses. Second, we
measured the magnitude of evoked response, in children, to the
events in the movie that evoke peak responses in adults (identified
by reverse correlation analyses). Third, we measured the
func-tional maturity (i.e., similarity to adults) of each network’s entire
timecourse
43. All child participants additionally completed an
assessment of explicit ToM after the scan, to measure overall
theory of mind reasoning, including performance on explicit
false-belief tasks. We tested whether each of the three neural
measures was related to children’s age, to children’s explicit
performance on ToM tasks, and to one another.
We report evidence that ToM and pain networks are
func-tionally distinct by 3 years of age, and become increasingly
spe-cialized between the ages of 3–12 years. Functional maturity of
each network is related to increasingly anti-correlated responses
between the two networks. Finally, we
find that a distinct neural
response to others’ minds and bodies is present before—and
continues to develop after—children pass explicit false-belief
tasks.
Results
Behavioral results. All children completed a behavioral battery
after completing the fMRI scan, which included a custom-made
explicit ToM task (see Methods)
21. 3- to 5-year-old children (n
=
65) additionally completed a measure of response inhibition
(Dimensional Change Card Sort task (DCCS)
44). Performance on
the ToM task (proportion correct) and DCCS were both
posi-tively correlated with age (ToM (kendall tau correlation test (n
=
122)): r
k(120)
= .66, p < .00001; DCCS (kendall tau correlation
test (n
= 64)): r
k(62)
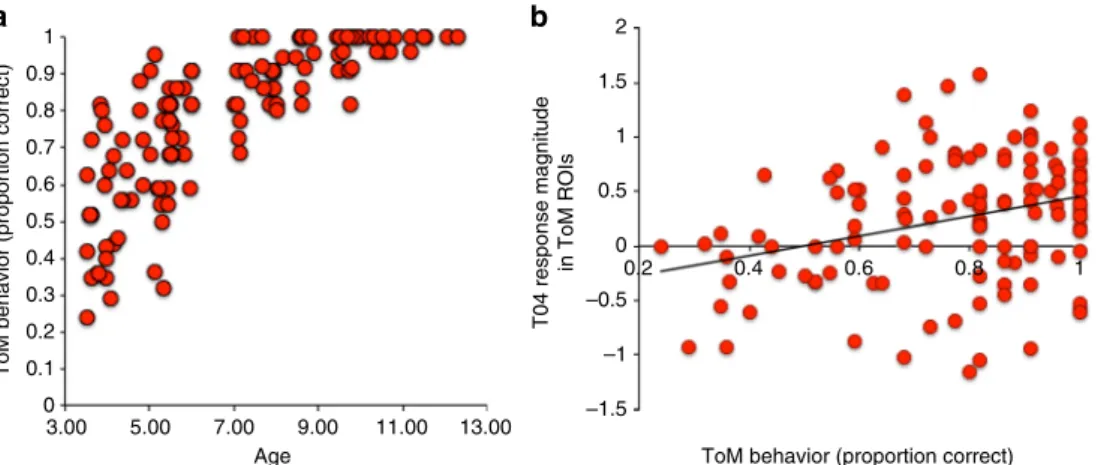
= .20, p = .049); see Fig.
1
a. In the 3-year to
5-year-old subset of children who completed both measures, ToM
and DCCS scores were positively correlated (partial kendall tau
correlation test (n
= 64), controlling for age: r
k(61)
= .19, p
= .03). See Supplementary Table
1
for behavioral data and
par-ticipant demographics.
For 3- to 5-year-old children, an explicit false-belief composite
score was calculated based on responses to six explicit false-belief
questions embedded within the ToM measure; this composite
measure was used to categorize these children as false-belief
passers (5–6 FB questions correct; n = 30 (15 female)),
incon-sistent performers (3–4 FB questions correct; n = 20 (13 female)),
and false-belief failers (0–2 FB questions correct; n = 15 (6
female)). False-belief task failers and inconsistent performers did
worse on the remaining ToM items than passers (Fail M(s.e.)
= .55(.04), Inc M(s.e.) = .57(.03), Pass M(s.e.) = .75(.02); Tukey
Honest Significant Difference (HSD) test of ToM*FB-Group
ANOVA: Pass–Fail: diff = 1.2, p < .00005; Pass-Inc: diff = 1.08, p
< .0001; Inc-Fail: diff
= .16, p = .8; Kruskal–Wallis rank sum test
of ToM*FB-Group (for non-normal distributions; 3 groups: Pass
(n
= 30), Inc (n = 20), Fail (n = 15)): H(2) = 22.96, p < .0001).
False-belief task failers were on average younger than passers and
inconsistent performers (Fail M(s.d.)
= 4.1(.56) years; Inc M(s.d.)
= 4.8(.73) years; Pass M(s.d.) = 5.2(.70) years; Tukey HSD test of
Age*FB-Group ANOVA: Pass–Fail: diff = 1.4, p < .00001;
Inc-Fail: diff
= .83, p = .01; Pass-Inc: diff = .59, p = .047). Similarly,
failers demonstrated worse response inhibition than the other two
groups (DCCS Summary score: Fail M(s.e.)
= 1.73(.21), Inc M(s.
e.)
= 2.26(.17), Pass M(s.e.) = 2.33(.09); Tukey HSD test of
DCCS*FB-Group ANOVA: Pass–Fail: diff = .88, p = .01;
Inc-Fail:
diff
= .78,
p
= .052;
Pass-Inc:
diff
= .1,
p
= .9;
Kruskal–Wallis rank sum test of DCCS*FB-Group (for
non-normal distributions; 3 groups: Pass (n
= 30), Inc (n = 19), Fail
(n
= 15)): H(2) = 7.56, p = .02).
Inter-region correlation analysis. Inter-region correlation
ana-lyses reveal the extent to which a group of brain regions operate
as a network with synchronized responses. We conducted
inter-region correlation analyses (see Methods)
42, in order to test three
hypotheses about the development of ToM and pain brain
regions: (1) that adults exhibit greater within-network
correla-tions and greater anti-correlacorrela-tions between ToM and pain
net-works, compared to children, (2) that by age 3 years, ToM and
pain brain regions operate as specialized networks with
syn-chronized responses, and (3) that maturity of the within-network
and across-network correlations is related to ToM task
perfor-mance in childhood.
In adults, each network exhibited strong positive correlations
within-network, and strong negative correlations across network
(within-ToM correlation M(s.e.)
= .48(.02); within-Pain
correla-tion
M(s.e.)
= .35(.02); across-network M(s.e.) = −.17(.02);
paired sample two-tailed t-tests (n
= 33): within-ToM vs.
across-network: t(32)
= 19.1, p < 2.2 × 10
−16; within-Pain vs.
across-network: t(32)
= 23.2, p < 2.2 × 10
−16). See Methods,
Supplementary Fig.
1
, and Supplementary Table
2
for details
about the regions of interest.
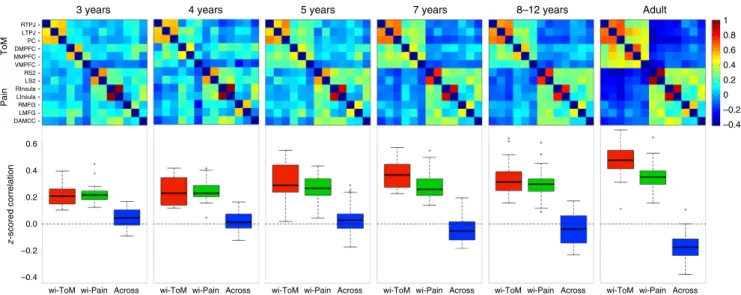
This pattern of network correlations strengthened substantially
between the ages of 3 and 12 years (Fig.
2
; Supplementary Fig.
2
and 3). Among children, within-ToM and within-Pain network
correlations increased significantly with age (Spearman partial
correlation test, including motion (number of artifact timepoints)
as a covariate (n
= 122): within-ToM: r
s(119)
= .37, p < .00005;
within-Pain: r
s(119)
= .28, p = .002). Across-network correlations
decreased significantly with age (Spearman partial correlation
test, including motion as a covariate (n
= 122): r
s(119)
= −.35,
p < .0001). Within and across-network correlations were
signifi-cantly greater in adults, compared to children (linear regression
testing for effects of age group and motion on within-ToM
correlation: effect of group (child (n
= 122) vs. adult (n = 33)):
b
= −.97,
t
= −5.7,
p < 6.2 × 10
−8,
effect
of
motion:
b
= −.3, t = −4.3, p < .0001; linear regression testing for effects
of age group and motion on within-Pain correlation: effect of
group (child (n
= 122) vs. adult (n = 33)): b = −.75, t = −3.8,
p
= .0002, effect of motion: b = −.03, t = −.31, p = .8; linear
regression testing for effects of age group and motion on
across-network correlation: effect of group (child (n
= 122) vs. adult
(n
= 33)): b = 1.26, t = 7.2, p = 2.2 × 10
−11, effect of motion:
b
= .07, t = .94, p = .4). To ensure that developmental changes in
correlation strength were not driven by various aspects of data
quality (such as improved co-registration with age), we conducted
inter-region correlation analyses on face and scene brain regions
as well as bilateral primary motor and visual cortices; see
Supplementary Fig.
3
. These analyses showed that inter-region
correlations in other networks (e.g., the face network and primary
visual areas) do not show age-related change.
Nevertheless, the two networks were already functionally
distinct in the youngest group of children we tested. In
3-year-old children only (n
= 17), both ToM and pain networks had
positive within-network correlations (within-ToM correlation M
(s.e.)
= 21(.02); within-Pain correlation M(s.e.) = .23(.02)).
Within-network correlations were higher than the
across-network correlation (paired sample two-tailed t-tests (n
= 17):
within-ToM vs. across-network: t(16)
= 6.2, p < .00005,
within-Pain vs. across-network: t(16)
= 6.9, p < .00001). By contrast,
unlike adults, ToM and pain networks were not anti-correlated in
3 year olds (across-network correlation M(s.e.)
= .05(.02)).
However, significantly greater within- than across- network
correlations suggests that ToM and pain networks are
function-ally distinct by age 3 years. The strongest within-network
correlations in the 3 year olds were between homologous pairs
T04 response magnitude
in ToM ROIs
ToM behavior (proportion correct)
2 1.5 1 0.5 0 –0.5 –1 –1.5 1 0.9 0.8 0.7 0.6 0.5 0.4 0.3 0.2 0.1 0
Age ToM behavior (proportion correct)
3.00 5.00 7.00 9.00 11.00 13.00
0.2 0.4 0.6 0.8 1
b
a
Fig. 1 Theory of mind behavioral performance. a Theory of mind behavioral performance (proportion correct;yaxis) of all children (n = 122) by age in years
(xaxis). b Average response magnitude in ToM network to peak timepoint of event T04 (Peck returning to Gus, donning protective gear), per child (yaxis),
of regions in opposite hemispheres, such as right and left TPJ
(ToM), and the right and left insula (Pain). These strong
correlations, between pairs of regions that are functionally
homologous but physically distant, suggest that even the data
from 3 year old children are of high enough quality to detect
inter-region correlations when they exist; and therefore that
changes with age in other inter-region correlations reflect real
changes in the functional relationships between those regions.
However, the functional separation of the two networks was not
fully explained by the strong correlations between bilateral pairs
(Within-non-bilateral-ToM
correlation
M(s.e.)
= .20(.02),
Within-non-bilateral-Pain correlation M(s.e.)
= .17(.02); paired
sample two-tailed t-tests (n
= 17): within-non-bilateral-ToM vs.
across-network: t(16)
= 5.1, p = .0001, within-non-bilateral-Pain
vs. across-network: t(16)
= 4.4, p = .0005).
In children, the strength of inter-region correlations within the
ToM network was positively correlated with behavioral
perfor-mance on the ToM battery outside the scanner (Kendall tau
partial correlation test, including motion as a covariate (n
= 122):
r
k(119)
= .23, p = .0002). The anti-correlation of ToM and pain
networks was also correlated with ToM score (Kendall tau partial
correlation test, including motion as a covariate (n
= 122):
r
k(119)
= −.20, p = .001). However, there was no relationship
between within-ToM or across-network correlations and ToM
score when controlling for age in addition to motion (linear
regressions testing for effect ToM score on within-ToM and
across-network correlation, including age and motion as
addi-tional predictors (n
= 122): NS effects of ToM score: ts < 1,
p > .3).
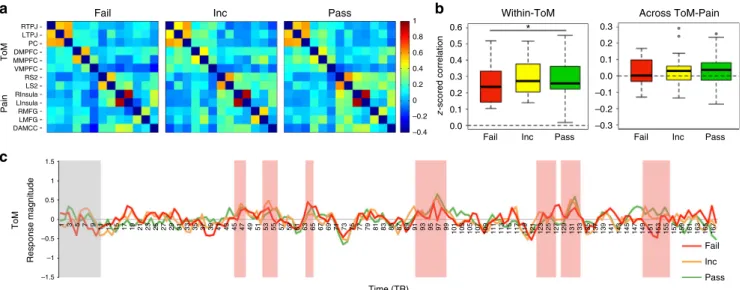
We additionally tested for neural differences based on
performance on explicit false-belief questions, among 3- to
5-year-old children. These questions were a subset of the questions
in the ToM behavioral battery (see Methods). There was a
significant difference in within-ToM network correlation between
explicit false-belief task passers and failers (Within-ToM: Passers
M(s.e.)
= .29(.02), Failers M(s.e.) = .25(.03); linear regression
testing for effects of FB-Group (pass vs. fail), age, and motion
on within-ToM network correlation: effect of FB-Group (pass (n
= 30) vs. fail (n = 15)): b = −.70, t = −2.06, p = .046, effect of
age: b
= .73, t = 4.4, p < .0005, effect of motion: b = −.34, t =
−2.7, p = .009). This group difference becomes marginal when
response inhibition (DCCS summary score) is additionally
included in the regression (effect of FB-Group (pass (n
= 30)
vs. fail (n
= 15)): b = −.64, t = −1.80, p = .079, effect of age:
b
= .74, t = 4.4, p < .0001, effect of motion: b = −.33, t = −2.5,
p
= .02, NS effect of DCCS (response inhibition): b = −.08,
t
= −.59, p = .56). There was no difference in across-network
correlation between these two groups (Passers M(s.e.)
= .04(.02),
Failers M(s.e.)
= .03(.03); linear regression testing for effects of
FB-Group (pass vs. fail), age, and motion on across-network
correlation: NS effect of FB-group (pass (n
= 30) vs. fail (n = 15)):
b
= .51, t = 1.2, p = .23, NS effect of age: b = −.29, t = −1.4,
p
= .16, NS effect of motion: b = −.004, t = −.02, p = .98). See
Fig.
3
a, b.
Reverse correlation analysis. Reverse correlation analyses are
data-driven analyses used to identify events (>4 s) in a continuous
naturalistic stimulus that evokes reliable positive hemodynamic
responses in the same region across subjects
41. Here we
first use
reverse correlation analyses to identify events that drive activity in
ToM and pain brain regions, and subsequently test for
develop-mental change in the magnitude of response to these events in
children. As a
first step, we successfully replicated previous results
that responses in the fusiform gyrus are driven by face stimuli
41;
see Supplementary Fig.
4
. Given these analyses have not yet been
applied to pediatric data, this replication enabled us to be more
confident in our analysis stream, the use of group regions of
interest (ROIs), as opposed to individually defined ROIs, and the
quality of our fMRI data (especially in young children, using a
relatively short movie).
We applied reverse correlation analyses to the average response
timecourses in the ToM network and pain matrix in adult
participants. Because the inter-region correlation analysis
sug-gested that ToM and pain regions comprise two functionally
distinct networks by age three, we calculated the average
timecourse across ROIs within each network. After identifying
events based on the timecourse data from ToM and pain
networks in adults, we extracted the response magnitude of each
event from all child participants (see Methods). This analysis was
used to determine (1) which events in the movie elicit the highest
responses from ToM and pain regions in adults, (2) whether
z -scored correlation Pain ToM 0.6 0.4 0.2 0.0 –0.2 –0.4
wi-ToM wi-Pain Across wi-ToM wi-Pain Across wi-ToM wi-Pain Across wi-ToM wi-Pain Across wi-ToM wi-Pain Across wi-ToM wi-Pain Across
3 years 4 years 5 years 7 years 8–12 years Adult
1 0.8 0.6 0.4 0.2 0 –0.2 –0.4 RTPJ LTPJ PC DMPFC MMPFC VMPFC RS2 LS2 RInsula LInsula RMFG LMFG DAMCC
Fig. 2 Inter-region correlation analysis. Top row: Averagez-scored correlation matrices across all ToM and pain brain regions of interest (see Y-axis) per
age group (3yo:n = 17; 4yo: n = 14; 5yo: n = 34; 7yo: n = 23; 8–12yo: n = 34; adults: n = 33). Regions are in the same order along the X-axes and Y-axes.
Bottom row: boxplots of the within-ToM (red), within-Pain (green), and across-network (blue)z-scored correlation values per age group. Note that while
responses in ToM and pain regions in 3-year-old children are
driven by the same events that drive corresponding responses in
adults, and (3) the extent to which the responses to these events
changes with age or ToM development in childhood.
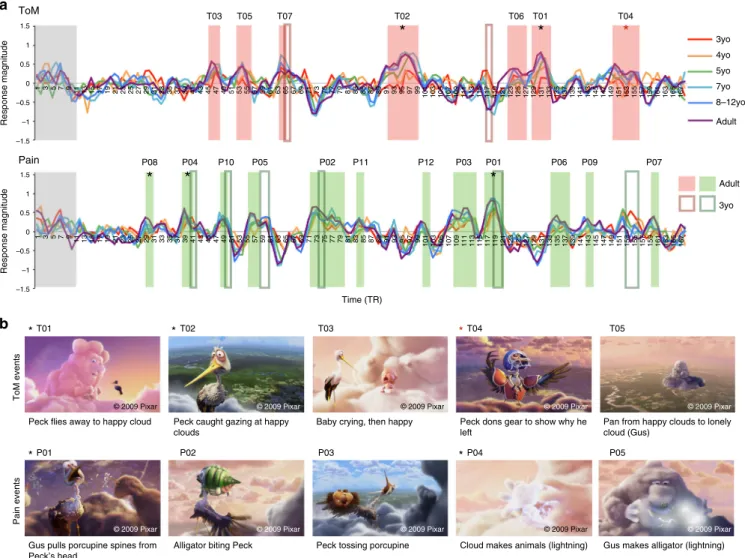
In adults, the reverse correlation analysis produced seven
theory of mind events (68 s total, M(s.d.) length 9.7(4.2) s) and
twelve pain events (86 s total, M(s.d.) length 7.2(4.7)s); see Fig.
4
a.
All seven peak
‘mind’ events depict (changes in) the characters’
beliefs, desires, and/or emotions: e.g., Gus is afraid that Peck will
abandon him, Peck is embarrassed when Gus catches him gazing
at another cloud. A majority of the
‘body’ events (8/12) depict the
characters’ physical pain (e.g., Peck being bitten by a crocodile) or
transformations to the body (e.g. electricity changing a ball of
cloud into a ram). The
five events that have the highest response
magnitude in each network in adults are shown in Fig.
4
b; see
Supplementary Fig.
5
for all events, Supplementary Table
3
for
full descriptions of these events and timing and duration
information, Supplementary Fig.
6
for a replication in an
independent sample of adults, and Supplementary Fig.
7
for
correspondence between these events and previously used
hand-coded events. The timepoints that exceeded baseline for ToM and
pain networks were almost entirely non-overlapping, with the
exception of a single timepoint (2 s). This timepoint is the last
timepoint of event T05, and the
first timepoint of event P05; the
response magnitude of both networks is significantly above
baseline during this timepoint; see Fig.
4
a. This extent of overlap
is significantly less than that that would occur by chance (5/1000
random timecourse permutations with the same number and
duration of ToM and Pain events have at most one timepoint of
overlap; p
= .005), and is present despite not regressing out a
global signal from the timecourses of each network. See
Supplementary Note
1
for a similar overlap analysis between
face and ToM, and face and pain, events. These results converge
with previous evidence for a similar functional division when
participants read short verbal narratives, or when participants
endogenously shift their attention to bodily versus mentalistic
aspects of one movie or picture
2–5,38.
The average timecourse in ToM and pain regions in children
was highly correlated with that of adults (pearson correlation tests
between adult average timecourse and child average timecourse,
TRs 11:168, for each child age bin: ToM: 3yo: r
= .28, 4yo: r = .31,
5yo: r
= .60, 7yo: r = .72, 8–12yo: r = .82 (all p < .0005;
Bonfer-roni correction for multiple comparisons
α = .01, for five age
bins); Pain: 3yo: r
= .60, 4yo: r = .56, 5yo: r = .73, 7yo: r = .83,
8–12yo: r = .89 (all p < 1.0 × 10
−13;
α = .01); see Supplementary
Table
4
). Nevertheless, we observed evidence of developmental
change. Among children, three pain events (P01, P04, P08) and
two ToM events (T01, T02) evoked significantly greater responses
with age (spearman partial correlation tests, including motion as
a covariate (n
= 122); Pain: p < .002, r
ss > .29; ToM: p < .0026, r
ss
> .28; Bonferroni correction for multiple comparisons
α = .0026,
correcting for 19 events/tests). The two ToM events that showed
greater responses with age are longer events that involve multiple
and more complicated mental states (Supplementary Table
3
).
Responses in ToM regions during a third ToM event (T04) were
significantly positively correlated with ToM score, controlling for
age and motion (linear regression testing for effects of ToM score,
age, and motion on T04 response magnitude (n
= 122): effect of
ToM score: b
= .4, t = 2.98, p = .0035, NS effect of age: b = −.14,
t
= −.99, p = .32, NS effect of motion: b = −.07, t = −.77, p
= .45; MC α = .007, correcting for 7 ToM events/tests); see
Fig.
1
b. Response magnitude during ToM events did not differ
significantly between children who pass and fail explicit
false-belief tasks (all p > .08; linear regressions testing for effects of
FB-Group (pass (n
= 30) vs. fail (n = 15)), including age and motion
as covariates); see Fig.
3
c.
We next examined just the youngest children. As reported
above, the overall timecourse of each network in 3 year olds (n
=
17) was highly correlated with the average adult timecourses
(pearson correlation test between adult average timecourse and
average 3 year old timecourse, TRs 11:168: ToM: r
= .28 p
= .00046; Pain: r = .60, p < 1.0 × 10
−15). Reverse correlation
analysis conducted on the 3 year olds’ data alone identified 4 of
the 12 pain events and 1 of the 7 ToM events discovered in the
Pain ToM RTPJ PC LTPJ DMPFC MMPFC VMPFC RS2 LS2 RInsula LInsula RMFG LMFG DAMCC
Fail Inc Pass Within-ToM
ToM Time (TR) Across ToM-Pain 1 0.8 0.6 * 0.5 0.4 0.3 0.2 0.1 0.0 Fail Fail Inc Inc Pass Pass
Fail Inc Pass
z -scored correlation 0.3 0.2 0.1 0.0 –0.1 –0.2 –0.3 0.6 0.4 0.2 0 –0.2 –0.4 Response magnitude 1 3 5 7 9 11 13 15 17 19 21 23 25 27 29 31 33 35 37 39 41 43 45 47 49 51 53 55 57 59 61 63 65 67 69 71 73 75 77 79 81 83 85 87 89 91 93 95 97 99 101 103 105 107 109 111 113 115 117 119 121 123 125 127 129 131 133 135 137 139 141 143 145 147 149 151 153 155 157 159 161 163 165 167 1.5 1 0.5 0 –0.5 –1 –1.5
b
a
c
Fig. 3 Similar functional responses in children who pass and fail explicit false-belief tasks. a Averagez-scored correlation matrices for three to 5-year-old
children who pass (n = 30), fail (n = 15), or perform inconsistently on (n = 20) explicit false-belief tasks. Regions are in the same order along the x-axes
andy-axes. b Boxplots of z-scored correlation values within-ToM and across-ToM-Pain brain regions, based on false-belief task performance. Asterisk
denotes a significant effect of false-belief task group (pass vs. fail) in a linear regression that also includes age and amount of motion (number of artifact
timepoints) as covariates (p < .05); this group effect becomes marginal when additionally including a measure of response inhibition (DCCS). c Average
timecourse of response in the ToM network for false-belief passers (green), failers (red), and inconsistent performers (orange), during viewing of‘Partly
adult sample. These events correspond to a subset of the
timepoints that were identified as ToM or pain events in 3 year
olds (Pain: 14/32 s, ToM: 4/8 s). Interestingly, 8 of the remaining
18 s identified as a pain event in 3-year-old children corresponds
to a ToM event (T04) in adults, and the remaining 4 s identified
as a ToM event corresponds to a pain event (P01) in adults
(Fig.
4
). The remaining 10 s identified as pain events occurred
immediately after adult pain event timepoints.
Relating functional maturity to inter-region correlations. We
tested whether the functional maturity (i.e., similarity to adults) of
a child’s movie-driven timecourse was related to the inter-region
correlations measuring the child’s network properties. Functional
maturity was quantified by correlating each child’s timecourse
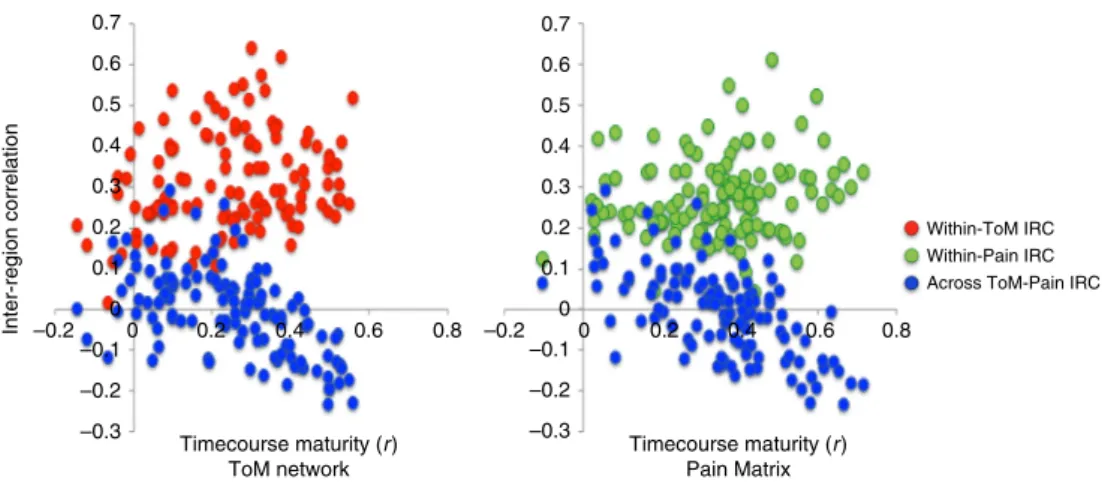
with the average adult timecourse. We found that the maturity of
the movie-driven timecourse in both ToM and Pain networks was
predicted by the anti-correlation of regions across networks
(linear
regressions
testing
for
effects
of
across-network
correlation, within-network correlation, age, and motion on
functional maturity measure (n
= 122): ToM: effect of
across-network correlation: b
= −.4, t = −5.5, p = 2.2 × 10
−7, NS effect
of within-ToM correlation: b
= .1, t = 1.5, p = .14, effect of age:
b
= .4, t = 5.3, p = 5.7 × 10
−7, NS effect of motion: b
= −.1,
t
= −1.5, p = .14; Pain: effect of across-network correlation:
b
= −.51, t = −7.4, p = 2.8 × 10
−11, NS effect of within-Pain
correlation: b
= .13, t = 1.9, p = .06, effect of age: b = .3, t = 4.6,
p
= 1.3 × 10
−5, NS effect of motion: b
= −.08, t = −1.3, p = .2);
see Fig.
5
.
That is, for children whose regions across the two networks
showed more distinct responses, the average response within each
network to the movie was more adult-like. This same pattern did
not hold for within-network correlations. Greater within-network
correlations were strongly associated with age, but not with
timecourse maturity (linear regressions testing for effects of
timecourse maturity, age, and motion on within-network
correlations (n
= 122): ToM: NS effect of functional maturity:
Response magnitude
Response magnitude
ToM T03
T01
* *T02 *
© 2009 Pixar © 2009 Pixar © 2009 Pixar © 2009 Pixar © 2009 Pixar
© 2009 Pixar © 2009 Pixar © 2009 Pixar © 2009 Pixar © 2009 Pixar
T03 T04 T05
P01
Peck flies away to happy cloud Peck caught gazing at happy clouds
Baby crying, then happy Peck dons gear to show why he left
Pan from happy clouds to lonely cloud (Gus)
Gus pulls porcupine spines from Peck’s head
Alligator biting Peck Peck tossing porcupine Cloud makes animals (lightning) Gus makes alligator (lightning)
ToM events Pain events * P02 P03 *P04 P05 P08
*
P04*
P10 P05 P02 P11 Time (TR) P12 P03 P01*
P06 P09 P07 T05 T07 T02*
T06 T01*
T04*
3yo 4yo 5yo 7yo 3yo 8–12yo Adult Adult Pain 1.5 1 0.5 0 –0.5 –1 –1.5 1.5 1 0.5 0 –0.5 –1 –1.5 1 3 5 7 9 11 13 15 17 19 21 23 25 27 29 31 33 35 37 39 41 43 45 47 49 51 53 55 57 59 61 63 65 67 69 71 73 75 77 79 81 83 85 87 89 91 93 95 97 99 101 103 105 107 109 111 113 115 117 119 121 123 125 127 129 131 133 135 137 139 141 143 145 147 149 151 153 155 157 159 161 163 165 167 1 3 5 7 9 11 13 15 17 19 21 23 25 27 29 31 33 35 37 39 41 43 45 47 49 51 53 55 57 59 61 63 65 67 69 71 73 75 77 79 81 83 85 87 89 91 93 95 97 99 101 103 105 107 109 111 113 115 117 119 121 123 125 127 129 131 133 135 137 139 141 143 145 147 149 151 153 155 157 159 161 163 165 167a
b
Fig. 4 Reverse Correlation Analysis. a The average timecourse per age group for the ToM network (top) and Pain matrix (bottom), during viewing of‘Partly
Cloudy’61. Each timepoint along thex-axis corresponds to a single TR (2 s); the entire movie was 168 TRs (<6 min). Shaded blocks show timepoints
identified as ToM (red) and Pain (green) events in a reverse correlation analysis conducted on adults (n = 33); timepoints within the gray block correspond
to the opening logos of the movie and were not analyzed. Dark red and green borders show timepoints identified as ToM and pain events, respectively, in
3-year-old children (n = 17). Event labels (e.g., T01, P01) indicate ranking of average magnitude of response in adults. Asterisks indicate significant positive
correlations between peak magnitude of response and age (continuous variable; black) and ToM behavioral score (continuous variable; red), after
correcting for multiple comparisons (age: 19 ToM/Pain events,α = .0026; ToM: 7 ToM events, α = .007). b Example frames and descriptions for the five
events with the highest magnitude of response in adults, per network (see Supplementary Fig.5for all events, Supplementary Table3for fuller event
descriptions and timing and duration information, and Supplementary Fig.6for a replication in an independent sample of adults). Images ©2009 Pixar,
b
= .05, t = .48, p = .63, effect of age: b = .3, t = 2.5, p = .01, effect
of motion: b
= −.3, t = −3.56, p = .0005; Pain: NS effect of
functional maturity: b
= .07, t = .61, p = .55, marginal effect of
age: b
= .2, t = 1.96, p = .05, NS effect of motion: b = −.005,
t
= −.05, p = .96). Additionally, while having an adult-like ToM
timecourse was positively correlated with ToM behavior
(spear-man partial correlation test, including motion as a covariate (n
=
122): r
s(119)
= .54, p = 1.3 × 10
−10), this relationship did not
remain significant in a regression including age as an additional
predictor (linear regression testing for effects of age, ToM score,
and motion on functional maturity of ToM timecourse (n
= 122):
effect of Age: b
= .5, t = 4.2, p < .00005, NS effect of ToM score: b
= .1, t = 1.2, p = .3, effect of motion: b = −.15, t = −2.1, p = .04).
Functional maturity of the ToM timecourse did not differ based
on explicit false-belief task performance (linear regression testing
for effects of FB-Group (pass vs. fail), age, and motion on
functional maturity of ToM timecourse: NS effect of group (pass
(n
= 30) vs. fail (n = 15)): b = −.12, t = −.35, p = .73, effect of
age: b
= .49, t = 2.9, p = .005, effect of motion: b = −.43,
t
= −3.4, p = .002). Thus, among children, having functionally
mature, task-driven responses is predicted by a child’s
anti-correlated responses in regions of the ToM and Pain networks.
Discussion
Children’s brains and their cognitive abilities undergo dramatic
development in early childhood. In social cognition, for example,
young children develop a remarkably sophisticated
under-standing of others’ desires, thoughts and emotions, as distinct
from their bodily reflexes, pains, and illnesses; much of this
development occurs before children begin formal schooling at 6
years old
45–47. Although brain regions involved in ToM have
been extensively studied in adults, adolescents, and older
chil-dren, fMRI experiments present serious obstacles for very young
children. By using a short, engaging and naturalistic movie
sti-mulus, we were able to collect functional data from a large
sample of children (n
= 122), including 65 children between 3
and 6 years of age. The movie stimulus, Pixar’s ‘Partly Cloudy,’
depicts multiple events that focus on two aspects of the main
characters (a cloud named Gus, and his stork friend Peck): their
bodily sensations (often physical pain) and their mental states
(beliefs, desires, and emotions). We measure developmental
change in cortical networks recruited for reasoning about bodies
(the pain matrix) and minds (the theory of mind network), and
relate development in the ToM network to behavioral changes in
theory of mind—bridging the gap between previous fMRI studies
in older children, and a large behavioral literature on early ToM
development.
The
first goal of this project was to measure developmental
change in the pain matrix and theory of mind network. A key
result emerged from multiple different analysis approaches: a core
aspect of development in the social brain is the differentiation of
spontaneous cortical responses to depictions of others’ bodies
versus minds. First, anti-correlations between the ToM and pain
networks showed particularly dramatic change with age: regions
in these two networks were uncorrelated in 3 year olds, but
robustly correlated in older children and adults. This
anti-correlation predicted the maturity (i.e., similarity to adults) of
each network’s timecourse of response evoked by the movie.
Second, while activity in ToM and pain networks in adults is
driven by non-overlapping mentalistic and bodily events,
respectively, in 3 year olds some events led to increased activity in
the opposite network: the adult pain event P01 elicited activity in
the ToM network, and the adult ToM event T04 elicited activity
in the pain network of 3-year-old children. These results are in
line with previous evidence that functionally selective brain
regions
respond
less
to
non-preferred
categories
with
age,
20,21,48,49and suggest that development of functionally
spe-cialized brain regions for reasoning about others’ internal states
involves increasingly accurate application of specific neural
resources (i.e., distinct groups of brain regions) to specific inputs
(events depicting others’ mental states versus physical sensations).
Almost all previous publications of timecourse data in young
children describe analyses of resting state data: fMRI data
col-lected while participants are not performing any particular
cog-nitive task, or in some cases, while participants are asleep
50. One
advantage of measuring inter-region correlations during a movie,
as we did here, is that children’s psychological state (e.g.,
atten-tion, anxiety, alertness) is likely more similar, across ages. On the
other hand, a disadvantage is that we cannot distinguish between
intrinsic and task-driven contributions to the inter-region
cor-relations
51. For example, the development of anti-correlations
between ToM and pain networks may reflect a combination of
both intrinsic changes in network structure, and increasing
functional selectivity of the movie-driven response in individual
regions
52. Future studies could tease apart contributions of
intrinsic and task-driven connectivity by collecting both
resting-state and functional task data from the same child; however, for
3-year-old children any additional data collection within a session
would be challenging.
The second goal of this project was to ask how change in the
ToM network relates to children’s theory of mind cognitive
0.7 0.6 0.5 0.4 0.3 0.2 0.1 0 –0.1 –0.2 –0.3 0.7 0.6 0.5 0.4 0.3 0.2 Inter-region correlation 0.2 0.4 0.6 0.8 0.1 0 0 0.2 0.4 0.6 0.8 Within-ToM IRC Within-Pain IRC Across ToM-Pain IRC 0 –0.1 –0.2 –0.2 –0.2 –0.3 Timecourse maturity (r) ToM network Timecourse maturity (r) Pain Matrix
Fig. 5 Relating functional maturity to inter-region correlations. In both networks, timecourse maturity (i.e., how correlated each child’s timecourse is to the
average adult timecourse (pearson’s r), x-axis) is predicted by the extent to which the responses in ToM and Pain networks are anti-correlated (z-scored
abilities. All children were asked questions about other people’s
actions, beliefs, desires, expectations, and moral blameworthiness.
Within this set of questions, six questions focused specifically on
predicting and explaining actions based on false beliefs. The
transition from failure to success on the false-belief task has
sometimes been interpreted as evidence of discontinuity in
development around age 4 years: the emergence of a new theory,
or cognitive mechanism, that did not exist earlier
12–14. A second
possibility is that changes in executive function (e.g., response
inhibition) unmask children’s previously existing ToM
31–33. A
third possibility is that children’s theory of mind itself undergoes
continuous and gradual development, from relatively simple
concepts of perceptions and goals in 2 year olds to a sophisticated
understanding of negligence and irony in early adolescence
34– 37,53. Each of these possibilities makes different predictions for
the patterns of neural data we measured here. Unlike any
pre-vious fMRI study of ToM, our sample included a substantial
number of children who systematically failed explicit false-belief
tests. This enabled us to test for signatures of neural responses
that predict improved performance on false-beliefs tasks, in
addition to ToM reasoning more generally.
Our data were most inconsistent with the prediction of a
robust discontinuity in response, associated with the transition
from failure to success on explicit false-belief tasks. In the profiles
of neural responses, we saw no major discontinuity when children
begin to systematically pass false-belief tasks. Brain regions
involved in ToM in adulthood already constitute a distinct
net-work in 3-year-old children, which gradually becomes more
integrated and distinct from other networks over the next decade.
Similarly, the timecourse of response in the ToM network in
response to a social movie is strongly positively correlated, even
between 3 year olds and adults. The timecourse and peak event
responses show gradual continuous development over childhood.
Focusing specifically on 3- to 5-year-old children, the neural
responses to social movies in children who systematically fail
versus pass explicit false-belief tasks were similar: there were no
differences in the magnitude of response to the seven ToM events
identified using reverse correlation analyses, and no difference in
the extent of anti-correlation of the responses in ToM and pain
networks. Consistent with recent evidence that false-belief passers
have increased structural connectivity between ToM brain
regions, compared to failers
54, we
find that passing false-belief
tasks was associated with increased functional correlations among
regions in the ToM network, but this group difference became
marginal when taking response inhibition abilities into account,
and the same neural measure was also associated with age in the
full sample.
Our data were partially consistent with the prediction that
spontaneous processing of others’ mental states within
domain-specific regions for ToM is similar, regardless of performance on
explicit false-belief tasks. Research in adults suggests that the
same ToM brain regions are recruited to reason about mental
state content, regardless of whether the stimulus is verbal or
nonverbal, instructed or spontaneous
19,38,55,56. Spontaneously
generating mentalistic descriptions of actions is a precursor of
performance on explicit tasks
57, and is correlated with cortical
thinning of ToM regions in adults
58. In the current study,
3-year-old children who systematically fail false-belief tasks nevertheless
recruited ToM brain regions at similar times in the movie and as
a distinct network from the pain matrix. On the other hand, we
did observe significant change within ToM brain regions, and in
the dissociation between ToM and pain networks, which is not
predicted by the view that explicit ToM tasks measure change in
domain general performance limitations.
Overall, our results seem most consistent with the prediction
that a distinct neural response to others' minds versus bodies is
already beginning to develop well before children explicitly pass
false-belief tasks, and continues to develop well after
7,8,47. For
example, for one event in the movie, the magnitude of response in
the ToM network correlated with the child’s score on the full
ToM battery (not limited to false belief items). This event (T04)
shows Peck donning protective football gear in front of Gus. In
context, this event depicts Gus revising previous beliefs and
emotions (because Gus believed that Peck had abandoned him,
Gus had been furious and devastated; once Peck shows Gus the
helmet and pads, Gus realizes that Peck has not abandoned him
and indeed never intended to abandon him, and Gus feels happy
and relieved). Increased activity in ToM regions during this event
may reflect children’s improved ability to consider the relevance
of the current event for (past) beliefs or emotions that are not
explicitly depicted
59.
These fMRI results are thus consistent with evidence in
developmental psychology for slow, continuous development of
theory of mind. In individual children, the transition from failing
to passing explicit false-belief tasks occurs gradually and noisily:
children who begin to answer explicit false-belief questions
cor-rectly often subsequently fall back to incorrect responses
57.
Improvement is boosted by explicit explanatory practice and
feedback over a relatively long period of time. The noisiness of
development is visible in the current dataset: twenty children
answered three or four out of six explicit false-belief questions
correctly, within a single testing session. Also, mastering explicit
false-belief tasks is not equivalent to having a fully mature theory
of mind
60; older children are still learning to infer hidden
emo-tions
34, discriminate degrees of moral blameworthiness
53, and
understand non-literal speech like sarcasm and irony
37. On this
view false-belief task performance is likely just one step along a
long trajectory of increasingly sophisticated understanding of
other minds.
In sum, we report evidence that when people spontaneously
watch an animated movie evoking the internal states of others,
distinct networks of cortical regions are recruited for events that
make salient internal states of the mind versus of the body. These
networks are already functionally distinct in 3-year-old children,
but show increasing within-network and decreasing
across-network
correlations
throughout
childhood.
The
anti-correlation of the two networks strongly predicts the maturity
of each network, in response to the movie. Specific peak events
within the movie evoke activity that increases with age, and with
theory of mind reasoning ability. On the other hand, the most
famous milestone in ToM behavioral development, passing
explicit false-belief tasks, does not correspond with a
dis-continuity in the neural basis for reasoning about the minds of
others.
Methods
Participants. One hundred twenty two 3.5–12-year-old children (M(s.d.) = 6.7
(2.3); 64 females) participated in the study. 110 children were right-handed and 3 were ambidextrous (as indicated by parent or legal guardian). This sample includes
65 children under the age of 6 years (M(s.d.)= 4.82(.81) years; 34 females; 54 RH/3
Ambi); this subset of children were used to test for neural differences between
children who pass (n= 30; M(s.d.) = 5.2(.70); 15 females; 26 RH/2 Ambi) and fail
(n= 15; M(s.d.) = 4.08(.56); 6 females; 11 RH/4 LH) false-belief tasks. Twenty
children in this subset responded inconsistently to false-belief tasks (M(s.d.)= 4.75
(.73); 13 female; 17 RH/1 Ambi). An additional 19 children were recruited to participate and excluded from all analyses for not completing or participating in
the study (n= 12), language delays (n = 2), and excessive motion during the fMRI
scan (n= 5; see fMRI Data Analysis for details). Thirty three adult participants
(ages 18–39 years; M(s.d.) = 24.8(5.3); 20 females; 32 RH/1 LH) additionally participated in the fMRI portion of the study. Child and adult participants were recruited from the local community. All adult participants gave written consent; parent/guardian consent and child assent was received for all child participants. Recruitment and experiment protocols were approved by the Committee on the Use of Humans as Experimental Subjects (COUHES) at the Massachusetts Institute of Technology.
fMRI stimuli. Participants watched a silent version of‘Partly Cloudy,’61, a 5.6-min
animated movie38. A short description of the plot can be found online (https://
www.pixar.com/partly-cloudy#partly-cloudy-1). Previous research suggests that pediatric populations move significantly less during fMRI scans using movie
sti-muli62. The stimulus was preceded by 10 s of rest, and participants were instructed
to watch the movie and remain still. Participants agedfive and older completed
additional tasks prior to viewing this stimulus; these tasks largely involved listening to (children) or reading (adults) stories.
fMRI data acquisition. Prior to the scan, child participants completed a mock scan in order to become acclimated to the scanner environment and sounds, and to learn how to stay still. Children were given the option to hold a large stuffed animal
during the fMRI scan in order to feel calm and to preventfidgeting. An
experi-menter stood by child participants’ feet, near the entrance of the MRI bore, to
ensure that the participant remained awake and attentive to the movie. If this experimenter noticed participant movement, she placed her hand gently on the
participant’s leg, as a reminder to stay still.
Whole-brain structural and functional MRI data were acquired on a 3-Tesla Siemens Tim Trio scanner located at the Athinoula A. Martinos Imaging Center at MIT. Children under age 5 years used one of two custom 32-channel phased-array
head coils made for younger (n= 3, M(s.d.) = 3.91(.42) years) or older (n = 28, M
(s.d.)= 4.07(.42) years) children63; all other participants used the standard Siemens
32-channel head coil. T1-weighted structural images were collected in 176 interleaved sagittal slices with 1 mm isotropic voxels (GRAPPA parallel imaging, acceleration factor of 3; adult coil: FOV: 256 mm; kid coils: FOV: 192 mm). Functional data were collected with a gradient-echo EPI sequence sensitive to Blood Oxygen Level Dependent (BOLD) contrast in 32 interleaved near-axial slices aligned with the anterior/posterior commissure, and covering the whole brain (EPI
factor: 64; TR: 2 s, TE: 30 ms,flip angle: 90°). As participants were initially recruited
for different studies, there are small differences in voxel size and slice gaps across
participants (3.13 mm isotropic with no slice gap (n= 5 adults, n = 3 7yos, n = 20
8–12yo); 3.13 mm isotropic with 10% slice gap (n = 28 adults), 3 mm isotropic with
20% slice gap (n= 1 3yo, n = 3 4yo, n = 2 7yo, n = 1 9yo); 3 mm isotropic with
10% slice gap (all remaining participants)); all functional data were subsequently upsampled in normalized space to 2 mm isotropic voxels. Prospective acquisition correction was used to adjust the positions of the gradients based on the
participant’s head motion one TR back64. 168 volumes were acquired in each run;
children under agefive completed two functional runs, while older participants
completed only one run. For consistency across participants, only thefirst run of
data was analyzed. Four dummy scans were collected to allow for steady-state magnetization.
fMRI data analysis. FMRI data were analyzed using SPM8 (http://www.fil.ion.ucl.
ac.uk/spm)65and custom software written in Matlab and R. Functional images
were registered to thefirst image of the run; that image was registered to each
participant’s anatomical image, and each participant’s anatomical image was normalized to the Montreal Neurological Institute (MNI) template. This enabled us to use group regions of interest (ROIs) and hypothesis spaces created in adult data sets, and to directly compare responses between child and adult participants. Previous research has suggested that anatomical differences between children as young as 7 years are small relative to the resolution of fMRI data, which supports usage of a common space between adults and children of this age (for similar
procedures with children under age seven, see refs21,66,67; for methodological
considerations, see ref.68). Registration of each individual’s brain to the MNI
template was visually inspected, including checking the match of the cortical envelope and internal features like the AC–PC and major sulci. All data were
smoothed using a Gaussianfilter (5 mm kernel).
Artifact timepoints were identified via the ART toolbox (https://www.nitrc.org/
projects/artifact_detect/)69as timepoints for which there was (1) >2 mm composite
motion relative to the previous timepoint or (2) afluctuation in global signal that
exceeded a threshold of three s.d. from the mean global signal. Participants were
dropped if one-third or more of the timepoints collected were identified as artifact
timepoints; this resulted in droppingfive child participants from the sample (see
Participants). Number of artifact timepoints differed significantly between child
and adult participants (Child (n= 122): M(s.d.) = 10.5(10.6), Adult (n = 33): M(s.
d.)= 2.8(4), Welch two-sample t-test: t(137.7) = 6.49, p < .000001). Among
children, number of motion artifact timepoints was not correlated with age
(spearman correlation test (n= 122): rs(120)= .02, p = .86) or ToM score (kendall
tau correlation test (n= 122): rk(120)= −.005, p = .94). Number of artifact
timepoints did not differ between young (3–5-year old) children based on false-belief task performance (linear regression tests for effect of FB-Group on number
of motion artifact timepoints: NS effect of FB-group (Pass (n= 30) vs. Fail (n =
15)): b= −.04, t = −.12, p = .9; NS effect of FB-group (Pass (n = 30), Inc (n = 20),
or Fail (n= 15)): b < .05, p > .9) or response inhibition (linear regression test for
effect of DCCS on number of motion artifact timepoints (n= 64): NS effect of
DCCS summary score: b= .16, t = 1.18, p = .25). See Supplementary Fig.8for
visualization of the amount of motion per age group. Despite amount of motion being matched across children, and therefore likely not driving developmental effects within the child sample, we include number of motion artifact timepoints as a covariate in all analyses. Number of artifact timepoints is highly correlated with
measures of mean translation, rotation, and distance (r > .8). Because this measure is not normally distributed, spearman correlations were used when including amount of motion as a covariate in partial correlations.
Region of interest (ROI) analyses were conducted using group ROIs. ToM and
pain matrix group ROIs were created in an independent group of adults (n= 20),
scanned by Evelina Fedorenko and colleagues. These data were preprocessed and analyzed with procedures identical to those used for participants in the current study. Reverse correlation analyses were conducted in this separate group of adults, using 10 mm group ROIs surrounding peaks reported in previous publications
(ToM regions70; Pain matrix71). Seven ToM and nine pain events were identified
(ToM: 60 s total, M(s.d.) length: 8.6(4.6)s, Pain: 66 s total, M(s.d.) length: 7.3(4.4)s). We subsequently used a general-linear model to analyze BOLD activity of these participants as a function of condition, using these events. Second-level random effects analyses were used to examine the group-level response to Mental > Pain
and Pain > Mental (p < .001, k= 10, uncorrected). We then drew 9 mm spheres
surrounding the peak activation in each region, to create new group ROIs that were
tailored to the stimulus, but defined in an independent sample of adults (see
Supplementary Fig.1and Supplementary Table2for more information on all
group ROIs, and Supplementary Fig.7for details of the convergence between
events across the two adult samples and ROIs).
All timecourse analyses were conducted by extracting the preprocessed timecourse from each voxel per group ROI. We applied nearest neighbor interpolation over artifact timepoints (for methodological considerations on
interpolating over artifacts before applying temporalfilters, see refs72,73), and
regressed out two kinds of nuisance covariates to reduce the influence of motion
artifacts: (1) motion artifact timepoints; and (2)five principle component analysis
(PCA)-based noise regressors generated using CompCor within individual subject
white matter masks74. White matter masks were eroded by two voxels in each
direction, in order to avoid partial voluming with cortex. CompCor regressors were
defined using scrubbed data (e.g., artifact timepoints were identified and
interpolated over prior to running CompCor).
For inter-region correlation analyses only, we additionally regressed out the raw timecourse extracted from bilateral primary motor cortex (M1). Primary motor cortex ROIs were 10 mm spheres drawn around peak coordinates generated with
Neurosynth (http://neurosynth.org/; search term:“primary motor,” forward
inference from 273 studies; coordinates: [38,−24,58], [−38,−20,58]). These ROIs are included in the expanded inter-region correlation analysis shown in
Supplementary Fig.4; the bilateral M1 timecourse was not regressed out for this
supplemental analysis. However, because this analysis showed that the within-M1 inter-region correlation increases with age among children, we regressed the bilateral M1 timecourse from the ToM and Pain timecourses for the inter-region correlation analyses reported in the main text, to ensure that the age effects in the ToM and pain networks are above and beyond developmental effects present in regions like primary motor cortex, and that within-network correlations are not falsely inflated by commonalities in signal fluctuation across the brain.
The residual timecourses were then high-passfiltered with a cutoff of 100 s.
Timecourses from all voxels within an ROI were averaged, creating one timecourse per group ROI, and artifact timepoints were subsequently excluded (NaNed).
In inter-region correlation analyses, each ROI timecourse was correlated with
every other ROI’s timecourse, per subject, and these correlation values were
Fisher z-transformed. Within-ToM correlations were the average correlation from each ToM ROI to every other ToM ROI, within-Pain correlations were the average correlation from each Pain ROI to every other Pain ROI, and across-network correlations were the average correlation from each ToM ROI to each
Pain ROI. This procedure is similar to that used by ref.42. In order to test for
developmental change in within-network and across-network correlations, we
conducted linear regressions to test for (1) significant differences between adults
and children, in regressions that included group (child vs. adult) and number of artifact timepoints as predictors, (2) significant effects of age (as a continuous variable), ToM performance, and number of artifact timepoints among children, and (3) significant group differences between children who pass and fail explicit false-belief tasks, including number of artifact timepoints and age as predictors. In order to test whether ToM and pain networks are coherent and specialized early in childhood, we used t-tests to compare within-network versus
across-network correlations in 3-year-old children (n= 17). Within-network and
across-network correlation measures were normally distributed (p > .22,
one-sample Kolmogorov–Smirnov tests), and variance in within-ToM, within-Pain,
and across-network correlations did not differ across children and adults, or
false-belief passers vs. failers (F-tests to compare two variances: children (n=
122) vs. adults (n= 33): F(32,121) > 1.1, p > .66; pass (n = 30) vs. fail (n = 15): F
(14,29) > .78, p > .65).
Initial reverse correlation analyses were conducted on adult participants only. Each ROI timecourse was z-normalized, and timecourses within each network were averaged across ROIs, resulting in one timecourse for face regions, ToM regions,
and the pain matrix per adult participant. Except for thefirst 10 timepoints (5 TRs
rest, followed by 5 TRs of the movie introduction (Disney castle and Pixar logos)), the residual signal values across adult subjects for each timepoint were tested against baseline (0) using a one-tailed t-test. This procedure is similar to that used
by41. Events were defined as two or more consecutive significantly positive
timepoints within each network. Events were rank-ordered according to the average magnitude of response to the peak timepoint in adults, and labeled