HAL Id: hal-03065045
https://hal.archives-ouvertes.fr/hal-03065045
Submitted on 14 Dec 2020HAL is a multi-disciplinary open access archive for the deposit and dissemination of sci-entific research documents, whether they are
pub-L’archive ouverte pluridisciplinaire HAL, est destinée au dépôt et à la diffusion de documents scientifiques de niveau recherche, publiés ou non,
Phytobeneficial Bacteria Improve Saline Stress
Tolerance in Vicia faba and modulate microbial
interaction network
Loubna Benidire, Fatima Khalloufi, Khalid Oufdou, Mohamed Barakat, Joris
Tulumello, Philippe Ortet, Thierry Heulin, Wafa Achouak
To cite this version:
Loubna Benidire, Fatima Khalloufi, Khalid Oufdou, Mohamed Barakat, Joris Tulumello, et al.. Phy-tobeneficial Bacteria Improve Saline Stress Tolerance in Vicia faba and modulate microbial interaction network. Science of the Total Environment, Elsevier, 2020. �hal-03065045�
Phytobeneficial Bacteria Improve Saline Stress Tolerance in Vicia
1
faba and modulate microbial interaction network
2
Loubna Benidire 1,2,3, Fatima El Khalloufi 1,2,4, Khalid Oufdou 2, Mohamed Barakat1, Joris 3
Tulumello1,5, Philippe Ortet1, Thierry Heulin1 and Wafa Achouak1* 4
5
1
Aix-Marseille Univ, CEA, CNRS, UMR7265, LEMiRE, Laboratory of Microbial Ecology of the
6
Rhizosphere, ECCOREV FR 3098, F-13108 Saint Paul Lez Durance, France.
7
2
Laboratory of Microbial Biotechnologies, Agrosciences and Environment (BioMAgE), Faculty
8
of Sciences Semlalia, Cadi Ayyad University, Marrakech, Morocco.
9
3
High School of Technology Laayoune, Ibn Zohr University, Morocco.
10
4
Laboratory of Chemistry, Modeling and Environmental Sciences, Polydisciplinary Faculty of
11
Khouribga, Sultan Moulay Slimane University, Beni Mellal, B.P.: 145, 25000, Khouribga,
12
Morocco
13
5
Biointrant,
SAS BioIntrant - 84120 Pertuis
14
* Correspondence:
15
Wafa Achouak; [email protected]; Tel: + 33 4 42 25 49 61; Fax: + 33 4 42 25 66 48 16
Running title: Phytobeneficial Bacteria Improve Saline Stress Tolerance 17
Key words: Vicia faba, Phytobeneficial Bacteria, Saline Stress, Rhizosphere, Microbiota, 18
Microbial network
Abstract
20
Increased global warming, caused by climate change and human activities, will seriously 21
hinder plant development, such as increasing salt concentrations in soils, which will limit 22
water availability for plants. To ensure optimal plant growth under such changing conditions, 23
microorganisms that improve plant growth and health must be integrated into agricultural 24
practices. In the present work, we examined the fate of Vicia faba microbiota structure and 25
interaction network upon inoculation with plant-nodulating rhizobia (Rhizobium 26
leguminosarum RhOF125) and non-nodulating strains (Paenibacillus mucilaginosus BLA7 and
27
Ensifer meliloti RhOL1) in the presence (or absence) of saline stress. Inoculated strains
28
significantly improved plant tolerance to saline stress, suggesting either a direct or indirect 29
effect on the plant response to such stress. To determine the structure of microbiota 30
associated with V. faba, samples of the root-adhering soil (RAS), and the root tissues of 31
seedlings inoculated (or not) with equal population size of RhOF125, BLA7 and RhOL1 strains 32
and grown in the presence (or absence) of salt, were used to profile the microbial 33
composition by 16S ribosomal RNA gene sequencing. The inoculation did not show a 34
significant impact on the composition of the root microbiota or the root-adhering soil 35
microbiota. The saline stress shifted the RAS microbiota composition, which correlated with 36
a decrease in Enterobacteriaceae and an increase in Sphingobacterium, Chryseobacterium, 37
Stenotrophomonas, Agrobacterium and Sinorhizobium. When the microbiota of roots and
38
RAS are considered together, the interaction networks for each treatment are quite different 39
and display different key populations involved in community assembly. These findings 40
indicate that upon seed inoculation, community interaction networks rather than their 41
functions and thus on their ability to express the genes required to help plants tolerate 44
stresses. 45
1. Introduction
47
The soil microbial community is fundamental to soil organic matter turnover, nutrient cycling 48
and plant productivity preservation (Haichar et al., 2014). This central role illustrates the 49
importance of the microbial response to environmental stresses such as salinity, 50
temperature and water deficit. Stressors such as salinity can disrupt the microbiota structure 51
by decreasing the activity of surviving microorganisms, due to the energy required for the 52
induction of stress tolerance mechanisms, and the inactivation of sensitive bacteria (Schimel 53
et al., 2007). In a hot and dry climate, when water deficiency and salinity occur at the same
54
time, they represent a significant threat to the soil microbiota. The same is true for crop 55
productivity thereby directly challenging human nutrition. Soils are considered saline when 56
the electrical conductivity (EC)e reaches or exceeds 4 dS/m, which is equivalent to
57
approximately 40 mM NaCl and results in an osmotic pressure of 0.2 MPa (Munns and 58
Tester, 2008). As a result, around the world, 100 Mha (5 % of arable land) of agricultural land 59
are affected by salt at a level that causes osmotic stress, reducing agricultural production 60
(Lambers, 2003) and promoting land erosion and eutrophication of waterways (Chowdhury 61
et al., 2011).
62
Excessive salt concentrations in the rhizosphere remove water from the roots, consequently 63
impeding plant growth. The effect of salinity on variation in microbial community has been 64
studied in saline aquatic ecosystems (Benlloch et al., 2002; Crump et al., 2004; Mesbah et 65
al., 2007; Bodaker et al., 2010), whereas few reports have examined the effects of salinity on
66
the soil microbial community (Rath et al, 2016, 2019a, 2019b), particularly in the rhizosphere 67
(Caton, 2004; Walsh et al., 2005). 68
Microbiota is believed to provide the host with adaptive capacities that influence its 69
physiology and improve its fitness (Zilber-Rosenberg and Rosenberg, 2008). The rhizosphere 70
microbiota may play an important role in plant nutrition and protection against biotic and 71
abiotic stresses. However, certain stresses may severely alter plant development, thus 72
requiring the integration of plant-beneficial microorganisms into agricultural practices to 73
enhance plant growth and stress tolerance. Numerous studies have been devoted to 74
experiments describing crop inoculation with PGPR (plant growth-promoting rhizobacteria) 75
as a means of improving plant growth or providing protection against pathogens. Increasing 76
soil salinity is an environmental concern for global agriculture (Coleman-Derr and Tringe, 77
2014), and yet very little is known about the effect of plant root-associated microbiota on 78
the ability of plants to withstand saline stress (and their effect on restoring plant growth). 79
Therefore, we have focused our study on the plant V. faba, which is cultivated in several 80
countries around the world. Specifically, we investigated the potential of phytobeneficial 81
bacteria inoculation to improve plant tolerance to saline stress, and we have evaluated the 82
impact of saline stress and bacterial inoculation (alone or in combination) on the rhizosphere 83
microbiota assemblage and interaction network. 84
Material and methods 85
1.1. Biological material
86
Three bacterial strains were used, BLA7 identified in the present study by 16S rRNA gene 87
sequencing, Rhizobium leguminosarum RhOF125 (Benidire et al., 2017), and Ensifer meliloti 88
(formerly Sinorhizobium meliloti) RhOL9 strain (El Khalloufi et al., 2011, 2013). BLA7 and 89
V. faba cultivated in the region of Marrakech Haouz (Morocco), and RhOL9 strain was
91
isolated from root nodules of local Medicago sativa plants collected from the Marrakech 92
region. We identified the strain BLA7 by 16S rRNA gene sequencing (Supplementary data). 93
The seeds used in this study were a commercial variety of V. faba (Alfia 5). Seeds were 94
surface disinfected with hypochlorite (1.8 % NaClO) and aseptically germinated on sterile 95
sand incubated in the dark at room temperature for 4 days. 96
97
1.2. Experimental design
98
The evaluation of the effect of salinity stress on soil bacterial diversity was conducted in 99
polyethylene bags filled with agricultural soil collected from Aït Ourir (Marrakech region, 100
Morocco). 101
Pre-germinated V. faba seeds were co-inoculated with the three strains: RhOF125, RhOL9 102
and BLA7. Experiments were conducted in four replicates for biomass measurements and in 103
triplicates for 16S rRNA metabarcoding analyses. The inocula were prepared by culturing the 104
bacteria in a liquid mannitol yeast extract medium (Vincent, 1970) at a cell density of 105
approximately of 109 colony-forming units (cfu) mL-1. The experiment was performed in 106
plastic bags containing 5 kg of soil with a density of two plants per bag, and the cultivation 107
was conducted under natural conditions. After appearance of the first leaves, bags were 108
exposed, in each irrigation, to NaCl stress at a concentration of 70 mM; control bags were 109
irrigated with sterile distilled water. 110
successive washes with sterile ultrapure water. The root homogenates and root-adhering 113
soil suspensions were then centrifuged (9,000 rpm for 15 min), and the resulting pellets 114
were retained until DNA extraction. Each replicate corresponds to two pooled seedlings. The 115
roots analysed per replicate come from two seedlings, as does the root-adhering soil. The 116
fresh weight of the shoots was measured after recovery of the roots for DNA extraction. 117
1.3. DNA extraction
118
Total DNA was extracted from 36 samples including, bulk soil, root-adhering soil (RAS) and 119
root tissue samples. Sterile glass beads were added to tubes containing TE (Tris-EDTA) buffer 120
and roots, root-adhering soil samples or bulk soil (36 samples). Thereafter, each material 121
was ground into a homogeneous sample with a Mixer Mill (MM200, Retsch Technology). 122
These experiments are conducted in triplicates. Total DNA was extracted directly from 123
homogenates using TE buffer with the addition of proteinase K (20 mg/mL), lysozyme (10 124
mg/mL), SDS (10 %) and sarkosyl. After heating and shaking at 50 °C for 1 h in an incubator, 125
the samples were treated with phenol/chloroform/isoamyl alcohol (25:24:1, pH 8), briefly 126
mixed, and centrifuged 1 h at 4 °C. The supernatant was then transferred to sterile tubes 127
filled with chloroform/isoamyl alcohol (24:1), mixed, and centrifuged for 1 min at 4 °C. 128
Subsequently, the aqueous phase was collected. DNA was precipitated overnight using 129
absolute isopropanol at room temperature, pelleted by centrifugation (5,000 rpm for 20 min 130
at 4°C), washed in 70 % ethanol, dried for 1 h in a SpeedVac (Thermo Fisher Scientific), and 131
eluted in 250 µL TE buffer. All extracted crude DNA were first loaded onto PVPP-columns 132
(1000×g, 10 min, 10 °C) as described by Petric et al. (2011) and then purified using the 133
1.4. PCR procedure, bioinformatics, and statistical analysis
136
The 16S rRNA gene V4-V6 variable region PCR primers 530F/1100R were used for PCR 137
amplification as previously described (El Khalloufi et al., 2016). Sequencing was performed at 138
MR DNA (www.mrdnalab.com; Shallowater, TX, USA) using Roche 454 FLX titanium 139
instruments following the manufacturer’s guidelines Sequencing data were processed with 140
QIIME version 1.8 (Caporaso et al., 2010). Sequences were trimmed of barcodes and 141
primers, and the short sequences (< 150 bp), and the ambiguous sequences were removed. 142
The Operational Taxonomic Units (OTUs) were then defined by clustering at 97 % similarity. 143
The OTUs were classified taxonomically using Blast (Altschul et al., 1990) and grouped into 144
each taxonomic level into “counts” and “percentage” files. The phylogenetic position of 145
bacteria in the different samples was characterised using taxa summary QIIME script until 146
genus level (L6). OTU tables were rarefied at the lowest sequencing depth to control 147
sequencing depth. OTU richness, diversity index and rarefaction curves were determined on 148
a random picking of an equal sequence number in each sample (10,451 reads per sample) 149
from the 36 samples through sequencing analysis by using the pipeline QIIME (Caporaso et 150
al., 2010). After quality control trimming, a total of 238,757 sequences were generated from 151
36 samples and utilized for analysis. The average length of the sequences after processing 152
was 400 bp for all samples. The clean sequences were clustered into OTUs at 97 % similarity 153
levels (excluding the unclassified sequences at the phylum level), and sequences classified as 154
chloroplast or cyanobacteria were also removed. The bulk soil, root-adhering soil and root 155
tissues respectively displayed averages of 227, 242 OTUs and 372 OTUs, at 3 % divergence. 156
All statistical analyses were conducted using R version 3.1 (R Core Team, 2016). Unless 157
otherwise specified, we determined statistical significance at = 0.05. PCoA and CAP 158
analyses were conducted using the capscale function. PERMANOVA was conducted using the 159
adonis function and Bray-Curtis dissimilarities were calculated using the vegdist function all 160
from the Vegan package (Dixon, 2003). 161
The core microbiota was determined by plotting OTU abundance in the core at 5 % intervals 162
(from 50 % to 100 % of samples) using QIIME. 163
We analyzed bacterial networks for control, inoculation, and salinity treatments separately. 164
All network analyses were performed in R, using the package igraph, as in Williams et al. 165
(2014). Interactions consisted of Spearman’s rank correlations and co-occurrence networks 166
were constructed using only significant correlations (p < 0.05 as in Barberan et al., 2012) of ρ 167
> 0.8. Random networks were constructed as in Williams et al. (2014). Thereafter, we 168
detected network modules using the cluster_edge_betweenness and modularity functions 169
and calculated clustering coefficients using the transitivity function. We analyzed the 170
centrality of network nodes using the betweenness function, and analyzed the 171
connectedness of network nodes using the degree function. All bacterial networks were 172
significantly more clustered than random networks. 173
Sequence data are available in NCBI SRA bank under accession number SRR5883473, 174
experiment SRX3049495. 175
2. Results
177
2.1. Integrating phytobeneficial bacteria improves plant tolerance to saline stress
178
V. faba plants were grown in the presence or absence of NaCl 70 mM and inoculated with
179
three bacterial strains, the exopolysaccharide (EPS)-producing Paenibacillus mucilaginosus 180
BLA7 strain (99% identity), the V. faba -nodulating Rhizobium leguminosarum RhOF125 181
strain, and the non-nodulating E. meliloti RhOL9 strain. We observed nodulation of V. faba 182
inoculated with R. leguminosarum RhOF125, whereas E. meliloti RhOL9 and P. mucilaginosus 183
BLA7 were supposed to colonize the rhizoplane and the rhizosphere (root-adhering soil). 184
The impact of salt and bacterial inoculation on plant growth was evaluated (Fig. 1). After 30 185
days of salt treatment, the growth parameters, represented as fresh weight of the plant, 186
clearly indicate the adverse effect of salinity on V. faba growth, as the fresh matter of shoots 187
decreased significantly (p < 0.05) under 70 mM NaCl treatment (-40 %). In contrast, plants 188
that were inoculated with the mixt inoculation of RhOF125, RhOL9 and BLA7 strains were 189
less impacted by saline stress and displayed a decrease in fresh shoot weight of only 20 %. 190
Bacterial inoculation significantly mitigated the effect of salt on plant growth, as shoot 191
biomass was significantly higher when plants were inoculated (Fig. 1). 192
To determine whether the beneficial effect of plant inoculation is directly related to bacterial 193
inoculation or indirectly via the modulation of the root-associated microbiota after 194
inoculation, we investigated the composition of the microbial community in the rhizosphere 195
and in the roots of V. faba. 196
2.2. V. faba rhizosphere and root-associated microbiota
197
The diversity of the rhizosphere of V. faba microbiota was moderate as very few bacterial 198
phyla were presented, such as Proteobacteria, Bacteroidetes, and Actinobacteria. The root-199
adhering soil was mainly inhabited by very high proportion of Enterobacteriaceae (66 %) and 200
Sphingobacteriaceae (20 %), whereas the roots hosted mainly Rhizobiaceae (55 %) and 201
Streptomycetaceae (14 %). 202
The dominant phyla represented by the 165 identified genera were Proteobacteria (78 203
genera), Actinobacteria (43 genera), and Bacteroidetes (17 genera). The 12 most dominant 204
genera in each compartment are reported in Table 1. 205
Phylogenetic analysis of the two compartments (root tissues vs root-adhering soil) showed 206
the presence of 26 bacterial families, with a predominance of families belonging to 207
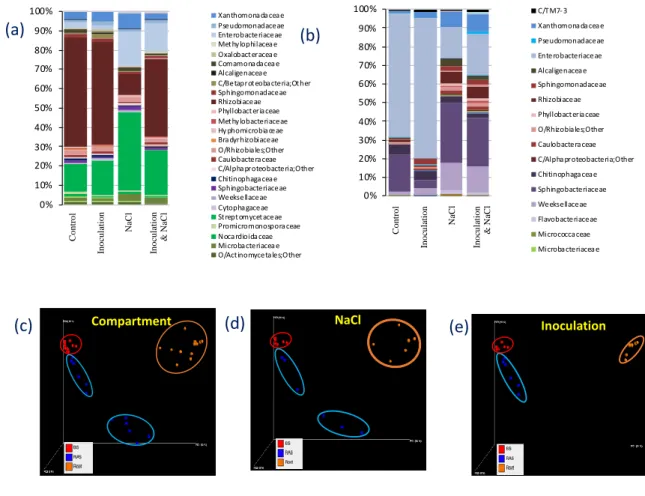
Proteobacteria (> 70 %) compared to other phyla (Fig. 2a and 2b). In the root tissue samples, 208
the three dominant phyla were Proteobacteria, Actinobacteria and Bacteroidetes, with 209
relative abundances of 75 %, 21 % and 3 %, respectively (Fig. 2a). Root-adhering soil samples 210
hosted mainly Proteobacteria (71 %) and Bacteroidetes (27 %) (Fig. 2b). At the class level, 211
members of Gammaproteobacteria represented the most abundant group of Proteobacteria 212
in root-adhering soil compartments (67 %), followed by several members of 213
Alphaproteobacteria (3 %). In contrast, root tissues were mainly colonized by 214
Alphaproteobacteria (63 %). 215
2.3 Salinity and co-inoculation impact on V. faba rhizosphere and root-associated
216
microbiota
To evaluate the contribution of the microbiota assemblage to the plant tolerance to saline 218
stress, we surveyed the bacterial diversity of bulk soil, root-adhering soil compartment, and 219
root tissues of V. faba plants grown in the presence and absence of salt (70 mM). 220
To visualize the effect of inoculation and saline stress on microbial community modulation in 221
our data, we used principal coordinates analysis (PCoA) in combination with permutational 222
multivariate analysis of variance (PERMANOVA) on Bray-Curtis dissimilarities between the 223
samples. Consistent with our previous results (Haichar et al., 2008, El Khalloufi et al., 2016, 224
Bressan et al., 2009), this analysis revealed significant differences between the microbiota of 225
the bulk soil, and that of root-adhering soil and root tissues, denoting the rhizosphere effect 226
and the selection of specific populations from the surrounding soil by the roots (Fig. 2c, R2 = 227
0.28, p < 0.001). Another observation from the PCoA analysis was that RAS samples 228
clustered closer towards the bulk soil samples than did the root samples. 229
Considering the saline stress, the samples of RAS are clustered in two groups (inoculated vs 230
non-inoculated) and the one of RT in a single one (Fig. 2d, R2 = 0.20, p < 0.004, 231
perMANOVA). 232
The effect of bacterial inoculation on the microbiota associated to the RT and RAS samples 233
of V. faba is the same in presence or absence of saline stress, as all the samples of RT are 234
grouped tightly together, and the same for the RAS data (Fig. 2e). 235
Tolerance to saline stress could be linked to shifts in bacterial community composition in the 236
root-adhering soil that correlate with an increase of plant salt tolerance. These changes 237
could be considered as good indicators of a relationship between mitigation of saline stress 238
and community composition. The LEfSe (Linear discriminant analysis Effect Size) analysis 239
LDA score > 2.0. We examined which OTUs differentiate the microbiota of salt-stressed 241
plants from those without stress by surveying which bacterial groups have significantly 242
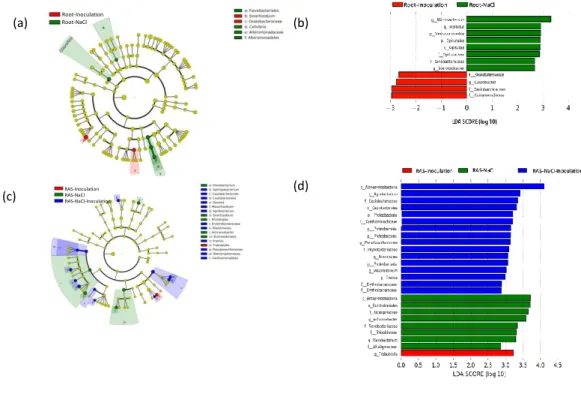
different relative abundances. The roots of inoculated seedlings were specifically colonized 243
by bacteria belonging to Betaproteobacteria (Oxalobacteraceae and Comamonadaceae) and 244
to Alphaproteobacteria (Caulobacter), while under saline stress, the roots specifically 245
recruited bacteria belonging to Verrucomicrobia (Opitutus), Gammaproteobacteria 246
(Steroidobacter and Sinobacteraceae) and Actinobacteria (Microbacterium) (Fig. 3a and 3b). 247
The RAS compartment was more impacted, as inoculation induced a selection of bacteria 248
belonging to Gammaproteobacteria (Trabusiella), while saline stress induced a selection of 249
bacteria belonging to Betaproteobacteria (Burkholderiales, Alcaligenaceae and 250
Achromobatcter) and Alphaproteobacteria (Rhizobiaceae). When inoculated plants were 251
submitted to saline stress, the root-adhering soil hosted specifically Alphaproteobacteria 252
(Agrobacterium, Caulobacterales, Mesorhizobium, Pyllobacteriaceae and 253
Erythrobacteraceae) and to Gammaproteobacteria (Arenimonas, Erwinia,
254
Pseudoxanthomonas) (Fig. 3c and 3d).
255
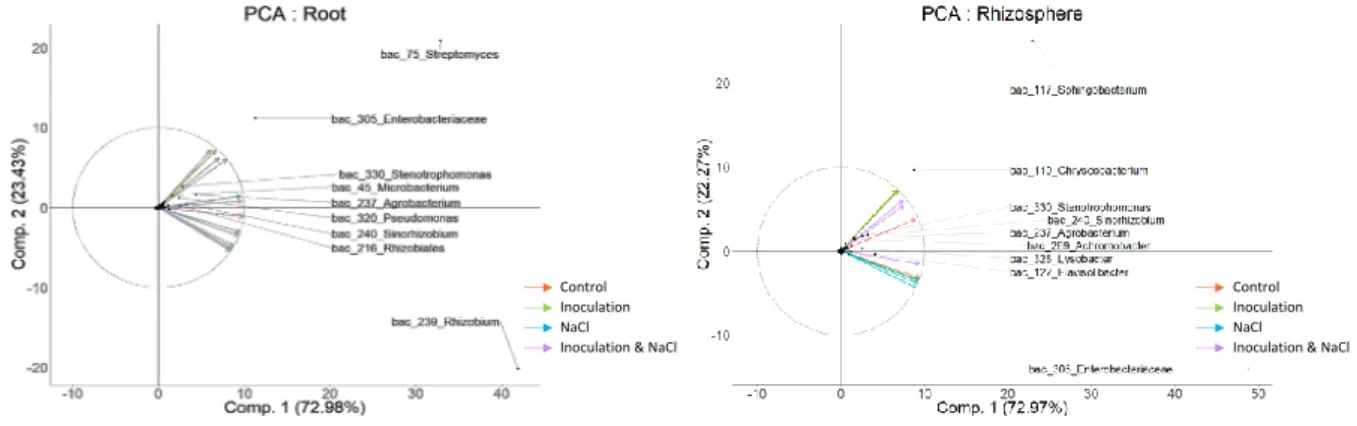
These modulations of microbial composition were complemented by principal components 256
of the principal component analysis (PCA) illustrating the relative ordination of the various 257
treatments based on the relative abundance of OTUs. On root system, NaCl treatment 258
and/or bacterial inoculation led to an increase in the proportion of some taxa. Specifically, 259
the proportion of organisms belonging to Enterobacteriaceae, Streptomycetaceae, 260
Pseudomonadaceae, Xanthomonadaceae and Microbacteriaceae was increased when 261
compared to the control. In contrast, salinity had a negative effect on Rhizobiaceae 262
roots of inoculated seedlings recruited mainly bacteria of the genus Streptomyces and 264
Enterobacteriaceae and surprisingly bacteria of the genus rhizobium are less abundant at the 265
level of the inoculated roots, suggesting that probably the inoculated rhizobia are 266
preferentially established at the rhizosphere level. In the RAS compartment, analyses at the 267
family level revealed a significant decrease in the proportion of Enterobacteriaceae in 268
uninoculated seedlings following saline treatment. The RAS of inoculated seedlings, in the 269
presence and absence of saline stress, are particularly colonized by members of the phylum 270
of Bacteroidetes (Sphingobacterium and Chryseobacterium) (Fig. 4b). Therefore, these OTUs 271
are probably involved in plant tolerance to salt. saline stress had less impact on community 272
structure in the RAS when the seedlings were inoculated. 273
2.4 Salinity and co-inoculation impact on V. faba rhizosphere and root-associated microbial
274
interaction
275
The co-occurrence or co-exclusion patterns of bacterial groups in the RAS and root 276
compartments in response to inoculation, saline stress or both, were investigated and 277
compared by network analysis (Fig. 5a). OTUs with a large number of positive and negative 278
interactions indicating their importance in shaping bacterial groups are named hubs (Agler et 279
al., 2016; Layeghifard et al., 2017). The shape of bacterial network of the different
280
treatments was distinctly different and more importantly hubs were quite different (Fig. 5b). 281
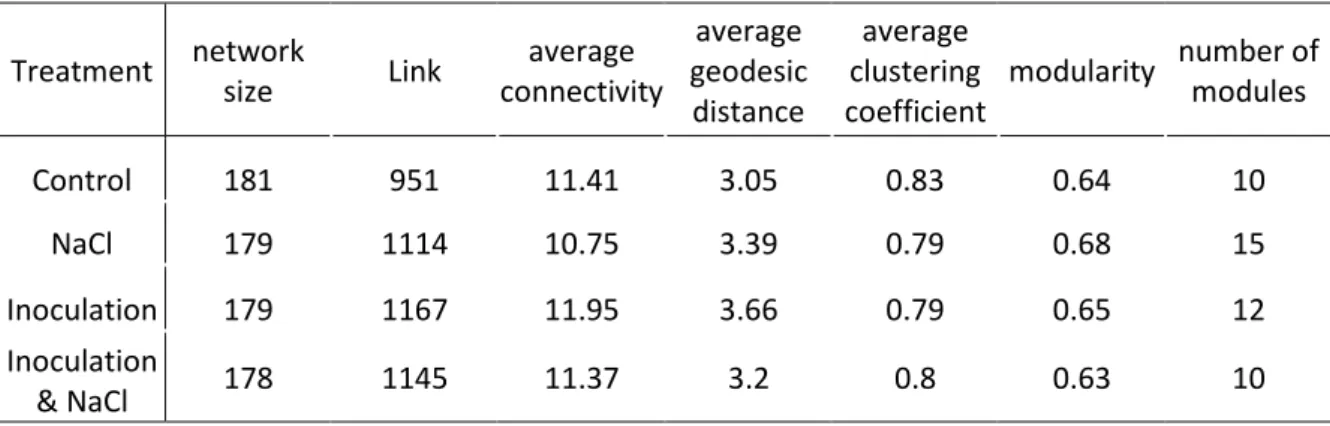
Although the network size is not significantly different between the different treatments, the 282
number of modules determined by the phylogenetic molecular ecological networks ranged 283
from 10 for control to 15 for NaCl treatment, indicating that the meta-community network 284
was dominated by Gammaproteobacteria which are highly reduced in abundance in the 287
presence of salinity whether the plant is inoculated or not (Fig. 6a). The most abundant 288
OTUs are not highly connected to the other members of microbial community, as nods are 289
mainly represented by members of Alphaproteobacteria and Actinobacteria (Fig. 6a and 6b). 290
Therefore, hubs are primarily represented by alphaproteobacteria and actinobacteria, 291
indicating the importance of these bacterial groups in the microbial assemblage, except 292
under saline stress in uninoculated plants, where members of alphaproteobacteria are not 293
represented as hubs (Fig. 6c). We also notice that the proportion of hubs that are members 294
of Actinobacteria is significantly reduced in inoculated plants in the presence and absence of 295
saline stress (Fig. 6c). Venn diagrams shows that a high proportion of OTUs and nods are 296
shared by all treatments (Fig. 6d and 6e). However, only very few hubs are common to all 297
treatments (Fig. 6f). The relative number of positive (green) and negative (red) interactions 298
indicated for each hub in each treatment, shows that the different hubs are mainly involved 299
in co-occurrence interactions, and very few co-exclusion interactions are found (Fig. 6g). 300
Some shared hubs behaved differently such as Sinorhizobium, which in the absence of saline 301
stress displayed mostly negative interactions, while in the presence of saline stress and 302
bacterial inoculation, it was mainly involved in positive interactions (Fig. 6g). We can also 303
observe that the Gemm-5 OTU is essentially involved in co-exclusion interactions in the 304
absence and presence of saline stress, whereas in the concomitant presence of saline stress 305
and bacterial inoculcation, this hub presents only co-occurrence interactions (Fig. 6g). 306
3. Discussion
(especially bacterial species with beneficial effects on plant growth and health) into 310
agricultural practices (Busby et al., 2017). Microbial inoculants are considered to be 311
environmentally friendly, and could provide a sustainable alternative technology for solving 312
agro-environmental issues. Specifically, beneficial microbes can improve crop productivity to 313
increase or support plant growth, nutrient availability and uptake, and plant fitness (Glick, 314
2014), thereby reducing the use of chemical fertilizers. The use of beneficial rhizobacteria 315
(PGPR) to improve plant growth and yield under saline stress has been extensively 316
investigated. It is acknowledged that bio-inoculation can increase tolerance, adaptation and 317
protection of plants against salinity stress (Hashem et al., 1998; Fasciglione et al., 2012; 318
Munns and Gilliham, 2015; Upadhyay and Singh, 2015; Qin et al., 2016). Indeed, an increase 319
in plant biomass and the stimulation of root growth (allowing the enhanced uptake of 320
nutrient elements and consequently alleviate the effects of saline stress in different legume 321
species) has been attributed to different rhizobial strains that can establish a symbiotic 322
association under saline stress conditions (Nogales et al., 2002; Bertrand et al., 2015). In 323
addition, inoculation of maize plants with P. fluorescens containing ACC deaminase has been 324
reported to significantly enhance root elongation and plant biomass under saline conditions 325
(Kausar and Shahzad, 2006). Although most studies have focused primarily on changes in the 326
physiological and metabolic status of plants after inoculation with plant growth promoting 327
rhizobacteria (PGPR), a limited number of reports have investigated the effects of 328
inoculation on the diversity of soil microbial communities (Gupta et al., 2014; Chihaoui et al., 329
2015; Bharti et al., 2016). We have examined here the effect of a combined application of 330
three selected bioinoculants (the V. faba-nodulating R. leguminosarum RhOF125, E. meliloti 331
As expected, our glasshouse experiment revealed the positive effects of the PGPR 334
bioinoculants on the growth of V. faba plants. Specifically, we observed with 70 mM NaCl 335
treatment that shoot fresh matter was significantly increased (p<0.05) after bacterial 336
inoculation (mix of three strains) as compared to the control. These differences are thought 337
to be related to direct effects of PGPR in enhancing plant growth, as well as non-target 338
effects of bioinoculants on resident bacterial populations in the V. faba rhizosphere and 339
roots. In the present study, the relative abundance profiles suggested a shift in the bacterial 340
community composition of the inoculated plants in comparison with the initial bacterial 341
diversity, especially in the root-adhering soil compartment. 342
Rarefaction curves of the RAS compartment vary according to the treatments applied, 343
showing that salinity and bacterial inoculation increase the level of richness in this 344
compartment more than in the root tissues (Fig. S1). In RAS samples, an increase in bacterial 345
species richness was observed in response to salinity stress (and bacterial inoculation to a 346
lesser extent). It can be hypothesized that salinity stress has induced a decrease in the 347
population size of the dominant bacterial species, allowing access to a greater number of 348
sub-dominant species. A similar result was reported in the rhizosphere of halophytic plant 349
species, in which salt remarkably promoted the richness diversity of microbial communities 350
(Borruso et al., 2014; Yang et al., 2016). However, other authors have reported contrasting 351
results, indicating a significant decrease in species diversity and richness in high saline 352
rhizosphere soil (Nelson and Mele, 2007; Ibekwe et al., 2017). As observed in this work, 353
inoculation appears to enhance the number of observed OTUs in RAS samples. Interestingly, 354
inoculation of Phaseolus vulgaris with Agrobacterium sp. 10C2 is reported to increase the 355
the present work, the rarefaction curves of roots microbiota displayed similar trends for all 357
samples, suggesting that the total species richness was weakly affected by salinity and 358
bacterial inoculation. 359
The bacterial diversity analysis of RAS and root tissues compartments at the phylum level 360
revealed the presence of 26 bacterial phyla, predominantly represented by Proteobacteria, 361
Actinobacteria and Bacteroidetes. This generally agrees with numerous previous reports 362
showing that these are the most common groups in different agricultural systems or other 363
soil types, based on pyrosequencing surveys (Haichar et al., 2008; Lauber et al., 2009; Blasiak 364
et al., 2014; El Khalloufi et al., 2016; Yaish et al., 2016). Nevertheless, each of the dominant
365
phyla exhibited differences in average abundance level between the two studied 366
compartments (root tissue and RAS). Members belonging to the Bacteroidetes phylum are 367
reported to be widespread in numerous different ecosystems, where they can function in 368
the degradation of polymeric organic matter (Fierer et al., 2007; Thomas et al., 2011). 369
Bacteroidetes species have also been observed as the dominant phylum living in the 370
rhizosphere and proximal to the soil surface (Martínez-Alonso et al., 2010). Actinobacterial 371
species are well known as members of the plant rhizosphere, but they also have a critical 372
role in the decomposition of complex biopolymers (e.g. lignocellulose, keratin, and chitin) 373
(Sykes and Skinner, 1973; Li et al., 2016). 374
We used PCoA analysis to evaluate the main driver of bacterial diversity in response to 375
inoculation, salt or both. Among the selected variables, the compartment (RAS vs root 376
tissue), inoculation and saline stress, the latter was found to be the main driver of microbial 377
also by creating a safer environment for the root-colonizing beneficial microbiota, probably 380
via root exudation.It has been suggested that such an effect might be due to root exudation
381
of specific molecules responsible for chemotactic attraction of specific bacterial populations 382
in the rhizosphere from the soil reservoir (Borruso et al., 2014). Additionally, Trabelsi et al. 383
(2011) found that in Phaseolus vulgaris, rhizobacterial populations of Alphaproteobacteria 384
(Rhizobiaceae) and Gammaproteobacteria were enhanced by mixed inoculation with 385
Sinorhizobium meliloti 4H41 and Rhizobium gallicum 8a3. Likewise, Gupta et al. (2014)
386
proposed that this enhancement could be attributed to the fact that bioinoculants directly 387
and/or indirectly promote the growth of existing soil bacterial populations by 388
releasing/fixing/solubilising certain substrates that act as nutrients or inhibitors of 389
pathogenic microorganisms. 390
The saline stress is an important driver of the microbiota assemblage, acting through 391
selective enrichment of specific taxa, including Microbacterium, Opitutus and Steroidobacter 392
on the root tissues. In the root-adhering soil, members of Betaproteobacteria 393
(Achromobater), and Bacteroidetes (Flavobacterium) were specifically enriched. These 394
bacterial populations are whether the most tolerant to saline stress or could proliferate 395
because their antagonists are sensitive to saline stress. However, their enrichment did not 396
enable the plant to better tolerate saline stress, or to a lesser extent than may have done 397
taxa enriched under saline stress and inoculation, as members of Alphaproteobacteria 398
(Agrobacterium, Mezorhizobium…) and Gammaproteobacteria (Erwinia, Arenimonas). 399
Enterobacteriaceae seem to have shifted from the RAS to the roots in the presence of saline 400
stress. Similar results on the effects of NaCl in the rhizosphere of various agricultural crops 401
halophytes (Liu et al., 2016; Yang et al., 2016) have been previously reported. However, the
403
length of 16S sequences obtained with current high-throughput sequencing techniques is relatively
404
short, and does not allow us to describe OTUs at the species level, and since within the same bacterial
405
genus, phytobeneficial bacteria and pthytopathogens can co-exist, we can hardly claim that the plant,
406
under certain stress conditions, will select specifically beneficial microbiota.
407
The core microbiota regroups bacteria that are present in all samples whatever the 408
treatment. These bacteria are likely not sensitive to saline stress, however their presence in 409
not sufficient to help plants to tolerate the saline stress (Fig. 6a, 6d). This raises the question 410
of whether the core microbiota confers any benefit to the host and whether it improves the 411
plant tolerance to saline stress. Linking microbiome assembly and plant saline stress 412
tolerance is an overarching challenge. 413
It is possible to identify positive and negative co-occurrence correlations between bacterial 414
community members, which may reflect synergistic and antagonistic functional relationships 415
(Faust and Raes, 2012). Such interactions can be analyzed and visualized as networks and 416
may help understanding host-associated microbiome dynamics. We used network analysis to 417
explore complex interactions between microorganisms. Microbial networks are 418
spatiotemporal representations of ecosystems and are composed of nodes and edges. 419
Connectivity, represented by the number of links between a node and other nodes, is an 420
indicator of the strength with which an OTU is connected to other OTUs. OTUs having an 421
extraordinarily large number of positive and negative interactions and named hubs and thus 422
appear important drivers of bacterial communities shaping (Agler et al., 2016; Layeghifard et 423
al., 2017). Our network analysis evidenced that hubs are mainly members of
such as Gemmatimonadetes, Verrucomicrobia, Acidobacteria and Chloroflexi. Our analysis 426
indicates that a hub involved in positive interactions under certain conditions may behave 427
differently under stress conditions and establish mainly antagonistic interactions. Such 428
behavior might be linked to the expression of genes encoding antimicrobial compounds 429
concomitantly to those involved in stress tolerance, or at the contrary, the stress tolerance 430
mechanism requiring energy, may be expressed at the expense of genes encoding 431
antimicrobial compounds. The latter hypothesis is likely more common, as the case of 432
Sinorhizobium and an OTU member of Gemmatimonadetes, which are mainly involved in
433
positive interactions only in the presence of saline stress, while they exhibit antagonistic 434
interactions in the absence of saline stress. 435
The novel structure of bacterial communities might confer a benefit to the plant host by 436
improving its saline stress tolerance. Bacterial inoculation may have a direct or indirect 437
contribution via the modulation of the microbiota structure, thus enabling plants to 438
withstand salinity-derived drought. These results indicate that improving plant tolerance to 439
saline stress is not only based on certain microbial populations, but also on the interaction 440
and interplay of the entire microbiota. Understanding such associations will likely help 441
understanding plant salt tolerance and the implication of their associated microorganisms 442
(de Zelicourt et al., 2013). 443
Several questions remain unresolved. How plants respond to a change in microbial networks 444
and assemblage might be assessed by metabolomics, transcriptomics and proteomics 445
approaches, but determining whether these modifications are imposed on plants or whether 446
challenging. In addition, we can hardly define the network in which microorganisms can 448
cooperate to thrive harsh conditions and help the plant to withstand such stresses. 449
Functional understanding of the microbiota still remains the biggest challenge and 450
integration of high-throughput profiling of the microbial transcriptome, metabolome, and 451 proteome is needed. 452 453 4. Conclusions 454
Our results demonstrate that the soil microbial community is complex and dynamic, with a 455
varying composition between the root-adhering soil and root tissue compartments. 456
Furthermore, our findings show that inoculation causes changes in the number and 457
composition of the bacterial taxonomic groups present in these compartments. These 458
changes could possibly modulate plant saline -tolerance and beneficial soil functions. 459
Altogether these data indicate that whether the plant recruits a specific microbiota, which 460
composition is driven by the root exudates, or the saline stress is the main driver of bacterial 461
community assemblage. This questions to what extent the plant itself, actively drives such 462
changes of the microbiota. The mechanisms by which plant hosts select their microbiota 463
from the reservoir are not fully understood. 464
465
Acknowledgements
466
This study was financially supported by Hubert Curien Partnerships (PHC), project PRAD 11-467
01-Egide N° 24186QM and project TOUBKAL 16-21 Campus France n° 34717WA. 468
Conflict of Interest: The authors declare that they have no conflict of interest. 470 471 472 Author Contributions: 473
LB, FK, KO, TH, and WA designed the study. LB and FK, performed the experiments. JT, PO 474
and MB performed bioinformatics analysis. LB, WA, TH and KO wrote the paper. 475
476
References
477
Agler, M. T., Ruhe, J., Kroll, S., Morhenn, C., Kim, S. T., Weigel, D., Kemen, E. M. (2016). 478
Microbial hub taxa link host and abiotic factors to plant microbiome variation. PLoS 479
Biol., 14(1). 480
Altschul, S. F., Gish, W., Miller, W., Myers, E., Lipman, D. J. (1990) Basiclocal alignment 481
search tool. J. Mol. Biol. 215:403–410 482
Barberan, A., Bates, S. T., Casamayor, E. O. Fierer, N. Using network analysis to explore co-483
occurrence patterns in soil microbial communities. ISME J. 6, 343–351 (2012). 484
Benidire, L., Lahrouni, M., El Khalloufi, F., Göttfert, M., Oufdou K. (2017). Effects of 485
Rhizobium leguminosarum inoculation on growth and mineral assimilation in Vicia faba
486
plants under salinity stress. J. Agr. Sci. Tech. 19, 889–901 487
Benlloch, S., López-López, A., Casamayor, E. O., Øvreås, L., Goddard, V., Daae, F. L. (2002). 488
Prokaryotic genetic diversity throughout the salinity gradient of a coastal solar saltern. 489
Environ. Microbiol. 4: 349–360. doi: 10.1046/j.1462-2920.2002.00306.x
490
Bertrand, A., Dhont, C., Bipfubusa, M., Chalifour, F. P., Drouin, P., Beauchamp, C. J. (2015). 491
Bharti, N., Barnawal, D., Wasnik, K., Tewari, S. K., Kalra, A. (2016). Co-inoculation of Dietzia 494
natronolimnaea and Glomus intraradices with vermicompost positively influences
495
Ocimum basilicum growth and resident microbial community structure in salt affected
496
low fertility soils. Appl. Soil Ecol. 100, 211–225. doi: 10.1016/j.apsoil.2016.01.003 497
Blasiak, L. C., Schmidt, A. W., Andriamiarinoro, H., Mulaw, T., Rasolomampianina, R., 498
Applequist, W. L., et al. (2014). Bacterial communities in Malagasy soils with differing 499
levels of disturbance affecting botanical diversity. PLoS One. 9, e85097. doi: 500
10.1371/journal.pone.0085097 501
Bodaker, I., Sharon, I., Suzuki, M. T., Feingersch, R., Shmoish, M., Andreishcheva, E., et al. 502
(2010). Comparative community genomics in the Dead Sea: an increasingly extreme 503
environment. ISME J. 4, 399–407. doi:10.1038/ismej.2009.141 504
Borruso, L., Bacci, G., Mengoni, A., De Philippis, R., and Brusetti, L. (2014). Rhizosphere effect 505
and salinity competing to shape microbial communities in Phragmites australis (Cav.) 506
Trin. ex-Steud. FEMS Microbiol. Lett. 359, 193–200. doi:10.1111/1574-6968.12565 507
Busby PE, Soman C, Wagner MR, Friesen ML, Kremer J, Bennett A, et al. (2017). Research 508
priorities for harnessing plant microbiomes in sustainable agriculture. PLoS Biol. 15, 509
e2001793 (2017). 510
Caporaso, J. G., Kuczynski, J., Stombaugh, J., Bittinger, K., Bushman, F. D., Costello, E. K., et 511
al. (2010). QIIME allows analysis of high-throughput community sequencing data. Nat. 512
Methods 7, 335–336. doi:10.1038/nmeth.f.303.
513
Caton T. M. (2004) Halotolerant aerobic heterotrophic bacteria from the great salt plains of 514
Oklahoma. Microb. Ecol. 48, 449–462. doi: 10.1007/s00248-004-0211-7 515
and structure of rhizosphere bacterial communities and enhances nodulation and 518
growth. Arch. Microbiol. 197, 805–813. doi:10.1007/s00203-015-1118-z. 519
Chowdhury, N., Marschner, P., and Burns, R. G. (2011). Soil microbial activity and community 520
composition: impact of changes in matric and osmotic potential. Soil Biol. Biochem. 521
43(6), 1229–1236. doi: 10.1016/j.soilbio.2011.02.012 522
Coleman-Derr, D., and Tringe, S. G. (2014). Building the crops of tomorrow: advantages of 523
symbiont-based approaches to improving abiotic stress tolerance. Front. Microbiol. 5, 524
283. doi: 10.3389/fmicb.2014.00283 525
Crump, B. C., Hopkinson, C. S., Sogin, M. L., Hobbie, J. E. (2004). Microbial biogeography 526
along an estuarine salinity gradient : combined influences of bacterial growth and 527
residence time. Appl. Environ. Microbiol. 70, 1494–1505. doi:10.1128/AEM.70.3.1494 528
de Zelicourt, A., Al-Yousif, M., Hirt, H. (2013). Rhizosphere microbes as essential partners for 529
plant stress tolerance. Mol. Plant. 6, 242–245 530
de Zelicourt A, Synek L, Saad MM, Alzubaidy H, Jalal R, Xie Y, et al. (2018) Ethylene induced 531
plant stress tolerance by Enterobacter sp. SA187 is mediated by 2-keto-4 532
methylthiobutyric acid production. PLoS Genet 14(3): e1007273. 533
https://doi.org/10.1371/journal.pgen.1007273 534
Dixon, P. (2003). VEGAN, a package of R functions for community ecology. J. Veg. Sci. 14(6), 535
927–930. 536
El Khalloufi, F., Oufdou, K., Bertrand, M., Lahrouni, M., Oudra, B., Ortet, P., et al. (2016). 537
Microbiote shift in the Medicago sativa rhizosphere in response to cyanotoxins extract 538
exposure. Sci. Total Environ. 539, 135–142. doi:10.1016/j.scitotenv.2015.08.127 539
cyanobacterial toxins (Microcystins) exposure. Toxicon 76, 167–177. doi: 542
10.1016/j.toxicon.2013.10.003 543
El Khalloufi, F., Oufdou, K., Lahrouni, M., El Ghazali, I., Saqrane, S., Vasconcelos, V., et al. 544
(2011). Allelopatic effects of cyanobacteria extracts containing microcystins on 545
Medicago sativa-rhizobia symbiosis. Ecotoxicol. Environ. Saf. 74(3), 431–438. doi:
546
10.1016/j.ecoenv.2010.10.006 547
Fasciglione, G., Casanovas, E. M., Yommi, A., Sueldo, R. J., Barassi, C. A. (2012). Azospirillum 548
improves lettuce growth and transplant under saline conditions. J. Sci. Food Agric. 92, 549
2518–2523. doi:10.1002/jsfa.5661 550
Fierer, N., Bradford, M. A., Jackson, R. B. (2007). Toward an ecological classification of soil 551
bacteria. Ecology 88, 1354-1364. doi: 10.1890/05-1839 552
Faust, K., and Raes, J. (2012). Microbial interactions: from networks to models. Nat. Rev. 553
Microbiol. 10, 538–550. doi: 10.1038/nrmicro2832 554
Glick, B. R. (2014). Bacteria with ACC deaminase can promote plant growth and help to feed 555
the world. Microbiol. Res. 169, 30–39. doi:10.1016/j.micres.2013.09.009 556
Gupta, R., Mathimaran, N., Wiemken, A., Boller, T., Bisaria, V. S., Sharma, S. (2014). Non-557
target effects of bioinoculants on rhizospheric microbial communities of Cajanus cajan. 558
Appl. Soil Ecol. 76, 26–33. doi: 10.1016/j.apsoil.2013.12.001
559
Hahm, M. S., Son, J. S., Kim, B. S., Ghim, S. Y. (2017). Comparative study of rhizobacterial 560
communities in pepper greenhouses and examination of the effects of salt 561
accumulation under different cropping systems. Arch. Microbiol. 199, 303–315. 562
doi:10.1007/s00203-016-1304-7 563
Haichar, F. Z., Marol, C., Berge, O., Rangel-Castro, J. I., Prosser, J. I., Balesdent, J., et al. 564
(2008). Plant host habitat and root exudates shape soil bacterial community structure. 565
ISME J. 2, 1221–1230. doi: 10.1038/ismej.2008.80
566
Haichar, F. Z., Santaella, C., Heulin, T., Achouak, W. (2014). Root exudates mediated 567
interactions belowground. Soil Biol. Biochem. 77, 69–80. doi: 568
10.1016/j.soilbio.2014.06.017 569
Hashem, F. M., Swelim, D. M., Kuykendall, L. D., Mohamed, A. I., Abdel-Wahab, S. M., Hegazi, 570
N. I. (1998). Identification and characterization of salt-and thermo-tolerant Leucaena-571
nodulating Rhizobium strains. Biol. Fertil. Soils 27, 335–341. doi: 572
10.1007/s003740050440 573
Ibekwe, A. M., Ors, S., Ferreira, J. F., Liu, X., Suarez, D. L. (2017). Seasonal induced changes in 574
spinach rhizosphere microbial community structure with varying salinity and drought. 575
Sci. Total Environ. 579, 1485–1495. doi: 10.1016/j.scitotenv.2016.11.151
576
Kausar, R., and Shahzad, S. M. (2006) Effect of ACC-deaminase containing rhizobacteria on 577
growth promotion of maize under salinity stress. J Agr Forest Soc Sci 2(4), 216–218. 578
Lambers, H. (2003). Dryland salinity: A key environmental issue in southern Australia. Plant 579
Soil 257, 5–7. doi:10.1023/B:PLSO.0000003909.80658.d8
580
Lauber, C. L., Hamady, M., Knight, R., Fierer, N. (2009). Pyrosequencing-based assessment of 581
soil pH as a predictor of soil bacterial community structure at the continental scale. 582
Appl. Environ. Microbiol. 75(15), 5111–5120. doi: 10.1128/aem.00335-09
583
Layeghifard, M., Hwang, D. M., Guttman, D. S. (2017). Disentangling interactions in the 584
microbiome: a network perspective. Trends Microbiol. 25, 217–228. doi: 585
Li, X., Sun, M., Zhang, H., Xu, N., Sun, G. (2016). Use of mulberry-soybean intercropping in 587
salt-alkali soil impacts the diversity of the soil bacterial community. Microb. Biotechnol. 588
9, 293–304. doi:10.1111/1751-7915.12342 589
Liu, W., Zhang, W., Liu, G., Zhang, Y., Zhang, G. (2016). Microbial diversity in the saline-alkali 590
soil of a coastal Tamarix chinensis woodland at Bohai Bay, China. J. Arid Land 8, 284– 591
292. doi:10.1007/s40333-015-0092-2 592
Martínez-Alonso, M., Escolano, J., Montesinos, E., Gaju, N. (2010). Diversity of the bacterial 593
community in the surface soil of a pear orchard based on 16S rRNA gene analysis. Int 594
Microbiol 13, 134. doi:10.2436/20.1501.01.117
595
Mesbah, N. M., Abou-El-Ela, S. H. aWiegel, J. (2007). Novel and unexpected prokaryotic 596
diversity in water and sediments of the alkaline, hypersaline lakes of the Wadi An 597
Natrun, Egypt. Microb. Ecol. 54, 598–617. doi:10.1007/s00248-006-9193-y 598
Munns, R., Tester, M. (2008). Mechanisms of salinity tolerance. Annu. Rev. Plant Biol. 59, 599
651–681. 600
Munns, R., Gilliham, M., (2015). Salinity tolerance of crops - what is the cost? New Phytol. 601
208, 668–673. doi: 0.1111/nph.13519 602
Nie, Y., Wang, D. Q., Zhao, G., Yu, S., Wang, H. Y. (2016). Effects of betaine aldehyde 603
dehydrogenase-transgenic soybean on phosphatase activities and rhizospheric 604
Bacterial community of the saline-alkali soil. Biomed Res. Int. Article 2016: 4904087 605
Nogales, J., Campos, R., BenAbdelkhalek, H., Olivares, J., Lluch, C., Sanjuan, J. (2002). 606
Rhizobium tropici genes involved in free-Living salt tolerance are required for the
607
establishment of efficient nitrogen-fixing symbiosis with Phaseolus vulgaris. Mol. 608
Petric, I., Philippot, L., Abbate, C., Bispo, A., Chesnot, T., Hallin, S., et al. (2011). Inter-610
laboratory evaluation of the ISO standard 11063 "Soil quality-Method to directly 611
extract DNA from soil samples". J. Microbiol. Methods 84(3), 454–460. doi: 612
10.1016/j.mimet.2011.01.016 613
Qin, Y., Druzhinina, I. S., Pan, X., Yuan, Z. (2016). Microbially mediated plant salt tolerance 614
and microbiome-based solutions for saline agriculture. Biotechnol. Adv. 34(7), 1245– 615
1259. doi: 10.1016/j.biotechadv.2016.08.005 616
Rath KM, Maheshwari A, Rousk J. (2019a). Linking microbial community structure to trait 617
distributions and functions using salinity as an environmental filter. mBio 10:e01607-618
19. 619
Rath KM, Fierer N, Murphy DV, Rousk J. (2019b). Linking bacterial community composition to 620
soil salinity along environmental gradients. ISME J 13:836–846. 621
Rath KM, Maheshwari A, Bengtson P, Rousk J. (2016). Comparative toxicities of salts on 622
microbial processes in soil. Appl. Environ. Microbiol. 82:2012–2020. 623
R CORE TEAM, R. (2016). R: a language and environment for statistical computing. 2015. R 624
Foundation for Statistical Computing, Vienna, Austria. 625
Schimel, J., Balser, T. C., Wallenstein, M. (2007). Microbial stress-response physiology and its 626
implications for ecosystem function. Ecology 88(6), 1386–1394. doi: 10.1890/06-0219 627
Sykes, G., and Skinner, F.A. (1973). "Actinomycetales: characteristics and practical 628
importance", in Society for Applied Bacteriology Symposium, ed. Sykes, G., Skinner, F.A.
629
(Academic Press), pp. 191–192. 630
Thomas, F., Hehemann, J. H., Rebuffet, E., Czjzek, M., Michel, G. (2011). Environmental and 631
Trabelsi, D., Mengoni, A., Ben Ammar, H., Mhamdi, R. (2011). Effect of on-field inoculation of 634
Phaseolus vulgaris with rhizobia on soil bacterial communities. FEMS Microbiol. Ecol.
635
77, 211–222. doi:10.1111/j.1574-6941.2011.01102.x 636
Upadhyay, S. K., Singh, D. P. (2015). Effect of salt-tolerant plant growth-promoting 637
rhizobacteria on wheat plants and soil health in a saline environment. Plant Biol. 17, 638
288–293. doi:10.1111/plb.12173 639
Vincent, J.M. (1970). A manual for the practical study of root nodule bacteria. IBPp 640
Handbook No. 15, Blackwell Scientific, Oxford. 641
Walsh, D. A., Papke, R. T., Doolittle, W. F. (2005). Archaeal diversity along a soil salinity 642
gradient prone to disturbance. Environ. Microbiol. 7(10), 1655–1666. doi: 643
10.1111/j.1462-2920.2005.00864.x 644
Williams, R. J., Howe, A. Hofmockel, K. S. Demonstrating microbial co-occurrence pattern 645
analyses within and between ecosystems. Front. Microbiol. 5, 358 (2014). 646
Yaish, M. W., Al-Lawati, A., Jana, G. A., Patankar, H. V., Glick, B. R. (2016). Impact of soil 647
salinity on the structure of the bacterial endophytic community identified from the 648
roots of caliph medic (Medicago truncatula). PLoS One 11, e0159007. 649
doi:10.1371/journal.pone.0159007 650
Yang, H., Hu, J., Long, X., Liu, Z., Rengel, Z. (2016). Salinity altered root distribution and 651
increased diversity of bacterial communities in the rhizosphere soil of Jerusalem 652
artichoke. Sci. Rep. 6, 20687. doi:10.1038/srep20687 653
Zilber-Rosenberg, I., Rosenberg, E. (2008). Role of microorganisms in the evolution of 654
animals and plants: the hologenome theory of evolution. FEMS Microbiol. Rev. 32(5), 655
Figure legends
657
Figure 1. Effect of salt treatment on the fresh weight of Vicia faba shoots. T:
non-658
inoculated plants. Inoculation was performed with the three bacterial strains, BLA7, RhOL9 659
and RhOF125. Values are means ± SD of four replicates. Bars with different letters are 660
significantly different at P≤0.05 according to the SNK test. 661
Figure 2: Beta diversity of the rhizosphere of Vicia faba in response to inoculation and salt
662
stress. Relative abundance of major OTUs at familly level (a) in the root compartment (RT) ;
663
(b) in the root-adhering soil compartment (RAS). Community structure of bacteria, in the 36 664
samples was determined using principal-component analysis. The first two dimensions of a 665
principal-component analysis are plotted based on Bray-Curtis distances. Samples are color 666
coded according to the compartment, and are depicted with different colours. Clustering by 667
compartment (c), by salt treatment (d) and by inoculation treatment (e). 668
669
Figure 3. Specific shift of beta diversity mediated by inoculation and salt stress.
670
Phylogenetic cladogram of OTUs specific (a) to roots of inoculated seedlings and to roots of 671
seedlings submitted to saline stress, (b) to RAS of seedlings inoculated, under salt stress or 672
submitted to both treatments. (c, d) Linear discriminant analysis effect size (LEfSe) analysis 673
shows differentially abundant taxa as biomarkers using Kruskal–Wallis test (P < 0.05) with 674
Linear Discriminant Analysis (LDA) score > 2.0. OTUs. The circles from inside to outside 675
indicate bacterial taxonomic levels from phylum to genus. Yellow dots represent bacteria not 676
significantly varying in abundance among treatments. Biomarker bacteria are colored 677
Figure 4: Relationship between diversity and inoculation and /or salt stress. First PC1 and
679
second PC2 principal components of the principal component analysis (PCA) illustrating the 680
relative ordination of the various treatments based on the relative abundance of OTUs (a) in 681
the roots-adhering soil samples, (b) in the root samples. Taxa correlated with each 682
treatment are indicated. 683
Figure 5. Figure 5: Bacterial Network of the Vicia faba rhizosphere and roots microbiota.
684
(a) Correlation-based network of V. faba rhizosphere and roots-associated microbial OTUs 685
detected in response to inoculation and salt stress treatments. Each node corresponds to an 686
OTU, and edges between nodes correspond to either positive (green) or negative (red) 687
correlations inferred from OTU connectivity profiles using Pearson correlations. OTUs 688
belonging to different microbial kingdoms have distinct color codes, and node size reflects 689
their connection degree. (b).“Hub”microbes were identified as those which were 690
significantly more central based on all three measurements of centrality. 691
Table 1: Topological properties of the empirical phylogenetic molecular ecological networks
692
of microbial communities in the rhizosphere of V. faba under salt stress, inoculation or both 693
treatments. 694
Figure 6. Beta diversity and interaction network features. Impact of salt, inoculation and
695
both treatment on the relative abundance at phylum level and class level for Proteobacteria 696
of (a) OTUs, (b) nods and (c) hubs in each treatment in the rhizosphere of V. faba. Venn 697
diagram representing the shared and specific (d) OTUs, (e) nods and (f) hubs in the different 698
treatments. (g) Relative number of positive (green) and negative (red) interactions (edges 699
701
Figure 1: Effect of inoculation and salt treatment on the fresh weight of Vicia faba shoots. T:
702
non-inoculated plants. Inoculation was performed with the three bacterial strains, BLA7, 703
RhOL9 and RhOF125. Values are means ± SD of four replicates. Bars with different letters are 704
significantly different at P ≤0.05 according to the SNK test. 705 706 707 708 a c a b 0 2 4 6 8 10 0 mM 70 mM 0 mM 70 mM T Co-inoculation Sh oot f re sh wei gh t (g /p lan t)
709
Figure 2: Beta diversity of the rhizosphere of Vicia faba in response to inoculation and salt
710
stress. Relative abundance of major OTUs at familly level (a) in the root compartment (RT) ; 711
(b) in the root-adhering soil compartment (RAS). Community structure of bacteria, in the 36 712
samples was determined using principal-component analysis. The first two dimensions of a 713
principal-component analysis are plotted based on Bray-Curtis distances. Samples are color 714
coded according to the compartment, and are depicted with different colours. Clustering by 715
compartment (c), by salt treatment (d) and by inoculation treatment (e). 716 717 718 Inoculation (e) NaCl (d) (c) Compartment (a) (b) 0% 10% 20% 30% 40% 50% 60% 70% 80% 90% 100% Xanthomonada ceae Pseudomonadaceae Enterobacteriaceae Methy lophilaceae Oxalobacteracea e Comamonadacea e Alcaligenaceae C/Betaproteobacteria;Other Sphingomonadaceae Rhizobiaceae Phyllobacteriaceae Methy lobacteriaceae Hy phomicrobia ceae Bradyrhizobiaceae O/Rhizobia les;Other Caulobactera ceae C/Alpha proteobacteria;Other Chitinophaga ceae Sphingobacteriaceae Weeksellaceae Cytophagaceae Streptomycetaceae Promicromonospora ceae Nocardioida ceae Microbacteriacea e O/Actinomyceta les;Other C o n tr o l In o cu la ti o n N aC l In o cu la ti o n & N aC l 0% 10% 20% 30% 40% 50% 60% 70% 80% 90% 100% C/TM7- 3 Xanthomonada ceae Pseudomonadaceae Enterobacteriaceae Alcaligenaceae Sphingomonadaceae Rhizobiaceae Phyllobacteria ceae O/Rhizobia les;Other Caulobactera ceae C/Alpha proteobacteria;Other Chitinophaga ceae Sphingobacteriaceae Weeksellaceae Flavobacteriaceae Micrococcaceae Microbacteriacea e C o n tr o l In o cu la ti o n N aC l In o cu la ti o n & N aC l
719
Figure 3. Specific shift of beta diversity mediated by inoculation and salt stress.
720
Phylogenetic cladogram of OTUs specific (a) to roots of inoculated seedlings and to roots of 721
seedlings submitted to saline stress, (b) to RAS of seedlings inoculated, under salt stress or 722
submitted to both treatments. (c, d) Linear discriminant analysis (LDA) effect size (LEfSe) 723
analysis shows differentially abundant taxa as biomarkers using Kruskal–Wallis test (P < 0.05) 724
with LDA score > 2.0. OTUs. The circles from inside to outside indicate bacterial taxonomic 725
levels from phylum to genus. Yellow dots represent bacteria not significantly varying in 726
abundance among treatments. Biomarker bacteria are colored according to their 727
corresponding class colors on the right. 728 729 (a) (b) (c) (d) Root-Inoculation Root-NaCl a RAS-Inoculation RAS-NaCl RAS-NaCl-Inoculation
730
Figure 4: Relationship between diversity and inoculation and /or salt stress. First PC1 and
731
second PC2 principal components of the principal component analysis (PCA) illustrating the 732
relative ordination of the various treatments based on the relative abundance of OTUs (a) in 733
the roots-adhering soil samples, (b) in the root samples. Taxa correlated with each 734
treatment are indicated. 735
736
Control Inoculation NaCl Inoculation & NaCl
Control Inoculation NaCl Inoculation & NaCl
737
Figure 5: Bacterial Network of the Vicia faba rhizosphere and roots microbiota. (a)
738
Correlation-based network of V. faba rhizosphere and roots-associated microbial OTUs 739
detected in response to inoculation and salt stress treatments. Each node corresponds to an 740
OTU, and edges between nodes correspond to either positive (green) or negative (red) 741
correlations inferred from OTU connectivity profiles using Pearson correlations. OTUs 742
belonging to different microbial kingdoms have distinct color codes, and node size reflects 743
their connection degree. (b).“Hub”microbes were identified as those which were 744
significantly more central based on all three measurements of centrality. 745
746
(a)
(b)
Table 1: Topological properties of the empirical phylogenetic molecular ecological networks
747
of microbial communities in the rhizosphere of V. faba under salt stress, inoculation or both 748 treatments. 749 Treatment network size Link average connectivity average geodesic distance average clustering coefficient modularity number of modules Control 181 951 11.41 3.05 0.83 0.64 10 NaCl 179 1114 10.75 3.39 0.79 0.68 15 Inoculation 179 1167 11.95 3.66 0.79 0.65 12 Inoculation & NaCl 178 1145 11.37 3.2 0.8 0.63 10 750 751
752
Figure 6 : Beta diversity and interaction network features. Impact of salt, inoculation and
753
both treatment on the relative abundance at phylum level and class level for Proteobacteria 754
of (a) OTUs, (b) nods and (c) hubs in each treatment in the rhizosphere of V. faba. Venn 755
diagram representing the shared and specific (d) OTUs, (e) nods and (f) hubs in the different 756
treatments. (g) Relative number of positive (green) and negative (red) interactions (edges 757
from network) for each hub in each treatment. 758 759 OTUs Nods Hubs (a) (b) (c) (d) (e) (f) (g) Control NaCl Inoculation Inoculation & NaCl