OMA 2011: orthology inference among
1000 complete genomes
Adrian M. Altenhoff
1,2, Adrian Schneider
3, Gaston H. Gonnet
1,2and
Christophe Dessimoz
1,2,*
1
ETH Zurich, Computer Science, Universita¨tstr. 6, 8092 Zurich, Switzerland, 2Swiss Institute of Bioinformatics, Universita¨tstr. 6, 8092 Zurich, Switzerland and3University of Edinburgh, Institute of Evolutionary Biology, West Mains Rd, Edinburgh, EH9 3JT, UK
Received August 13, 2010; Revised October 1, 2010; Accepted November 13, 2010
ABSTRACT
OMA (Orthologous MAtrix) is a database that identifies orthologs among publicly available, complete genomes. Initiated in 2004, the project is at its 11th release. It now includes 1000 genomes, making it one of the largest resources of its kind. Here, we describe recent developments in terms of species covered; the algorithmic pipeline—in particular regarding the treatment of alternative splicing, and new features of the web (OMA Browser) and programming interface (SOAP API). In the second part, we review the various represen-tations provided by OMA and their typical applica-tions. The database is publicly accessible at http:// omabrowser.org.
INTRODUCTION
Entire genomes are being sequenced faster than ever, yet making sense out of the resulting sequences remains a challenge. Fortunately, there is no need to start ab initio with each new genome, as much knowledge can be transferred from evolutionarily related species better characterized. In this context, a central notion is that of orthologs, pairs of genes that started diverging through speciation (1). Since by definition, orthologs were the same gene in their last common ancestor, it is commonly assumed that they have kept a similar function [e.g. (2)].
The interest for orthology has given rise to the develop-ment of several specialized databases, such as COG/KOG (3), InParanoid (4), OrthoMCL (5), YGOB (6), Roundup (7), Homologene (8), Ensembl Compara (9), HOGENOM (10), EggNog (11), MBGD (12), OrthoDB (13), PhyloDB (14) and PHOG (15).
Since 2004, we have been developing the orthology database OMA (Orthologous MAtrix), with the goal of analyzing all genomes that are publicly available (16).
OMA is based on an algorithm that compares genes on the basis of evolutionary distances, considers distance in-ference uncertainty and accounts for differential gene losses (17). In an extensive assessment of 11 databases and methods, we showed that the orthologs inferred by OMA show high accuracy in terms of Fitch’s phylogeny-based definition and high conservation in terms of functional annotations (18). Results can be downloaded as raw data, consulted interactively using a web interface or accessed through the programming inter-faces SOAP and DAS (19).
Recently, we have released the 11th revision of OMA, which includes ortholog predictions among 1000 genomes. This new milestone is an opportunity to inform the com-munity of OMA’s latest developments. In the first part of this article, we reflect on the growth of OMA, describe algorithmic refinements and introduce new features of the web and programming interface. In the second part, we discuss the various types of representations and typical use cases. Finally, we conclude with thoughts on the future of OMA and of orthology databases in general.
RECENT DEVELOPMENTS AND NEW FUNCTIONS Species analyzed
Between 2005 and 2010, OMA was updated 11 times, steadily increasing the number of genomes under analysis from 150 to 1000 genomes (Figure 1). This linear growth is noteworthy, because most orthology in-ference methods have a computational cost at least quad-ratic in the number of species. In OMA, we could compensate this computational burden through a combin-ation of hardware and software improvements, and espe-cially the 10-fold speed-up obtained from vectorizing the computation of Smith–Waterman sequence alignments (20).
The 11th release includes 827 bacteria, 103 eukaryotes and 70 archaea. The distribution of species among the
*To whom correspondence should be addressed. Tel: +41 44 6327472; Fax: +41 44 6321374; Email: [email protected] ß The Author(s) 2010. Published by Oxford University Press.
This is an Open Access article distributed under the terms of the Creative Commons Attribution Non-Commercial License (http://creativecommons.org/licenses/ by-nc/2.5), which permits unrestricted non-commercial use, distribution, and reproduction in any medium, provided the original work is properly cited.
main taxonomic ranks is depicted in Figure 2. Our primary sources for complete and annotated genomes included into OMA are GenomeReviews (21), Ensembl (22), EnsemblGenomes (23) and JGI (http://www.jgi .doe.gov). Thus, we rely on the quality and completeness standards of these databases. In addition, we also update genomes that have significantly changed since they were added to OMA. For instance, in the 10th release, 88 genomes (8.8%) were updated. The priority order of new and updated genomes is influenced by the needs of our users, whom we encourage to give us feedback. Algorithmic refinements
Since publication of the algorithm of OMA (17), our main algorithmic improvement has been in how we handle splice variants. In eukaryotic genomes, genes often have many splice variants, also called alternative splicings. In the version of the human genome currently in OMA (Ensembl v.55), genes have up to 44 annotated splice variants. This poses a challenge for ortholog prediction algorithms based on protein sequences, because orthology is defined at gene level. Thus, although all proteins produced from a particular gene should reflect its evolu-tionary history, problems arise when inconsistent splice variants are compared across species.
In previous works, alternative splicings have been handled in mainly three ways. Most commonly, a refer-ence splice variant is selected, usually the longest one, and used exclusively in all computations (4,13). In Ensembl Compara, the reference (‘canonical’) variant is further required to be a bona fide transcript, and not a processed pseudogene, the result of non-sense mediated decay, or other such aberration (A. Vilella, personal communica-tion). A potential problem with this first approach is that the reference variant might not necessarily match across all species. This problem is addressed in the second approach, which consists in keeping all splicing variants for the first part of the analysis, explicitly iden-tifying the corresponding variants across species and choosing a representative one on this basis (25). But this idea entails markedly higher time complexity, and to our knowledge has only been applied to genome pairs. Finally, the third approach consists in considering for each gene the concatenation of all exons. This notion (‘metascript’),
proposed in the context of a study on the selective pressure of protein-coding genes (26), has yet to be adopted by orthology databases (whose authors are perhaps reluctant to base all computations on artificial constructs).
In OMA, the way splicing variants are treated uses a combination of the first and second approaches above. First, not all splicing variants are integrated into the OMA sequence database. The longest variant is always retained, but shorter variants are only kept if they differ at least in 10% of their sequence from all longer variants retained. This way, most exons of a given gene will be part of some OMA sequence, while at the same time the total numbers of sequences is kept low. During the all-against-all pairwise alignment phase of OMA, these splicing variants are treated independently and are aligned against all other sequences (and splicing variants) in all other genomes. Later, for the formation of stable pairs, the pairs of putative orthologs, and all subsequent steps of the algorithm, only one splicing variant is used to represent a given gene. This is particu-larly important in OMA because such variants would be indistinguishable from paralogs, and paralogs are used as potential witnesses of non-orthology in the verification phase (27). At this stage, ideally, one would have to find the optimal combination of variants to keep for each gene, such that a maximal number of orthologs can be found. But as alluded above, the testing of the many combin-ations is excessively costly and thus a heuristic has to be employed. Thus, for each gene with alternative splicings, we select the variant for which the highest number of sig-nificant matches in all other genomes has been recorded in the all-against-all step. This is based on the assumption that a protein involved in more significant matches is also likely to form a higher number of orthologous pairs. For instance, with gene T22D3_HUMAN, the algorithm selects as reference splicing variant the same one as SwissProt’s canonical sequence, which happens not to be the longest transcript. In total, out of the 36 603 genes with alternate splicings, a non-longest transcript was selected 12 752 cases (34%). This proportion varies among the different genomes and is lowest for human (19%) and mouse (21%) and is highest for the pufferfish (54%). The impact on orthology inference is more difficult to assess, but we observe that the new procedure leads to more orthologous pairs inferred, and to larger OMA groups on average.
Hierarchical groups of orthologs
Starting with the 11th release (November 2010), we are adding a new type of orthologous grouping in OMA. Previously, our main type of groups were ‘OMA groups’, which are constructed with the objective that every pair of genes be orthologous. As we discuss in the next section, however, there are inherent limitations to this type of grouping strategy. As alternative to OMA groups, we now offer ‘hierarchical groups of orthologs’, groups of genes that descend from a single common ancestral gene within a given taxonomic range. This type of groups are at the core of several other orthology databases, most notably COG/KOG (3), OrthoDB (13) and EggNOG
Figure 1. Growth of the OMA database since its first release.
(11). We infer such groups from our pairwise orthology predictions and the NCBI taxonomy database (24) using the following idea. It can be easily shown that, with correct and complete pairwise orthology relations, hier-archical groups correspond to connected components in the orthology graph of the relevant species (the graph consists of genes as vertices, and orthology relations as edges). In practice, however, orthology graphs are rarely correct and complete. Missing edges are often not prob-lematic, because the connected components tend to be strongly connected. Spurious edges, however, can lead to erroneous merging of distinct groups. To limit this problem, we identify and remove weak connections between clusters using a min-cut algorithm (28). We discuss applications of hierarchical groups in the last part of the article.
Web interface and API
We added new functionalities to the web and programming interfaces of OMA. First, given that one of the main inter-ests in orthology is to determine the function of sequences, we have substantially improved the integration of Gene Ontology (GO) annotations to OMA. With each new OMA release, we retrieve the latest annotations from the GO consortium (29) and from the GOA database (30), and map them to all relevant sequences in OMA. The annota-tions are displayed on both protein-centric and OMA group views of the web interface. For all annotations, we
now provide evidence codes and references/links to relevant PubMed articles or inference methods.
Second, whenever a gene has several splicing variants, all of them are listed under the ‘Information’ section. For variants other than the reference one, there is a link under ‘Ortholog’ to the splicing variant from which the orthology relationships have been computed.
Third, we have developed a new representation, which we call ‘genome pair view’, to provide a list of all orthologs between any two species. The function is access-ible from the ‘Download’ section and the landing page of the OMA Browser. We discuss typical uses of this format in the next section.
Fourth, protein sequence search has been extended to support approximate sequence matching. The search algo-rithm is based on a seed-and-extend approach, with seeds of nine residues. Hence, at least nine consecutive charac-ters need to match exactly for a sequence to be found. As a result, our system finds approximate queries almost instantaneously.
And fifth, we have added new functions to the SOAP programming interface to list the various identifiers sup-ported in OMA (e.g. Swiss-Prot, Ensembl and GenBank) and perform conversions among them. For instance, it is now possible to retrieve the OMA identifiers correspond-ing to a list of Swiss-Prot gene names in a scorrespond-ingle function call. Using the same mechanism, it is also possible to retrieve Gene Ontology functional annotations
Figure 2. Visualization of the 1000 genomes included in the 10th release of OMA. Lineage assignments are based on NCBI Taxonomy database (24). Note that the radial scale (mean number of genes/genome) is not cumulative, i.e. it refers to the height of individual ‘‘band sectors’’.
corresponding to a list of proteins identified by any unique identifier supported in OMA. To help users getting started, we provide example clients in Python and Perl programming language (linked from http://omabrowser .org/API.html).
TYPES OF GROUPS AND THEIR APPLICATIONS The primary product of the OMA pipeline is a list of high-confidence pairs of orthologous genes. This list is available for download, but is for most users too cumber-some to process and too general for typical applications. Thus, we also combine these pairwise relations into four types of groups. The existence of these different represen-tations—and in general of multiple and at times conflict-ing definitions of orthologous groups—can be confusconflict-ing for many users. In this section, we review the four types of groups provided in OMA, and discuss their advantages, limitations and applications (Figure 3).
The most straightforward type of groups is the ‘protein-centric view’. In this representation, the OMA Browser provides the user with a list of genes orthologous to a specific gene. This view is appropriate for analyses centered on a single or only few genes of interest, e.g. to predict their function. More typical uses are provided in Table 1.
For analyses involving mainly pairs of genomes, the ‘genome pair view’ accessible in the ‘Download’ section of the OMA Browser is the most appropriate: it provides a list of all pairs of orthologs between any two genomes specified by the user.
The third type of groups, ‘OMA groups’, consists in groups of genes in which all pairs are orthologs. In a graph representation with genes as nodes and orthology relations as edge, OMA groups correspond to fully con-nected subgraphs. Due to this definition, each OMA group includes at most one sequence per species, and, save for inference errors, the gene trees obtained from them should be congruent to the tree of the corresponding species. Indeed, the primary application of OMA groups is to provide input data for phylogenetic inference. In other
applications, OMA group are often less appropriate. For example, evolutionary histories involving a duplication will, by definition, require at least two groups. Similarly, spuriously missed (i.e. false negative) orthologous predic-tions will also result in group fragmentation. And finally, because each protein belongs to one group at most, this representation only captures a subset of all inferred pairs of orthologs.
The last type of groups, ‘hierarchical groups’, consists in groups of genes that have descended from a common ancestral gene within a specific taxonomic range. Thus, by definition, hierarchical groups include both orthologs and in-paralogs with respect to the last common ancestor of the taxonomic range. In term of the underlying gene trees, hierarchical groups correspond to the leaves of subtrees rooted in the speciation events that define the taxonomic clade in question. By exploring groups across several levels, it is (at least in principle) possible to pinpoint the timing of particular duplication events. Hence, hierarchical groups can convey phylogenetic signal in ways that pairwise orthology/paralogy relations cannot.
CONCLUSIONS AND OUTLOOK
After 7 years of existence and trillions of alignments using over 5 million CPU hours, the OMA database now identifies orthologs among 1000 complete genomes. Recently, we have improved the way we handle alternative splicings, extended our integration of Gene Ontology functional annotations on the web interface, and added new functions to the SOAP programming interface. Furthermore, we have reviewed here how the four grouping strategies provided by OMA can be used for various typical analyses.
As for future developments, we see three areas of high potential for improvement. First, the orthology/paralogy dichotomy only considers speciation and gene duplication events. Thus, this leaves out other important evolutionary mechanisms, such as gene fusion and fission, domain shuffling, hybridization or lateral gene transfer. This
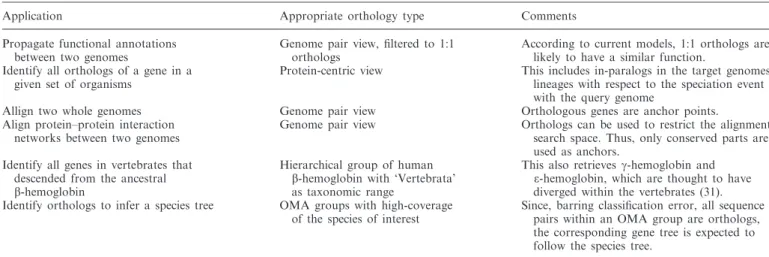
Table 1. Typical applications of orthologs and their most suitable representation of orthology
Application Appropriate orthology type Comments Propagate functional annotations
between two genomes
Genome pair view, filtered to 1:1 orthologs
According to current models, 1:1 orthologs are likely to have a similar function.
Identify all orthologs of a gene in a given set of organisms
Protein-centric view This includes in-paralogs in the target genomes lineages with respect to the speciation event with the query genome
Allign two whole genomes Genome pair view Orthologous genes are anchor points. Align protein–protein interaction
networks between two genomes
Genome pair view Orthologs can be used to restrict the alignment search space. Thus, only conserved parts are used as anchors.
Identify all genes in vertebrates that descended from the ancestral b-hemoglobin
Hierarchical group of human b-hemoglobin with ‘Vertebrata’ as taxonomic range
This also retrieves g-hemoglobin and e-hemoglobin, which are thought to have diverged within the vertebrates (31). Identify orthologs to infer a species tree OMA groups with high-coverage
of the species of interest
Since, barring classification error, all sequence pairs within an OMA group are orthologs, the corresponding gene tree is expected to follow the species tree.
latter phenomenon is particularly relevant in prokaryotes, where lateral gene transfer has long been recognized as a major evolutionary force. Second, orthology and paralogy are pairwise relations, and are thus ill-suited to expressing the evolutionary relationship of more than two genes at a time. Instead, gene trees labeled with relevant evolution-ary events (speciation, duplication, LGT, etc.) constitute a better representation of the evolutionary relationships. As was suggested previously (32), we believe that in the medium term, gene trees will supersede pairwise orthology/paralogy predictions in most databases. And third, the growth in newly sequenced genomes will
further accelerate in the foreseeable future. To cope with this increase, orthology inference algorithms will have to become more efficient. We are currently looking at ways to bypass part of the all-against-all phase by propagating orthology predictions across related organisms, but other approaches will need to be explored as well if we are to someday predict orthology among 10 000 genomes. ACKNOWLEDGEMENTS
We thank all users of OMA and in particular those who have provided comments and suggestions. We also thank
Figure 3. The four types of ortholog grouping provided in OMA. (a) protein-centric view reports orthologs to a gene of reference; (b) genome pair view lists all orthologs between two species; (c) OMA group view displays sets of genes in which all pairs of genes are orthologs and (d) hierarchical groups, groups of genes that descend from a single common ancestral gene within a given taxonomic range.
the attendees of the PhyloSIB 2010 meeting for the stimulating discussions in the session ‘Scaling up to orthology prediction of 10 000 genomes’. Finally, we are grateful to Manuel Gil, Elke Shaper, Adam Szalkowski and the anonymous referees for their feedback on the article.
FUNDING
Funding for open access charge: The publication charges are funded through the lab’s ordinary budget.
Conflict of interest statement. None declared.
REFERENCES
1. Fitch,W.M. (1970) Distinguishing homologous from analogous proteins. Syst. Zool., 19, 99–113.
2. Koonin,E.V. (2005) Orthologs, paralogs, and evolutionary genomics. Annu. Rev. Genet., 39, 309–38.
3. Tatusov,R.L., Fedorova,N.D., Jackson,J.D., Jacobs,A.R., Kiryutin,B., Koonin,E.V., Krylov,D.M., Mazumder,R.,
Mekhedov,S.L., Nikolskaya,A.N. et al. (2003) The cog database: an updated version includes eukaryotes. BMC Bioinformatics, 4, Article no. 41.
4. Ostlund,G., Schmitt,T., Forslund,K., Ko¨stler,T., Messina,D.N., Roopra,S., Frings,O. and Sonnhammer,E.L.L. (2010) Inparanoid 7: new algorithms and tools for eukaryotic orthology analysis. Nucleic Acids Res., 38, D196–D203.
5. Li,L., Stoeckert,C.J.J. and Roos,D.S. (2003) Orthomcl: identification of ortholog groups for eukaryotic genomes. Genome Res., 13, 2178–2189.
6. Byrne,K.P. and Wolfe,K.H. (2005) The yeast gene order browser: combining curated homology and syntenic context reveals gene fate in polyploid species. Genome Res., 15, 1456–1461.
7. DeLuca,T.F., Wu,I.-H., Pu,J., Monaghan,T., Peshkin,L., Singh,S. and Wall,D.P. (2006) Roundup: a multi-genome repository of orthologs and evolutionary distances. Bioinformatics, 22, 2044–2046.
8. Wheeler,D.L., Barrett,T., Benson,D.A., Bryant,S.H., Canese,K., Chetvernin,V., Church,D.M., DiCuccio,M., Edgar,R., Federhen,S. et al. (2007) Database resources of the national center for biotechnology information. Nucleic Acids Res., 35, D5–D12. 9. Vilella,A.J.J., Severin,J., Ureta-Vidal,A., Durbin,R., Heng,L. and
Birney,E. (2009) Ensemblcompara genetrees: analysis of complete, duplication aware phylogenetic trees in vertebrates. Genome Res., 19, 327–335.
10. Penel,S., Arigon,A.-M., Dufayard,J.-F., Sertier,A.-S., Daubin,V., Duret,L., Gouy,M. and Perrie`re,G. (2009) Databases of homologous gene families for comparative genomics. BMC Bioinformatics, 10(Suppl. 6), S3.
11. Muller,J., Szklarczyk,D., Julien,P., Letunic,I., Roth,A., Kuhn,M., Powell,S., vonMering,C., Doerks,T., Jensen,L.J. et al. (2010) eggnog v2.0: extending the evolutionary genealogy of genes with enhanced non-supervised orthologous groups, species and functional annotations. Nucleic Acids Res., 38, D190–D195. 12. Uchiyama,I., Higuchi,T. and Kawai,M. (2010) Mbgd update
2010: toward a comprehensive resource for exploring microbial genome diversity. Nucleic Acids Res., 38, D361–D365. 13. Kriventseva,E.V., Rahman,N., Espinosa,O. and Zdobnov,E.M.
(2008) Orthodb: the hierarchical catalog of eukaryotic orthologs. Nucleic Acids Res., 36, D271–D275.
14. Huerta-Cepas,J., Bueno,A., Dopazo,J. and Gabaldo´n,T. (2008) Phylomedb: a database for genome-wide collections of gene phylogenies. Nucleic Acids Res., 36, D491–D496.
15. Datta,R.S., Meacham,C., Samad,B., Neyer,C. and Sjo¨lander,K. (2009) Berkeley phog: phylofacts orthology group prediction web server. Nucleic Acids Res., 37, W84–W89.
16. Dessimoz,C., Cannarozzi,G., Gil,M., Margadant,D., Roth,A., Schneider,A. and Gonnet,G. (2005) OMA, a comprehensive, automated project for the identification of orthologs from complete genome data: introduction and first achievements. In McLysath,A. and Huson,D.H. (eds), RECOMB 2005 Workshop on Comparative Genomics. Springer-Verlag, Berlin/ Heidelberg, Vol. LNBI 3678 of Lecture Notes in Bioinformatics, pp. 61–72.
17. Roth,A.C., Gonnet,G.H. and Dessimoz,C. (2008) The algorithm of OMA for large-scale orthology inference. BMC Bioinformatics, 9, 518.
18. Altenhoff,A.M. and Dessimoz,C. (2009) Phylogenetic and functional assessment of orthologs inference projects and methods. PLoS Comput. Biol., 5, e1000262.
19. Schneider,A., Dessimoz,C. and Gonnet,G.H. (2007) OMA Browser — exploring orthologous relations across 352 complete genomes. Bioinformatics, 23, 2180–2182.
20. Szalkowski,A., Ledergerber,C., Kra¨henbu¨hl,P. and Dessimoz,C. (2008) Swps3 - fast multi-threaded vectorized smith-waterman for ibm cell/b.e. and x86/sse2. BMC Res. Notes, 1, 107.
21. Kersey,P., Bower,L., Morris,L., Horne,A., Petryszak,R., Kanz,C., Kanapin,A., Das,U., Michoud,K., Phan,I. et al. (2005) Integr8 and genome reviews: integrated views of complete genomes and proteomes. Nucleic Acids Res., 33, D297–D302.
22. Flicek,P., Aken,B.L., Ballester,B., Beal,K., Bragin,E., Brent,S., Chen,Y., Clapham,P., Coates,G., Fairley,S. et al. (2010) Ensembl’s 10th year. Nucleic Acids Res., 38, D557–D562. 23. Kersey,P.J., Lawson,D., Birney,E., Derwent,P.S., Haimel,M.,
Herrero,J., Keenan,S., Kerhornou,A., Koscielny,G., Ka¨ha¨ri,A. et al. (2010) Ensembl genomes: extending ensembl across the taxonomic space. Nucleic Acids Res., 38, D563–D569. 24. Sayers,E.W., Barrett,T., Benson,D.A., Bryant,S.H., Canese,K.,
Chetvernin,V., Church,D.M., DiCuccio,M., Edgar,R., Federhen,S. et al. (2009) Database resources of the national
center for biotechnology information. Nucleic Acids Res., 37, D5–D15.
25. Goodstadt,L. and Ponting,C.P. (2006) Phylogenetic reconstruction of orthology, paralogy, and conserved synteny for dog and human. PLoS Comput. Biol., 2, e133.
26. Hoffman,M.M. and Birney,E. (2007) Estimating the neutral rate of nucleotide substitution using introns. Mol. Biol. Evol., 24, 522–531.
27. Dessimoz,C., Boeckmann,B., Roth,A.C.J. and Gonnet,G.H. (2006) Detecting non-orthology in the cogs database and other approaches grouping orthologs using genome-specific best hits. Nucleic Acids Res., 34, 3309–3316.
28. Karger,D.R. (1994) Random sampling in cut, flow, and network design problems. Proceedings of the twenty-sixth annual ACM symposium on Theory of computing. ACM, New York, NY, USA, pp. 648–657.
29. Harris,M.A., Clark,J., Ireland,A., Lomax,J., Ashburner,M., Foulger,R., Eilbeck,K., Lewis,S., Marshall,B., Mungall,C. et al. (2004) The Gene Ontology (GO) database and informatics resource. Nucleic Acids Res., 32, 258–261.
30. Barrell,D., Dimmer,E., Huntley,R.P., Binns,D., O’Donovan,C. and Apweiler,R. (2009) The goa database in 2009–an integrated gene ontology annotation resource. Nucleic Acids Res., 37, D396–D403.
31. Aguileta,G., Bielawski,J.P. and Yang,Z. (2006) Proposed standard nomenclature for the alpha- and beta-globin gene families. Genes Genet. Syst., 81, 367–371.
32. Gabaldo´n,T. (2008) Large-scale assignment of orthology: back to phylogenetics? Genome Biol., 9, 235.