Determinants of Antibody Specificity
By
Ryan L. Kelly
B.S. Chemical and Biomolecular Engineering University of California, Los Angeles, 2012
MASSURSISISTITUTE OF TECHNOLOGY
JUL 12 2017
LIBRARIES
ARCHIVES
Submitted to the Department of Biological Engineering in partial fulfillment of the requirements for the degree of
Doctor of Philosophy in Biological Engineering
at the
Massachusetts Institute of Technology
June 2017
2017 Massachusetts Institute of Technology All rights reserved
Signature of Author: ...
Certified by: ...
Signature redacted
Ryan L. Kelly
Department of Biological Engineering
May 22, 2017
Signature redacted
K. Dane Wittrup
C.P. Dubbs Professor of Chemical Engineering and Biological Engineering
Thesis Advisor
Certified by:...
Signature redacted
...
Mark Bathe Assoiate Professor of Biological Engineering Graduate Academic Program Chair77 Massachusetts Avenue (amhridgc, MA 02129
http://ibraries.mit-edu/ask
DISCLAIMER NOTICE
Due to the condition of the original material, there are unavoidable
flaws in this reproduction. We have made every effort possible to
provide you with the best copy available.
Thank you.
The images contained in this document are of the
best quality available.
Thesis Committee Members
Bruce Tidor, Ph.D. (Chair)
Professor of Biological Engineering and Computer Science Massachusetts Institute of Technology
Bernhardt Trout, Ph.D.
Raymond F. Baddour Professor of Chemical Engineering Massachusetts Institute of Technology
Determinants of Antibody Specificity
By
Ryan L. Kelly
Submitted to the Department of Biological Engineering on May 22, 2017 in partial fulfillment of
the requirements for the degree of Doctor of Philosophy in Biological Engineering
Abstract
High throughput screening methods such as yeast surface display (YSD) are frequently able to isolate high affinity antibodies against clinical targets; however, the success of these candidates depends on selecting for both on-target binding and desirable biophysical characteristics.
Development liabilities, including antibody aggregation and nonspecificity, can lead to problems during production and poor pharmacokinetics (PK). The exact structural and sequence
determinants causing this poor developability are unknown, which leads to inexact methods to correct otherwise promising clinical candidates. In this thesis we outline the development of high throughput methods to interrogate developability of candidate antibodies on the surface of yeast and apply these methods to both determine the causes of nonspecificity and create new libraries with improved biophysical properties.
We first analyzed methods for early stage assessment of monoclonal antibodies, finding a polyspecificity reagent (PSR) binding assay on the surface of yeast which can accurately predict antibody clearance rates in mice. While robust, this assay relies on production of a poorly defined mixture of protein components, and thus, we next looked at potential alternatives to a multicomponent PSR reagent. We found that chaperone proteins may work as well-defined, easily producible reagents with similar broad predictive power to predict downstream antibody behavior.
Next, we applied these assays to assess core determinants of nonspecificity. We first analyzed a case study of two antibodies with identical target antigens but vastly different performance on preclinical assessments of biophysical characteristics. Through this matched case, we found differences in clearance rates can be driven wholly by variable-region mediated effects independent of neonatal Fc receptor (FcRn) binding. Focused on the antibody variable region, we next utilized our nonspecificity assay as a sorting tool to look at a naive repertoire library. We found significant nonspecificity in the VH6 class of antibodies, driven by a poorly behaved complementarity determining region (CDR) H2 sequence. Subsequently, we applied a similar sorting technique to two synthetic library designs to identify a set of motifs that can drive
nonspecificity. These included motifs containing tryptophan, valine, glycine and arginine located in CDR H3. We then applied these discoveries to the design of a new, semi-synthetic single chain variable fragment (scFv) library and demonstrated its ability to isolate high affinity,
highly specific candidate clones against a panel of antigens. Finally, we explored the use of an
alternate yeast display system capable of easily switching between scFv-Fc display and secretion, which may aid in the rapid development and testing of candidate antibodies.
Taken in whole, the work in this thesis aids the clinical development of antibodies. We have presented both methods to assess nonspecificity at an early stage in the development
process as well as a set of motifs to be eliminated in future library designs. With these combined findings, we hope to increase the utilization of in vitro screening methods such as yeast display for the isolation of clinical candidate antibodies with favorable biophysical characteristics.
Thesis Advisor: K. Dane Wittrup
Acknowledgements
I would like to first thank my advisor, Dane Wittrup, for his unwavering support, optimism, and
scientific insight which both made this thesis possible and the process a most enjoyable experience. I have learned more in the past five years than any other period of my academic career, and this is in major part due to his guidance and help, especially as I have started my path as an antibody engineer. My thesis committee members, Bruce Tidor and Bernhardt Trout, have always provided useful guidance and advice throughout the course of this work.
I am additionally indebted to all of my collaborators and mentors who have shaped this work. I
would like to thank James Van Deventer for helping me out as I began in the lab and for being a wonderful person to work with. The entire team at Adimab has been essential to the completion of this work, and I thank them for allowing me access to their considerable expertise and resources. I also had the opportunity and privilege to mentor three talented undergraduates, Doris Le, Jessie Zhao, and Taska van Swol, and each of them made vital contributions to this work.
My time in Boston has been nothing but a pleasure, and this is in no small part due to all of the
friends I have made here. To all of the members of the Wittrup lab, you have made coming to work each day rewarding and entertaining, even on the days when science was not on our side. To all the members of the Biological Engineering department, especially the class of 2012, you have been one of the most welcoming and talented groups of people I have known, and always given me the time away from science I needed to stay sane. To Frances, thank you for your love, support, and companionship on all of our escapades.
Finally, thanks to my parents for their constant love and support. I certainly would not be where
Table of Contents
Chapter 1: Introduction... 11
Antibody Structure... 12
Antibody Isolation M ethods ... 13
Com ponents and current understanding of developability ... 14
Aggregation Propensity ... 14
Therm al Stability ... 15
Specificity ... 16
M otivation and Goals... 17
Thesis Overview ... 18
Chapter 2: High throughput cross-interaction measures for human IgGI antibodies correlate with clearance rates in m ice ... 19
Abstract ... 19
Introduction... 20
Results... 21
Measurement of clearance rates in mice for a panel of human IgG1 antibodies ... 21
Correlation of early development tests to mouse clearance rates ... 22
A m inim alist set of early stage assays to predict developability ... 23
Discussion ... 23
M aterials and M ethods... 26
Determ ination of clearance in m ice ... 26
Cross-interaction chrom atography (CIC). ... 27
Polyspecificity reagent binding assay (PSR M FI) ... 27
Clone self-interaction by bio-layer interferom etry (CSI-BLI)... 28
Affinity-capture self-interaction nanoparticle spectroscopy (AC-SINS). ... 28
Long-term stability size exclusion chromatography (SEC) slope. ... 28
Statistical Analysis... 28
Figures... 30
Chapter 3: Chaperone proteins as single component reagents to assess antibody nonspecificity 41 A bstract ... 41
Introduction... 41
Results & D iscussion ... 42
M aterials & M ethods ... 44
Yeast Display Immunoprecipitation (YDIP) and Mass Spectrometry ... 44
Production of Chaperone Proteins ... 45
A ntibody Reagents... 45
Chaperone and polyspecificity reagent (PSR) binding assay ... 46
A cknow ledgem ents... 46
Chapter 4: Target-independent variable region mediated effects on antibody clearance can be FcRn independent ... 47
Abstract ... 47
Introduction... 48
Results... 49
A pplication of early stage developability assays ... 49
FcRn A ffinity M easurem ent via biolayer interferom etry ... 49
M easurem ent of pharm acokinetics in FcRn knockout m ice... 51
D iscussion ... 51
M aterials and M ethods... 53
A ntibody Production and Purification ... 53
Developability A ssays ... 54
IgG Binding Experim ent... 54
F(ab')2 Binding Experim ents ... 54
Determ ination of clearance in m ice. ... 55
Figures... 56
Chapter 5: Nonspecificity in a naive hum an scFv repertoire... 65
Abstract ... 65
Introduction... 66
Results ... 67
N aive library panning reveals enrichm ent of the VH6 fam ily... 67
Nonspecific binding is driven by CDR H2... 68
Hom ology m odeling of the VH6 CDR H2 segm ent... 69
Discussion ... 69
M aterials and M ethods... 70
Antigen preparation ... 70
Yeast display experim ents ... 71
Clone Analysis ... 71
M utant construction ... 72
M odeling. ... 72
Figures... 73
Chapter 6: Eliminating motifs that cause nonspecificity improves antibody library design and perform ance ...
A b stract...
Introduction...
R esu lts...
Sorting a synthetic library reveals prevalence of Trp in CDR H3 of nonspecific clones... Constructing a tryptophan rich library based on the natural diversity... Nonspecificity sorting of a Trp rich library ... Tryptophan, Glycine and Valine are enriched at the center four positions ... Tryptophan, Glycine, and Valine motifs are enriched in nonspecific antibodies... Isolating binders from a library lacking tryptophan ...
80 80 81 82 82 82 83 84 84 85
Construction of a new library which minimizes cross-interaction prone motifs ... 86
Discussion ... 86
M aterials and M ethods... 88
Antigen Preparation ... 88
Library Construction... 89
Yeast display experim ents ... 90
Loop Swapping library construction... 91
M otif Library Construction... 91
Data Analysi.s ... 92
Sequencing ... 92
Figures... 93
Supplem entary Data... 101
Chapter 7: A switchable yeast display/secretion system ... 106
Abstract ... 106
Introduction... 107
Results ... 108
Switchable Display/Secretion Platform ... 108
M odel selections ... 109
Library construction and screening... 109
Polyclonal reagent production and binding characteristics ... 110
Characteristics of isolated clones... 111
Discussion... 112
M aterials and m ethods ... 113
M edia preparation, plate preparation, and yeast electroporation... 113
Yeast strain construction... 113
Plasm id construction... 114
Yeast library construction ... 115
Induction of yeast display ... 116
A ntigen production ... 117
Flow cytom etric analysis and sorting ... 117
M odel selections ... 117
Library screening and clone isolation... 118
Affinity characterizations on the yeast surface ... 118
scFv-Fc secretion and purification... 119
Enzyme-linked immunosorbent assay (ELISA) quantitation of secretion ... 120
Affinity characterizations on the m am m alian cell surface ... 120
Statistics ... 121
Figures... 122
Chapter 1: Introduction
Antibodies are a class of affinity reagents which have been useful biological tools for many years. In the natural immune response, antibodies play a key role in specific antigen recognition,
allowing for fine distinction between self and foreign proteins. Because of this specificity as well as their role in aiding the immune response, antibodies have been widely used as therapeutic reagents, especially in oncology applications"2
. To date there are almost forty FDA approved antibody therapies, with hundreds more in clinical development. Antibodies, and specifically monoclonal antibodies (mAbs), are one of the fastest growing classes of pharmaceuticals, with
3 excess of $50B in revenue in 2012 and projected 8% annual growth in the coming years
Because of their promise as biotherapeutics, efficient discovery and development of mAbs has been a research priority for many years. The majority of antibody discovery is currently achieved through hybridoma technology, which relies on immunization of mice or other animals. More recently, methods of in vitro isolation of mAbs from libraries with synthetic diversity or diversity based off the natural repertoire have come to maturation. These methods include phage and yeast display, which rely on the display and selection of antibodies or
antibody fragments in a process which aims to mimic natural clonal selection. While there have been successes from display technologies, most notably the top selling antibody Humira, there are still significant barriers which prevent wide adoption of the technology.
Some in the field attribute the dominance of hybridoma technology to familiarity and simplicity as it was implemented first4, but there may be a more fundamental force at play. Antibodies emerging from display technologies have a greater development risk, with a significantly higher percentage of clinical candidates failing in clinical trials compared against candidates derived from hybridomas (12.5% success vs. 29%)3. These failures have been attributed to three main categories, aggregation, thermal instability, and nonspecificity, which collectively are often referred to as developability. A better fundamental understanding of developability will lead to improved antibody design processes and viable clinical candidates.
Antibody Structure
The antibody is a key player in the adaptive, or humoral, immune response. Naive B cells express one of a library of antibodies in the form of a B cell receptor (BCR). Upon antigen challenge, B-cells displaying antigen binding receptors will proliferate, facilitating the process of clonal selection. This process is iterative and ultimately leads to the production of plasma cells which secrete the soluble form of the BCR, an immunoglobulin (Ig).
The immunoglobulin protein is a heterotetramer, consisting of two identical heavy chains and two identical light chains. While there are multiple classes of Ig as determined by their heavy chain, in this work we will primarily focus on the IgG class, which represents the majority of secreted Ig molecules and the primary class for therapeutics. The overall structure of the
protein (Fig la) resembles a "Y" shape with the two arms comprising the antigen binding Fab region and the stalk comprising the constant Fc region. The overall mass of the protein is
-150kDa; each heavy chain has a mass of -50kDa and consists of four major domains, while the .5
light chains each have mass of -25kDa and consists of two major domains .
H1 -'Hi-H2 ~ ~ H3 (VH
B3
L2 RLlFigure 1. 1: The structure of an antibody. a) Overall structure of IgG, highlighting major fragments used as binding scaffolds. Complementarity determining regions (CDRs) are highlighted in red b) Organization of the CD Rs at the tip of the variable domain. Size of bubble represents, extent of diversification within synthetic library design .
The Fc region is responsible for many of the effector functions of the IgG though its affinity for Fcy receptors7, while antigen binding is driven by regions at the tips of the Fab regions. The Fab consists of the variable and first constant domain of a heavy chain in a
disulfide stabilized heterodimer with the variable and constant domain of a light chain. Nearly all of the diversity in antibody repertoires is found in the N-terminal variable domains, and more specifically in isolated hypervariable loops which lie at the tip of the antibody8. There are six of these loops which define the binding interface of the antibody, often termed complementarity determining regions (CDRs) because of their role in antigenic determination.
Three CDRs are contributed by each the heavy and light chain, with CDRs LI, L2, HI, H2 lying at the periphery and CDRs H3 and L3 in the center of the binding interface (Fig lb)9.
As suggested by their central location, H3 and L3 play a dominant role in binding interactions and antigenic determination, with H3 playing a larger role between the two''". This dominant role is also reflected in both the natural repertoire8 and synthetic library designs6"213, with the majority of antibody diversity found within the H3 and to a lesser extent L3 regions.
Antibody Isolation Methods
There are two primary methods of therapeutic antibody isolation: immunization of animals followed by production of hybridomas or selection of antibodies in vitro from a display library. The older and more prevalent method, hybridoma technology, relies on the
immunization of mice with an immunogenic formulation containing the antigen of interest. After sufficient time, splenic B cells are isolated and fused with a cancerous myeloma line to
confer immortality. Secondary screens for proper binding are then necessary to isolate
monoclonal populations of antibodies. Recent advancements have allowed for the expression of part of or the entire human Ig gene in mice, allowing for direct isolation of human antibodies from mice' 1 . While hybridoma technology has the advantage of highly developable antibody products with favorable biophysical characteristics, there is little control over the process.
In contrast to hybridoma technology, phage display was developed to mimic to the natural antibody selection process as a more rapid and controllable method to isolate antibody reagents12. In phage display, an antibody library is expressed on the surface of phage and enriched via iterative binding cycles against the antigen of interest. Multiple alternate display technologies have also been developed, including yeast display, mRNA display, and ribosome
display16. The success of display technologies relies on a robust library design, with most libraries designed either as a mimic of the natural human repetoirel3,17,18 or from simplified
design principles12,19. The control provided by display technologies has successfully led to the isolation of high affinity reagents; however without counter selections for biophysical properties, these antibodies often show problems in development.
Components and current understanding of developability
A newly coined term, developability refers to the ability of an antibody to translate from
discovery to use in the clinic. In practice, this is measured as outcomes including production titers, storage stability, and pharmacokinetic and pharmacodynamics profiles. While many
attributes of the antibody play a role in developability, most characterizations have focused on three major components: thermal stability, aggregation propensity, and specificity. Much of the
current knowledge of the structural and sequence determinants of these phenomena has focused on individual case studies, with few examples of fundamental interrogation of the phenotype.
Aggregation Propensity
The propensity of an antibody to aggregate plays a critical role in production, as therapeutic antibodies must be produced in large quantities and stored at high concentrations (-50mg/mL) to facilitate dosing20. Additionally, protein aggregates are immunogenic and can lead to an adverse reaction against the therapeutic21 While some case studies have found unique causes for
252
aggregation27, the majority of work has focused on patches of exposed hydrophobic residues as the main cause. Computational methods which predict aggregation prone regions (APRs) in antibodies have been successfully utilized to reduce aggregation28-30, however these efforts have
been primarily focused on engineering the constant region of the antibody. Aggregation has been alleviated by the addition of hydrophilic29
or charged3
1 residues to APRs.
Efforts to reduce aggregation due to APRs within the CDRs has seen success as well, mostly by flanking or replacing these regions with charged residues. In antibodies targeting the hydrophobic amyloid beta protein, the addition of aspartic and glutamic acid residues at the edges of the amyloidogenic CDR3 in some cases completely ablated antibody aggregation3 2 3 3 Interestingly, the same effect was not seen when flanking the CDR with positive charge. Looking at VH only domains, a similar trend has emerged, with the insertion of negative
residues in CDR HI and L2, but not H2 or L1, leading to decreased aggregation propensity20,34 Taken in whole, aggregation is most often caused by exposed hydrophobic regions, and can be
alleviated by mutating to or surrounding APRs by negatively charged residues, which presumably aid in charge-charge repulsion effects between the antibodies.
Traditional assays to assess antibody aggregation include long term stability studies at high concentrations, static and dynamic light scattering, and analytical ultracentrifugation5 36 These methods are low throughput and often require large quantities of reagent, requiring
significant investment of time and resources. More recently, higher throughput assays have been developed, including self and cross interaction chromatography. These assays rely on correlation between aggregation propensity and retention time from a column coated in either the antibody of interest (self) or a polyclonal mixture of antibodies (cross)37
-39. The self-interaction assay was adapted to a bio-layer interferometry format with similar results40. The most high throughput assay reported to date, termed self-interaction nanoparticle spectroscopy (SINS), involves nonspecific loading4 '2 or affinity capture4 3,44 of candidate antibodies to gold nanoparticles. Aggregation prone antibodies will drive the gold particles to associate and cause a measurable
shift in the plasmonic wavelength of the nanoparticles, which is then quantified against a negative control45.
Thermal Stability
Thermal stability of antibodies is quantified by their melting temperature (Tm) and is a correlate for conformational stability46. Within the natural selection process, thermal stability is
selected for along with increased affinity, with many of the stabilizing mutations found outside of the core of the binding interface4 7. Using VH or VL only constructs displayed via phage display, Dudgeon et al. demonstrated that pools selected for enhanced thermal stability show an increase in overall negative charge and a decrease in exposed hydrophobicity and beta sheet propensity48'49. Significant differences in sequence pools were found at positions in all CDRs,
Specificity
While designed to bind to one specific antigen, some antibodies can bind nonspecifically to other proteins and surfaces, often with a much lower affinity. This nonspecificity can lead to
off target effects, or more often an accelerated clearance rate due to nonspecific tissue binding50. While not desired in affinity matured antibodies, polyspecificity exists in the natural antibody
repertoire as a means for broad antigen recognition. Studies on this pool of antibodies reveal often elongated CDR H3 regions, which are hypothesized to allow for greater flexibility in antigen recognition2,53. Long, flexible CDRs are also found in many broadly neutralizing antibodies against virus targets such as influenza and HIV, as it is believed many of these proteins engage specific proteins on the virus surface in addition to nonspecific binding to the virus coat 54-56
In addition to understanding gained from naturally occurring polyspecific antibodies, in the course of synthetic library design various binary amino acid codes have been tested in the context of the CDRs. Successful designs included binary codes of Tyr, Trp, Arg, and Phe with Ser in CDR H3. Of these libraries, the RS library and to a lesser extent the WS library displayed increased nonspecificity, suggesting a role for positive charge or large aromatic residues in nonspecificity5 7 . Additionally, substitution of Ser for Gly increased nonspecificity in all contexts, agreeing with the hypothesis of greater flexibility leading to nonspecificity58.
Traditional methods of assessing specificity include measuring binding of antibody to tissues59 or a panel of representative non-cognate antigens58. More recently it has been
discovered that general protein preparations can also serve as nonspecificity reagents. Binding of antibodies to baculovirus particles in an ELISA format correlates remarkably well with a phenotype as complex as clearance rate in humans60 and a high throughput assay using a membrane preparation from HEK cells on the surface of yeast also serves as an effective predictor of nonspecificity in displayed antibodies6 1.
Motivation and Goals
While there have been significant advances in understanding the determinants of antibody developability, we still do not have a predictive model to anticipate developability of selected clones from library isolations. This gap in knowledge has especially hampered screening from display libraries, where there is no natural counter selection for developability. Additionally, because most work has solely focused on isolating therapeutic candidates, the majority of the current knowledge has come from improvement of poorly behaved antibodies isolated from hybridoma or display screens.
Less is known about the determinants of specificity, with most work pointing to longer and more flexible CDR H3s or the prevalence of arginine in the CDRs. The long CDR H3s of natural polyspecific and broadly neutralizing antibodies (often >30AA) are much rarer or nonexistent in library designs, and as such are not useful in predicting specificity of therapeutics isolated from library screens. While higher arginine levels lead to nonspecific binding, still little is known about exactly which CDRs contribute to the phenotype, how many arginine residues are sufficient to cause nonspecificity, and whether there are other motifs or residues which drive nonspecificity. Additionally, it is not known whether arginine in particular is responsible, or rather it is a charge effect which could also be replicated by lysine residues.
A more principled understanding of the exact causes of both aggregation and
nonspecificity will allow for improved library design and a greater likelihood that candidates emerging from display technologies are suited for clinical development. Most developability screens are relatively low throughput, and it is the goal of this work to first establish screening methods to assess aggregation and nonspecificity via display technologies, specifically yeast display. Such an assay will allow for the screening of large antibody libraries to isolate pools of poorly behaved antibodies. These pools will provide far greater sequence information than the limited number of clones currently analyzed, and allow for the deployment of machine learning algorithms to analyze in much greater detail exact structural contributions to both phenotypes. Just as Lipinski's Rules became an ingrained set of design rules for small molecule drug development 2, it is the main goal of this work to develop a set of design rules for antibody development.
Thesis Overview
In this thesis we first analyzed methods for early stage assessment of mAbs, finding a polyspecificity reagent (PSR) binding assay on the surface of yeast which can accurately predict
antibody clearance rates in mice (Chapter 2). We next look at potential alternatives to a multicomponent PSR reagent, finding that chaperone proteins may work well as well-defined, easily producible reagents with similar broad predictive power to predict downstream antibody behavior (Chapter 3). Next, we apply these assays to assess core determinants of nonspecificity, first analyzing a case study of two antibodies with identical target antigens but vastly different performance on preclinical assessments of biophysical characteristics. Through this matched
case, we show differences in clearance rates can be driven wholly by variable region mediated effects independent of neonatal Fc receptor (FcRn) binding (Chapter 4). We next utilize our nonspecificity assay as a sorting tool to look at a naive repertoire library, finding significant nonspecificity in the VH6 class of antibodies, driven by a sticky H2 sequence (Chapter 5).
Subsequently, we applied a similar sorting technique to two synthetic library designs, identifying a set of motifs which can drive nonspecificity. We then applied these discoveries to the design of a new, semi-synthetic scFv library and demonstrated its robustness by isolating candidate clones against a panel of antigens (Chapter 6). Finally, we explored the use of an alternate yeast display system capable of easily switching between scFv-Fc display and secretion, which may aid in the rapid development and testing of candidate antibodies (Chapter 7).
Chapter 2: High throughput cross-interaction measures for human IgGi
antibodies correlate with clearance rates in mice
The following appears as published in mAbs.63
Abstract
Although improvements in technology for the isolation of potential therapeutic antibodies have made the process increasingly predictable, the development of biologically active monoclonal antibodies (mAbs) into drugs can often be impeded by developability issues such as poor expression, solubility, and promiscuous cross-reactivity. Establishing early stage developability screening assays capable of predicting late stage behavior is therefore of high value to minimize development risks. Towards this goal, we selected a panel of sixteen monoclonal antibodies (mAbs) representing different developability profiles, in terms of self- and cross-interaction propensity, and examined their downstream behavior from expression titer to long-term stability and pharmacokinetics in mice. Clearance rates showed significant rank-order correlations to two cross-interaction related assays, with the closest correlation to a non-specificity assay on the surface of yeast. Additionally, two self-association assays correlated with each other but not to mouse clearance rate. This case study suggests that combining assays capable of high
throughput screening of self- and cross-interaction early in the discovery stage could significantly lower downstream development risks.
Introduction
Development of a lead antibody candidate into a therapeutic drug is a long, expensive, and risky process. Many mAb candidates have failed development ultimately due to lack of drug-like biophysical properties; i.e. poor expression and manufacturability, low stability and solubility, high viscosity and fast serum clearance. To minimize downstream risks, predictive assays have been developed and applied to screen for desirable biophysical properties early in the development process prior to moving the lead molecule(s) forward. Among these assays, some are designed to identify mAbs that cross-interact with a diversified population of proteins distinct from their specific binding targets. For example, cross-interaction chromatography
(CIC) is designed to test weak cross-interaction of a mAb when flowing through a column
coupled with human serum polyclonal antibodies.38 Late elution is indicative of exposure of interaction-prone surfaces in the mAb that are capable of non-specific binding, a result often linked to poor solubility. A similar ELISA-based approach uses the membrane proteins
presented on the surface of a baculovirus particle (BVP) as a reagent to capture mAbs with cross-interaction propensity.60 BVP binding correlates well with faster serum clearance.2 Similarly, soluble membrane proteins (SMP) have been developed primarily as an early discovery stage polyspecificity reagent (PSR), enabling negative sorting during in-vitro mAb selection to guide the binding population away from non-specificity, or to perform post-selection characterization
for individual mAbs.6 1
Complementary assays have also been devised to measure mAb self-interaction. Due to the low binding affinities of self-interaction between Fab:Fab or Fab:Fc, either sensitive
analytical tools or high concentrations of mAbs are necessary to directly observe mAb self-association. For example, BIACORE64
and Biolayer Interferometry (BLI)40 have been used for real-time observation of self-association and dissociation of mAbs. Self-binding responses observed by clone interaction BLI (CSI-BLI) correlate well with HPLC-based
self-interaction chromatography retention times. However, the BLI-based self-binding assay can be done in a high throughput manner with much less material consumption. Alternatively, direct observation of mAb self-interaction is enabled by gold nanoparticles using self-interaction nanoparticle spectroscopy (SINS).41,4 3
,65 The mAb of interest is loaded directly4 2
or through capturing antibodies (Affinity capture SINS, AC-SINS),44 to the surface of gold nanoparticles. The mAbs prone to self-association cause clustering of nanoparticles, which can be monitored by
plasmon wavelength shift. These assays targeting mAb self-interaction are useful tools during formulation screening for best buffer composition to minimize mAb self-interaction, which is important during development of formulations for subcutaneous administration and mAb storage condition scouting for longer shelf life.
Here we report a case study of sixteen mAbs found previously to exhibit varying degrees of self- and cross-interaction as assessed by a panel of high-throughput assays. Their
downstream behaviors such as expression titer, aggregation propensity and mouse serum clearance show interesting correlation with these assay predictions, with pharmacokinetics (PK) correlated to cross-interactions metrics, and self-interaction assays forming a self-correlated cluster.
Results
Measurement of clearance rates in mice for a panel of human IgGI antibodies
Sixteen fully human or humanized IgG1 mAbs against multiple targets were either discovered at Adimab (n=12) or expressed recombinantly from published variable region
sequences (fully human: ganitumab6 6, olaratumab66; humanized: mepolizumab67,
motavizumab66). To explore the impact of the variable region in a common context, all of these mAbs were expressed as IgGI in a HEK 293 cell line and purified by Protein A. This panel was chosen to represent four distinct developability profiles based on their early performance in self-and cross-interaction detection assays. Using a cutoff of 500 for PSR MFI self-and of 5 nm for
AC-SINS we find that seven mAbs exhibit low levels of both low self- and cross-interaction; four
mAbs show high self- and cross-interaction; three mAbs show high cross-interaction but low self-interaction; and two mAbs show low cross-interaction but high self-interaction. These determinations were guided by previous work using the PSR and AC-SINS assays.4 36 1 Prior to long-term stability or mouse serum clearance studies, IgG samples with SEC monomer
percentage below 90% were subjected to a second step polishing to achieve greater than 90% purity.
All of the antibodies recognize human- (n=15) or virus- (n=1, motavizumab) derived
targets, and the absence of mouse cross-reactivity was validated prior to pharmacokinetic evaluation to minimize possibility of target-mediated clearance. The panel displayed a wide range of clearance values (Fig 1), with seven antibodies having a clearance rate greater than 20 mL/day/kg, a value determined by analysis of receiver operating characteristic (ROC) curves and other considerations (see below) These reported clearance values fall within the expected range for IgG 1 clearance rates in mice.6 -7 0 The full set of pharmacokinetic curves is displayed in Supplementary Figure 1.
Correlation of early development tests to mouse clearance rates
Prior to pharmacokinetic studies, the panel of antibodies was subjected to a range of early
development assessments. This included PSR median fluorescence intensity (PSR MFI),6' AC-SINS Amax,4 3 CIC retention time,38 size exclusion column (SEC) retention time, CSI-BLI response,40
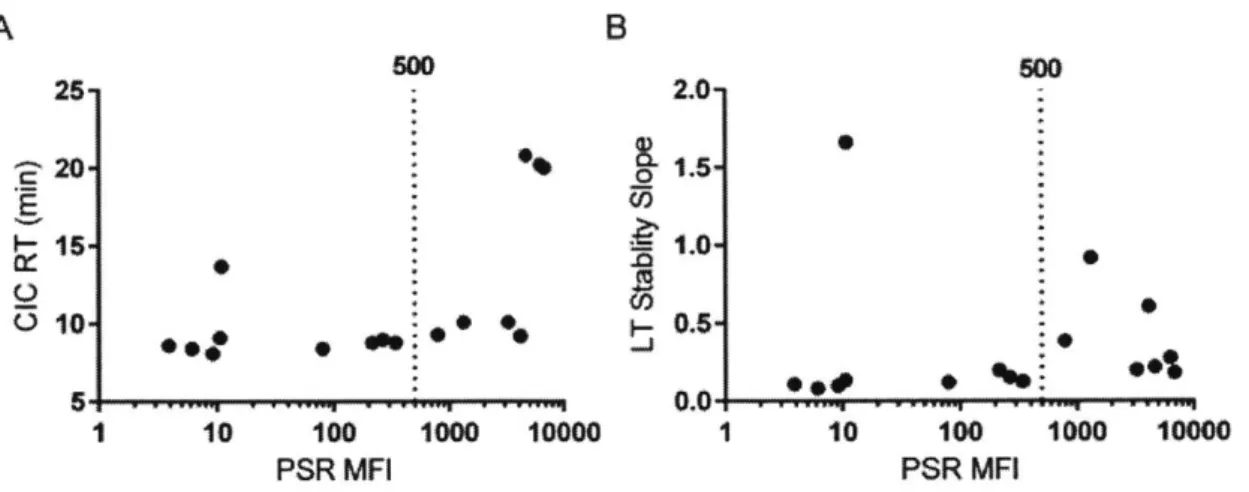
long-term solubility aggregation slope in PBS, and purification titer. The full data set is summarized in Table 1. Of these assays, three showed a significant Spearman rank correlation to mouse clearance rates: PSR binding, CIC retention time, and long-term stability slope (Table 2). Of these three, clearance rate was correlated most strongly to PSR reagent binding (Fig 2a,
Spearman's p=0.72). We additionally performed ROC analysis and Fisher's Exact Test for the PSR assay using a clearance cutoff of 20 mLlday/kg (Fig 2b). This clearance cutoff was chosen based on a combination of allometric scaling and previously reported cutoffs used in cynomolgus monkeys and humans.60,71,7 2 The sum of the true positive and true negative detection rate was
maximized at an MFI value of approximately 500. At this threshold, 14 of the 16 antibodies were correctly identified as true positives (n=6) or true negatives (n=8), while there was one false positive and one false negative. The associated maximum likelihood for the odds ratio is 48.0 [Fisher's Exact Test, 95% confidence interval (2.47, 933)]. The exclusion of 1 in the confidence interval implies statistical significance, and additionally the standard error in the clearance measurement for each of the false predictions was within the range of the decision boundary.
A minimalist set of early stage assays to predict developability
An additional goal of this work was to establish a minimal set of early stage assays to
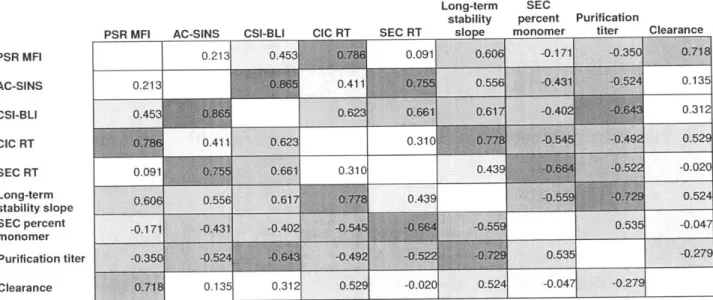
effectively predict developability of a candidate antibody. Towards this goal we have analyzed the correlations and redundancies amongst the tested metrics. The assays broadly fell into two categories, cross- and self-interaction assessment. The two cross-interaction metrics that
correlated to clearance (PSR binding, CIC retention time), also correlated with each other (Table 2). The relationship between the PSR and CIC assays has been reported prior with a larger set of antibodies61 and was confirmed in the new set (Fig 3a, Spearman's p=0.79). Additionally, the PSR assay correlated with long-term stability (Fig 3b, Spearman's p=0.61), which was less expected as long-term stability is thought to be a more accurate test of self-interaction as it measures aggregation in a relatively pure preparation.
The remaining metrics, all related to aggregation propensity, correlated with the
AC-SINS assay as well as with each other (Table 2). The AC-AC-SINS correlated the strongest to the
CSI-BLI assay (Fig 4a, Spearman's p=0.87) as expected, as these two assays are identical in all but the format and sensitivity for measurement. The AC-SINS assay also correlated well with relevant antibody production parameters, including SEC retention time (Fig 4b, Spearman's p=0.75), antibody purification titer (Fig 4c, Spearman's p=-0.43) and percent monomer after purification (Fig 4d, Spearman's p=-0.52).
Discussion
One of the primary goals of this work was to identify early stage developability assays capable of predicting relative antibody clearance rates of candidate therapeutic antibodies. Previous work found strong correlation between a non-specificity ELISA binding score using baculovirus particles (BVP) and clearance rates in human and cynomolgus monkeys.60 In the course of development of the PSR assay used in the current work, PSR was shown to correlate to the baculovirus ELISA.6' In this work we have further confirmed that these two assays measure
related antibody properties, finding that the PSR assay does indeed correlate to clearance rates, in this case in mouse. This is true both using Spearman rank correlation (Spearman's p=0.72, P value=0.002) as well as Pearson correlation comparing log(PSR MFI) with log(clearance rate) (Pearson's R=0.73, P value=0.001). While not formally demonstrating equivalency between the
BVP and PSR assays, these results further support the use of PSR binding as an early predictor of antibody developability. (Direct pharmacokinetic measurements in cynomolgus monkeys and humans are beyond the scope of this work.) As an important caveat to the conclusions and correlations presented here, the data set was relatively small (n=16) and as such any outliers have a strong effect on the calculated correlations.
Clearance rates also correlated to ranking on the CIC assay (Supplementary Figure 2A) and to a lesser extent by the long-term stability slope (Supplementary Figure 2B). Broadly, CIC and long-term stability, along with the PSR assay, can serve as cross-interaction or specificity metrics. It was not unexpected that the PSR and CIC assays would give similar readouts, as their correlation had been shown prior to this work.61 The association of these two assays to long-term stability slope is more unexpected, as there is no obvious explanation as to why a measure of long-term aggregation propensity should correlate to specificity unless there is an inherent overlap between these two mAb characteristics. This correlation was weaker, and may be an artifact of the smaller set of antibodies used in the study. Exploration of this relation in a much expanded set of antibodies is the subject of ongoing research in our laboratories and will be reported in due course.
The remaining five metrics, AC-SINS, CSI-BLI, SEC retention time, purification titer, and percent monomer, poorly correlated to clearance rates but all showed correlations with each other. These assays fall under the category of self-association or aggregation metrics. The tight correlation between the AC-SINS and CSI-BLI assays was expected, as they are similar assays and differ only in the format and sensitivity of self-binding. The correlation to SEC retention time is likely explained by the increase in exposure of non-specific binding interfaces in aggregation-prone antibodies due to colloidal instability. These exposed surfaces interact favorably with the SEC resin, leading to a longer retention time. Lower colloidal stability may also explain the correlation of AC-SINS to both percent monomer and purification titer. The proteins with greater aggregation propensity will be more likely to be degraded in the secretion process by quality control mechanisms, and additionally this will affect the total monomer fraction in the portion that is successfully secreted.
Pharmacokinetics of antibodies are largely dictated by interaction with FcRn,73 a fact that has been exploited in the past by Fc engineering.776 However, as the current work and others
have shown, antibodies with identical Fc sequences but different variable regions can exhibit disparate pharmacokinetics parameters in wild type mice as well as in other organisms.77 7 8 I particular, the notion that antibodies with poly-reactive2 4 or highly cross-reactive profiles2 tend
to have faster serum clearance gains further support from the data in this work. While perhaps less appreciated, there are also reports that the interaction of FcRn with antibodies with matched Fc regions but differing variable region sequences could vary.79'80 Of particular interest is the
observation that the strength of the IgG-FcRn interaction at neutral pH (7.3) correlates negatively with half-life in multiple species and across several series of antibodies.80 The weak interactions with FcRn at neutral pH reported in this work might be similar to the nonspecific interactions
measured by PSR and BVP.
Additionally, it has been previously reported that a combined metric of high
hydrophobicity in certain CDRs or an extreme charge at endosomal pH can be a predictor of clearance in cynomolgus monkey,81 however this metric exhibited poor predictive power on the current set using the cutoff of 20 mL/day/kg clearance rate in mice. This metric correctly predicted faster clearance in 1 of 7 mAbs (14%) and normal clearance in 5 of 9 (56%) mAbs (Supplementary Figure 3A). Additionally, as reported before, there was no correlation between antibody pI and clearance rate (Supplementary Figure 3B).
Comparison of the various early development tests reveals two major groups of assays with significant internal redundancy, suggesting that selecting one assay from each class would be sufficient as an early indication of antibody developability. Of the two groups, cross- and self-association, it is of benefit to select the assay with highest sensitivity and ideally throughput, so it can be applied at the earliest possible stage of antibody discovery. The specificity metrics provide an early prediction of in vivo clearance rates. Of these assays PSR binding is the most appealing, as it is high-throughput and can additionally be utilized as a selection tool for early discovery of developable therapeutic antibodies.61 The self-association related metrics provide an early prediction of antibody production and aggregation propensity. From this collection, the
AC-SINS assay is the highest throughput, although it cannot be used as a sorting tool. This is
true of all of the association assays, and highlights a possible value for a rapid self-association assay usable in sorting protocols.
The assays tested here are of sufficient throughput to enable hundreds of measurements in a span of days. Consequently they could be of particular use for screening panels of lead antibodies at a reasonably early stage in the discovery process, and could assist in narrowing the field to ten or fewer lead molecules for greater scrutiny.
Materials and Methods
Determination of clearance in mice
Antibody PK data were determined in C57BL/6 mice using a single bolus intravenous dose. Each antibody was first labeled with Alexa Fluor 647 NHS Ester dye (Life Technologies
#A37573), and free dye was removed using a Zeba desalting column (Thermo #89892). Degree
of labeling was verified to be between 0.5 and 2.0 for each antibody using a Nanodrop spectrophotometer (Thermo). Each antibody was dosed via retro-orbital injection at 5 mg/kg into three mice. Serum samples were collected immediately after injection and at 0.5, 1, 3, 5, 8,
24, 48, 96, and 168 hours and 2 and 3 weeks post injection. Antibody concentration was determined by measurement of fluorescent intensity using a Typhoon imager after degree of labeling correction (GE Healthcare). Fluorescent measurements were quantified by
normalization to a standard curve for each antibody, and PK profiles were fit in Graphpad Prism using a two phase non-compartmental model. Fits for the three mice in each group were
averaged to obtain a single PK curve for each antibody, from which total clearance rate and standard error were calculated. To ensure that labeling of the antibodies had minimal effect on measured clearance rates, pharmacokinetics for one control antibody were measured both with and without label. Non-labeled antibody serum levels were quantified by ELISA using Meso Scale Discovery (MSD).8 2 Calculated clearance rates were near equivalent between labeled
(12.95 9.22 mL/day/kg) and unlabeled (14.04 3.49 mL/day/kg) samples suggesting that the fluorescent labeling method replicates similar ELISA based methods (Supplementary Figure
4A).
Additionally, there was some concern of immunogenicity as a result of the injection of human IgG antibodies into immunocompetent mice. To assess this, serum from the three mice
treated with mAb2, mAb6, and mAbl2 or one mouse injected with PBS was collected at the terminal time point and assessed for anti-human IgGI antibodies. The antibody of interest was first loaded nonspecifically onto 0.2pM sulfate coated FluoSpheres (Life Technologies #F-8848)
by incubation for 30 minutes in PBS. The coated beads were washed once in lmL PBSA (Ix Phosphate Buffered Saline, Coming #21-040-CV, plus 0.1% Bovine Serum Albumin, Sigma #A9418) and then incubated in a 1:100 dilution of the serum in PBSA for 30 minutes. Beads
were again washed and positive binding of mouse antibodies was detected via goat anti mouse secondary, AlexaFluor 647 conjugate (Life Technologies # A-21236). Final bead suspensions were washed once more and binding median fluorescence intensity was measured by flow cytometry. These results revealed no significant immunogenic reaction against any of the antibodies over the time course of our measurements (Supplementary Figure 4B).
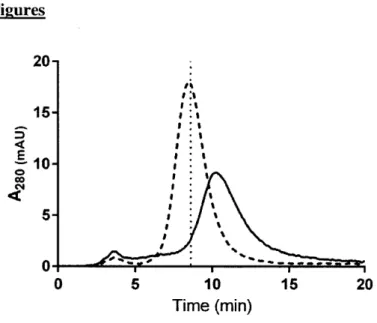
Cross-interaction chromatography (CIC).
CIC was performed as described previously.3 8
In brief, the CIC column was prepared by coupling -30 mg of human serum polyclonal antibodies (Sigma #14506) to a 1 mL HiTrap column (GE Healthcare # 17-0716-01), followed by quenching with ethanolamine.
Approximately 5 pg of each antibody was tested at a flow rate of 0.1 mL/min using PBS as a mobile phase on an Agilent 1100 series HPLC system.
Polyspecificity reagent binding assay (PSR MFI).
PSR assay was done as previously described.6 1 In short, soluble membrane proteins were prepared from CHO cells. The enriched membrane fraction was biotinylated using NHS-LC-Biotin (Pierce, Thermo Fisher Cat# 21336). This poly-specificity reagent was incubated with IgG-presenting yeast, followed by washing. Then secondary labeling mix (Extravidin-R-PE,
anti-human LC-FITC, and propidium iodide) was added to the mixture. Samples were analyzed on FACSCanto (BD Biosciences) using HTS sample injector. Flow cytometry data were
Clone self-interaction by bio-layer interferometry (CSI-BLI).
CSI-BLI assay was carried out as previous described.40 Briefly, human IgG was loaded to AHQ
biosensor (ForteBio) to -1 nm, followed by sensor blocking with human IgGi Fc. The self-association was performed at 1 pM solution concentration of IgG for 300 seconds on an Octet HTX system (FortBbio). The binding response from the association step was subtracted from that of a reference IgG (adalimumab).
Affinity-capture self-interaction nanoparticle spectroscopy (AC-SINS). AC-SINS assay was performed as described previously.4 3
44 In short, gold nanoparticles (Ted Pella Inc. #15705) were coated with 80% capturing anti-human goat IgG Fc (Jackson
ImmunoResearch #109-005-098) and 20% with polyclonal goat non-specific antibody (Jackson ImmunoResearch #005-000-003). The antibodies of interest were then incubated with the particles for 2 hours and the wavelength shift was measured using Molecular Devices SpectraMax M2 with SoftMax Pro6 software. The self-interacting clones show a-higher wavelength shift away from the PBS sample.
Long-term stability size exclusion chromatography (SEC) slope.
Samples were kept lmg/mL at 40'C for 30 days in PBS (20 mM sodium phosphate, 150 mM sodium chloride, pH 7.4). This buffer was selected as a simple, stringent buffer which aims to mimic physiological conditions. Time points were taken at day 0, 5, 20, and 30, and the samples were then analyzed by SEC (Tosoh Bioscience #0022855). For SEC analysis, the running buffer composition was 200 mM sodium phosphate, 250 mM sodium chloride, pH 7.0. A long-term stability slope was calculated from the percent aggregated, measured on the SEC.
Statistical Analysis
All statistical analysis was completed with the assistance of Graphpad Prism v. 6.0. While many
metrics such as clearance rate and PSR MFI appeared to show normal or log normal distributions, there were many that did not, precluding the use of Pearson's correlations to analyze the full data set. As such, Spearman's rank correlations were calculated for all pairwise
combinations antibody characteristics. This notably eliminates the ability to conclude direct correlation between assays, but rather conclude correlation between relative rankings on the
assays. To assess statistical significance of correlations, and exact P value was calculated for each pairwise comparison.
Acknowledgements
All of the in-house antibodies used in this study were generated by Adimab's Antibody
Discovery group, sequence-confirmed by the Core and produced by the High Throughput Expression departments. We appreciate the manuscript editing and critical review by Michael
Ruse and Tillman Gerngross. R.L.K. was supported by a graduate fellowship from the National Institute of General Medical Sciences Interdepartmental Biotechnology Training Program at the
Figures 80->1 60--j 20-C-, a) 2 __ _ _ _ _ _ _ _ _ _ V-'L ',V V-V s oV4e
Figure 1: Clearance rates for 16 antibodies in mice. Data from 3 mice per antibody were fit using a biexponential decay model and total clearance was calculated from the combined fit parameters. Error bars represent standard error
A
B
100 100 67TO (89%, 86%) .- 100-1 10 100 low0 10M0 0 60 100 PSR MFI 100 % - Specificity %Figure 2: The PSR nonspecificity assay correlates with mouse clearance rates. Clearance rates and PSR scores for the data set are shown with cutoffs of 20 mnUday/kg used for clearance and
500 for PSR MFI (A). These cutoffs were determined using an ROC analysis (B). For this
cutoff, the sensitivity rate is 89% and the specificity rate it 86%, with an area under the curve of
A B 25-z204 151
*
0,0* &0* a:
1 10 100 PSR MFI 2-0-1.0-%
r,0.5-1000 10000 500 S 06# * S C 1 10 100 PSR MFI C
.4t
Figure 3: Nonspecificity Assays. The PSR assay correlated significantly with CIC retention time (A, Spearman's p = 0.79, p value = 0.001) and long-term antibody stability (B, Spearman's p = 0.61, p value = 0.015). For each, the used cutoff of 500 for PSR MFI is displayed
1000 10000
B
A
B 0.3 10 E0 C . 0 0.2o
0.1 AC-SINS "ax(9 0-0-
1,
-11P
w 'lwl
1 10 10M CO0 00a_ 0S0 0.1 00 0 o -0.2 6 0.1 1 10 100 AC-SINS Anmax C D 200 S100 * * *4 *~160
* 10*
0 50 0 A50 1o
0 0 W 0.1 1 10 100 0.1 1 10 100AC-SINS Ahmax AC-SINS A
max
Figure 4: Self Interaction assays. The AC-SINS assay correlated significantly with CSI-BLI response (A, Spearman's p = 0.87), SEC retention time (B, Spearman's p = 0.75), purification
titer (C, Spearman's p = -0.43) and percent monomer post purification (D, Spearman's p = 0.52).
For each, the cutoff value of five, suggested by prior work,43 is displayed.
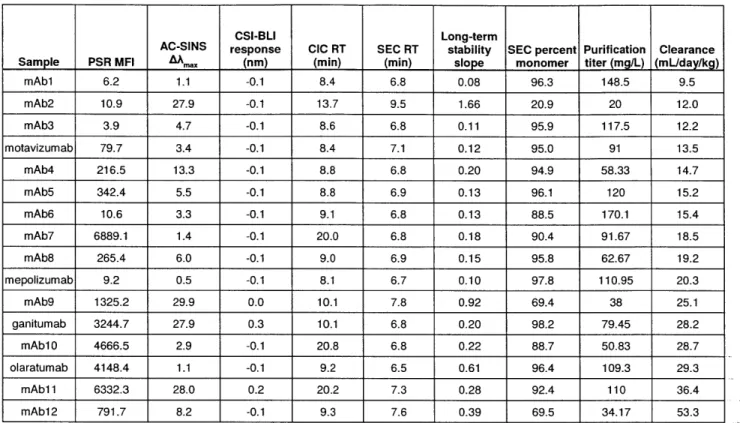
Table 1: Early development tests on a panel of 16 clinical candidate antibodies
CSI-BLI Long-term
AC-SINS response CIC RT SEC RT stability SEC percent Purification Clearance Sample PSR MFI AAmx (nm) (min) (min) slope monomer titer (mg/L) (mL/day/kg)
mAb1 6.2 1.1 -0.1 8.4 6.8 0.08 96.3 148.5 9.5 mAb2 10.9 27.9 -0.1 13.7 9.5 1.66 20.9 20 12.0 mAb3 3.9 4.7 -0.1 8.6 6.8 0.11 95.9 117.5 12.2 motavizumab 79.7 3.4 -0.1 8.4 7.1 0.12 95.0 91 13.5 mAb4 216.5 13.3 -0.1 8.8 6.8 0.20 94.9 58.33 14.7 mAb5 342.4 5.5 -0.1 8.8 6.9 0.13 96.1 120 15.2 mAb6 10.6 3.3 -0.1 9.1 6.8 0.13 88.5 170.1 15.4 mAb7 6889.1 1.4 -0.1 20.0 6.8 0.18 90.4 91.67 18.5 mAb8 265.4 6.0 -0.1 9.0 6.9 0.15 95.8 62.67 19.2 mepolizumab 9.2 0.5 -0.1 8.1 6.7 0.10 97.8 110.95 20.3 mAb9 1325.2 29.9 0.0 10.1 7.8 0.92 69.4 38 25.1 ganitumab 3244.7 27.9 0.3 10.1 6.8 0.20 98.2 79.45 28.2 mAbl0 4666.5 2.9 -0.1 20.8 6.8 0.22 88.7 50.83 28.7 olaratumab 4148.4 1.1 -0.1 9.2 6.5 0.61 96.4 109.3 29.3 mAbl1 6332.3 28.0 0.2 20.2 7.3 0.28 92.4 110 36.4 mAbl2 791.7 8.2 -0.1 9.3 7.6 0.39 69.5 34.17 53.3
Table 2: Full correlations of early development assays. Spearman's rank correlations (A) and their associated P-values (B).
A PSR MFI AC-SINS PSR MFI AC-SINS CSI-BLI CIC RT SEC RT Long-term stability slope SEC percent monomer Purification titer Clearance
B
PSR MFI AC-SINS CSI-BLI CIC RT SEC RT Long-term stability slope SEC percent monomer Purification tit Clearance 0.213 0.213 0.453 0.78 0.411 0.091 0.755CSI-BLI CIC RT SEC RT
0.453 0.091 Long-term stability sloDe SEC percent Purification monomer titer -0.171 -0.350 0.41 0.623 0.661 0.310 0.31C 0.4391
0.606
0.556 0.617 0.778 0.439 -0.171 1 -0.3501 -0.431 -0.524+ -0.402 -).64 2 -0.545 -0.492 -0.664 -0.522 -72 0.535 Clear 0.135 0.312 0.529 -0.020 0.524 -0.047 -0.279 0.718j 0.135 0.312 0.52 -0.020 0.524 -0.047 -0.279 Long-term SECstability percent Purification
PSR MFI AC-SINS CSI-BLI CIC RT SEC RT slope monomer titer Clearance 0.425 0.079 0.001 0.738 0.015 0.527 0.184 0.002 0.425 0.000 0.114 0.001 0.027 0.095 0.039 0.615 0.079 0.000 0.011 0.006 0.012 0.096 0.005 0.238 0.001 0.114 0.011 0.240 0.001 0.030 0.053 0.037 0.738 0.001 0.006 0.240 0.090 0.003 0.024 0.812 0.015 0.027 0.012 0.001 0.090 0.027 0.002 0.040 0.527 0.095 0.096 0.030 0.003 0.027 0.035 0.865 er 0.184 0.039 0.005 0.053 0.024 0.002 0.035 0.294 0.002 0.615 0.238 0.037 0.812 0.040 0.865 0.294 77
26
jdo
i
4
4
n.e
6
ti "
O
...
...
...
.... ..
...
ma& an *aa sie N
40 a a'Ma* o'O s ;
Supl maryFgrm:aaraoie eaueet o a maneo ani odisSeum
cocet atin rteheem cdthsp veae er i frec antbod usingatwohas no-oprmna dea curvno.
**20 I I 10 15 CIC RT (min) 20 25
B
E 10-0.01 0 . 0 * *..I21*
0.1 1Accelerated Stability Slope
Supplementary Figure 2: Correlation of cross interaction assays to clearance. The clearance rate in mice correlated with CIC retention time (A, Spearman's p = 0.53, p value = 0.036) and long-term antibody stability (B, Spearman's p = 0.52, p value = 0.040). For each, the used cutoff
of 500 for PSR MFI is displayed.
A
100-C E a) 0 5A
* High Clearance
a
Low Clearance
E
2
*
-2 0 2 4 6 8 10Fv Charge
(pH 5.5)
B
100 5 10PI (Fv only)
Supplementary Figure 3: Assessment of prediction power of in silico assays. (A) The in silico developability prediction methods used in Sharma et. al.81 were applied to the current data set using a cutoff of 20 mL/day/kg as the dividing line between high (red points) and low (green points) clearance rate. Using the suggested decision boundaries given in the original work, there was little predictive power to the method, with correctly predicted faster clearance in I of 7 mAbs (14%) and normal clearance in 5 of 9 (56%) mAbs. (B) Antibody pI for the variable region alone was evaluated computationally for the full set of antibodies and compared to clearance rate in mice. There was no significant correlation found between pI and clearance rate (Spearman's p = -0. 13, P value = 0.615). For a given variable region sequence, the net charge at a given pH and the pI were calculated by adding up contributions from ionizable groups using
pKas as given in EMBOSS
(http://emboss.sourceforge.net/apps/release/6.6/emboss/apps/iep.html) and the Henderson-Hasselbalch equation.
A
0 0E
2
0 Co)0
200
00
Tmne (hr)
B
1000000
100000
loomo
1-
10M
~1m0
100
10
m
Ab Loading
m
Secondary
m
PBS.Treaed.
/
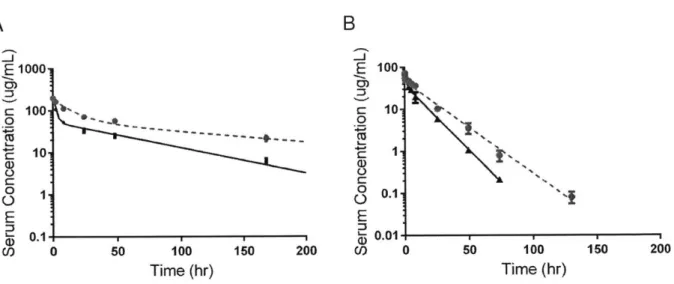
Supplementary Figure 4: Validation of pharmacokinetic measurement methods. (A)
Pharmacokinetic measurements were made for both labeled and unlabeled variants of a control antibody and fit as in other cases. There was no significant difference between the labeled (circles, solid line, 12.95 t 9.22 mI~day/kg clearance rate) and unlabeled (triangles, dotted line, 14.04 3.49 mIJday/kg) samples suggesting that the fluorescent labeling method replicates similar ELISA based methods. (B) Immunogenicity of three antibodies was assessed by a bead
No Ubel
LaW
binding assay. Loading of the antibody of interest was validated by binding of a goat anti human secondary (Ab Loading) and compared against responses to secondary alone (Secondary), serum from PBS treated mice (PBS), or serum from antibody treated mice (Treated). No anti-human