HAL Id: hal-02493326
https://hal.archives-ouvertes.fr/hal-02493326
Preprint submitted on 27 Feb 2020
HAL is a multi-disciplinary open access archive for the deposit and dissemination of sci-entific research documents, whether they are pub-lished or not. The documents may come from teaching and research institutions in France or abroad, or from public or private research centers.
L’archive ouverte pluridisciplinaire HAL, est destinée au dépôt et à la diffusion de documents scientifiques de niveau recherche, publiés ou non, émanant des établissements d’enseignement et de recherche français ou étrangers, des laboratoires publics ou privés.
The elusive quest for high- growth firms in Africa: The
(lack of) growth persistence in Senegal
Florian Leon
To cite this version:
Florian Leon. The elusive quest for high- growth firms in Africa: The (lack of) growth persistence in Senegal. 2019. �hal-02493326�
fondation pour les études et recherches sur le développement international
LA FERDI EST UNE FOND
ATION REC ONNUE D ’UTILITÉ PUBLIQUE . ELLE ME T EN ŒUVRE A VEC L ’IDDRI L ’INITIA TIVE POUR LE DÉ VEL OPPEMENT E
T LA GOUVERNANCE MONDIALE (IDGM).
ELLE C
OORDONNE LE LABEX IDGM+ QUI L
’ASSOCIE A U CERDI E T À L ’IDDRI. CE TTE PUBLIC ATION A BÉNÉFICIÉ D ’UNE AIDE DE L ’É TA T FR ANC AIS GÉRÉE P AR L ’ANR A U TITRE DU PR OGR A MME «INVESTISSEMENT S D ’A VENIR» POR
TANT LA RÉFÉRENCE «ANR-10-LABX
-14-01».
The elusive quest for
high-growth firms in Africa:
The (lack of) growth persistence
in Senegal
Florian Léon
Florian Léon, Research officer, Ferdi
Abstract
The purpose of this paper is to study the persistence of firm growth in Africa using data of formal firms in Senegal from 2006 to 2015, dedicating special attention to high-growth firms. This interest in identifying high-growth firms belongs to the idea that these firms will continue to outperform in the future and create jobs. We document, however, that growth rates are negatively correlated across time, especially for high-growth firms. A top performer is more likely to become a bad performer in the next period than sustain its previous performance. Our analysis also reveals that other indicators of performance (as profitability and productivity in the first period) are unrelated to the persistence of growth. This finding challenges the possibility for policymakers and investors to select persistent high-growth firms by scrutinizing their previous performances.
Key words: Firms; growth paths; Africa; Senegal; High-growth firms. JEL Classification: G21; O16.
Dev
elopment Po
lic
ie
s
W
ork
ing Paper
258
December 2019“Sur quoi la fondera-t-il l’économie du monde qu’il veut
gouverner? Sera-ce sur le caprice de chaque particulier? Quelle
confusion! Sera-ce sur la justice? Il l’ignore.”
Ferdi P258 / Léon F. >> The elusive quest for high-growth firms in Africa… 1. Introduction
High-growth firms have received a substantial amount of attention from researchers and policymakers in recent years. The need to create sustainable jobs explains the worldwide interest in high-growth firms (HGFs henceforth). Evidence points out that most jobs originate from a small number of high-growth firms both in industrialized countries (Henrenkson and Johansson, 2010; Coad et al., 2014) and in emerging countries (Grover Goswani et al., 2019). In Africa, the necessity to create jobs is even crucial to avoid social and political tensions, due to demographic challenge ahead.
The detection of future HGFs has mobilized many resources. Predicting entrepreneurial success and identifying future HGFs is a challenge, even with the combination of large datasets and advanced methods (Coad and Srhoj, 2019; McKenzie and Sansone, 2019). Daunfeldt et al. (2015) report that HGFs do not have the characteristics that we typically associate with successful firms (such as high profits and strong financial position). HGFs do not differ from other firms, expect that they are often younger but not necessarily smaller (Coad et al., 2014; Haltiwanger et al., 2013).
In spite of a large debate about the best way to favor firm development and promote HGFs, our knowledge about the trajectories of successful firms in Africa remains limited. This interest in detecting HGFs belongs to the idea that these firms will continue to outperform in the future and to create jobs. Indeed, if policymakers or investors want to select promising firms, we need to identify factors affecting firm ability not only to grow in one period but also to maintain their growth over time. Evidence, almost exclusively from European economies, points out that HFGs are often one-hit wonders and display a disappointing performance after having achieved high-growth (Parker, 2010; Höltz, 2014; Daunfeldt and Halvarsson, 2015).
The purpose of this paper is therefore to study the persistence of firm growth in Africa with a special attention to high-growth firms. Our article has two main objectives. First, we scrutinize firm growth persistence in Senegal, one of the most stable African country. Our knowledge about growth persistence in Africa is limited, even non-existent, due to the lack of reliable data. In this work, we benefit from a rich administrative dataset on the universe of formal firms operating in Senegal from 2006 to 2015. Second, we study whether other metrics of performance (profitability and productivity) affect growth persistence. We expect that among HGFs those able to generate higher profits and the most productive are more able to maintain their growth in the future (Davidsson et al., 2009). Past profits may favor firm expansion (investment, hire skilled workers) by relaxing financial constraints. In addition, profitability and productivity reflect firm efficiency. The most efficient firms have specific resources and ability to combine them allowing them to continue to growth, in line with the resource-based view. Finally, previous metrics
of performance could induce a signal to third party (clients, customers, lenders) allowing firms to benefit from a form of “Matthew effect” (Merton, 1968). The best performers outperform in the future because they take advantage of their previous success. They obtain inputs at lower costs (skilled workers, external funds) or are able to reach new customers.
Our results can be summarized as follow. First, growth rates are negatively correlated across time, especially for firms at the tails of distribution (high-growth firms and fast-declining firms). Only a small number of HGFs are able to sustain (around 15%). Transitions between extreme situations (from top decile to bottom decile and vice versa) are indeed more likely than subsistence. Turning to moderators of persistence of growth, we find that age and size play a role to mitigate the negative correlation of growth rates, especially for HGFs. However, the likelihood to sustain growth is not shaped by better profitability or productivity (in the past period). This last result is in line with findings from Bianchini et al. (2017) and Moschella et al. (2019) documenting that persistent HGFs do not differ in their characteristics from other HGFs in Europe and in China, respectively. This finding raises a concern about the ability to detect persistent HGFs.
Our work contributes to the literature on firm dynamics in Africa. Research has highlighted the dominance of small firms and the substantial lack of medium-sized and large firms in developing world (Tybout 2000, Sleuwaegen and Goedhyus 2002, Hsieh and Olken 2014). While a large literature has investigated the drivers of firm growth, few papers have scrutinized firm dynamics in developing countries, especially in Africa. Recent evidence challenge the common view that large firms were small start-ups that grew quickly over a sustained period in developing countries (Hsieh and Klenow, 2014). Firm growth in Africa is preliminary explained by the creation of new firms rather than by within-firm growth (Sandefur, 2010; Shiferaw and Bedi, 2013; Rijkers et al., 2014; Davies and Kerr, 2018). Large firms are often large at birth (Nichter and Goldmark, 2009; Ayyagari et al., 2015, 2017). In this paper, we extend this literature by focusing on an under-investigated aspect: the lack of persistence of firm growth in developing world. We document that firm growth is a chaotic process with vicissitudes. Episodes of quiet, stable and robust growth are rather the exception. This finding resounds with macroeconomic evidence indicating that while growth accelerations are frequent, they rarely persist over time (Easterly et al., 1993) and are highly unpredictable (Hausmann et al., 2005). Our findings also indicate that the focus on one-time high-growth firms is subject to caution because only a handful of HGFs are able to sustain their previous growth performance. Unfortunately, we fail to disentangle between one-hit HGFs and persistent HGFs by exploiting other measures of performance.
Our paper also adds to the literature on the persistence of firm growth. Due to their importance in job creation, a lot of attention of researchers has been dedicated to identify HGFs, especially in developing
Ferdi P258 / Léon F. >> The elusive quest for high-growth firms in Africa…
countries (Goedhuys and Sleuwaegen, 2010; Grover Goswati et al., 2019; McKenzie and Sansone, 2019). However, a few papers have scrutinized the persistence of firm growth in non-European countries (see the next section for a review of the literature). One exception is Moschella et al. (2019) who compare permanent HGFs and one-hit HGFs in China. Both groups of firms are somewhat similar in their observable characteristics. We extend this analysis in two ways. First, we investigate the persistence of firm growth in a low-income country. Our results document that, despite strong differences in environment between Europe and Senegal, we observe a similar pattern, namely a lack of persistence in growth. This finding is in line with Grover Goswati et al. (2019) documenting a lack of persistence of HGFs in six emerging countries (Brazil, Côte d’Ivoire, Ethiopia, Hungary, Indonesia, and Turkey). Second, we scrutinize firms’ attributes that may alter the negative autocorrelation of growth. In addition to usual firm’s characteristics previously considered such as size (Coad, 2007; Coad and Höltz, 2009; Capasso et al., 2014) and age (Coad et al., 2018), we consider alternative measures of performances (profitability and productivity). This point is of prime importance for policymakers and investors to select future stars. Unfortunately, we document that neither profitability nor productivity matters to shape the relationship between past growth and current growth, especially for HGFs. This finding is in line with Bianchini et al. (2017) and Moschella et al. (2019) in other contexts.
The remainder of the paper is as follows. Section 2 presents the literature review. Section 3 describes the context (Senegal from 2006 to 2015) and data. Section 4 and Section 5 display the methodology and variables, respectively. Section 6 discusses the results. The final section concludes.
2. Literature review
Our article has two main objectives. First, we examine growth persistence in Senegal, a stable African country. Second, we scrutinize whether observable characteristics (especially other metrics of performance) help us to detect persistence in growth. We briefly present existing literature on the persistence of firm growth before discussing how firms in Africa differ from their counterparts in Europe and how other metrics of performance (profitability and productivity) could affect the persistence of growth.
2.1. A brief overview of the literature on the persistence of growth
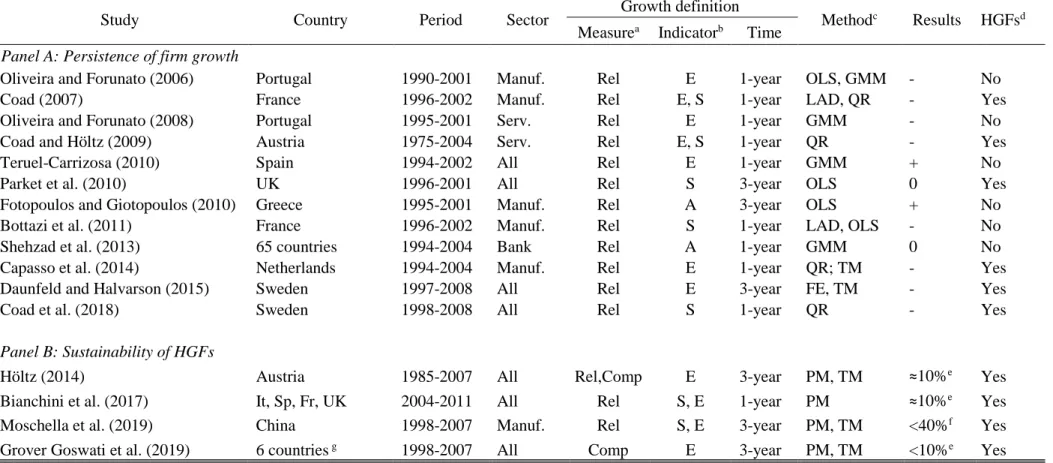
An emerging literature has examined firm growth autocorrelation. This body of literature is mainly empirical and focuses almost exclusively on European firms. Table 1 summarizes recent papers (published after the mid-2000).1 This literature is divided into two strands of papers. The first strand of works
1 We extend the Table provided by Daundeldt and Halvarsson (2015). Interested readers may refers to this article and other papers (Coad and Höltz, 2014; Coad et al., 2018) for a description of works published before 2005 on the persistence of firm growth.
investigates that persistence of firm growth for the whole distribution of firms (Panel A). In spite of differences in methodologies, the majority of papers (8 into 12) documents a negative correlation of growth rate. The second group of papers dedicates special attention to the persistence of HGFs (Panel B).2 Less
than 10% of HGFs are able to sustain in Europe (Höltz; 2014; Bianchini et al., 2017).3 As documented by
Grover Goswati et al. (2019), figures from emerging countries are similar. The likelihood of a repeated high-growth event in the next three-year period is 7.5 percent in Côte d’Ivoire and 8.1 in Ethiopia. The same likelihood is 10.9 in Brazil, 8.1 in Hungary, 4.7 in Indonesia, and 13.1 in Turkey. Bianchini et al. (2017) and Moschella et al. (2019) document that permanent HGFs and one-hit HGFs are somewhat similar in terms of productivity, profitability, financial conditions and innovations, in four European countries and in China respectively.
As explained above this literature is mainly empirical and we lack solid theoretical support to explain the lack of persistence of firm growth. Two major theories of the firm (the resource-based view and the evolutionary economics) assume that growing firms will continue to perform in the future (positive autocorrelation). Despite its variants4, the resource-based view (Barney, 1991; Peteraf, 1993) states that
growing firms have specific resources allowing them to outperform competitors in the future. For the evolutionary economics (Nelson and Winter, 1982), firms compete against each other and innovative firms (in process or product) are able to succeed. Fitter firms survive and grow whilst less viable firms lose market share and exit.
Other theories help to justify a lack of autocorrelation but not a reverse of fortune. In a famous contribution, Gibrat (1931) argues that growth is an erratic process. Firm growth in one period is unrelated to previous and past growth episodes. Alternative explanations could justify the lack of persistence. Growth could be driven by lumpy investment (equivalent to the accelerator hypothesis in macroeconomics); the growth rates are highly volatile over time (Coad, 2007). In addition, firms operating in niche markets are able to develop until a threshold (when the market is saturated) and stop their growth afterwards. In the same spirit, owner/manager may stop their growth after attaining their optimal size, in line with the neoclassical view of the firm.
2 Two papers (Daunfledt and Halvarsson, 2015; Capasso et al., 2014) also investigate the transition matrix and therefore the ability for HGFs to be permanent.
3 These figures are in line with those provided by Capasso et al. (2014) and Daunfeld and Halvarsson (2015). Höltz (2014) document that High-Growth Firms are more likely to sustain when they are measure using the Birch Index. 4 The central focus of the resource-based view is that firm performance reflects the availability and use of resources and capabilities. The Resource-based View is inspired by the seminal work of Penrose (1959). Firm growth can be studied as a dynamic process of management interacting with resources. Managers try to make the best use of resources available to grow. These (tangible and intangible) resources should be valuable, rare, imperfectly imitable and non-substitutable. Not only resources are firm specific but also manager’s capability to combine them. Learning-by-doing lead firm growth.
Ferdi P258 / Léon F. >> The elusive quest for high-growth firms in Africa… Table 1: A synthesis of literature review
Study Country Period Sector Growth definition Methodc Results HGFsd
Measurea Indicatorb Time Panel A: Persistence of firm growth
Oliveira and Forunato (2006) Portugal 1990-2001 Manuf. Rel E 1-year OLS, GMM - No
Coad (2007) France 1996-2002 Manuf. Rel E, S 1-year LAD, QR - Yes
Oliveira and Forunato (2008) Portugal 1995-2001 Serv. Rel E 1-year GMM - No
Coad and Höltz (2009) Austria 1975-2004 Serv. Rel E, S 1-year QR - Yes
Teruel-Carrizosa (2010) Spain 1994-2002 All Rel E 1-year GMM + No
Parket et al. (2010) UK 1996-2001 All Rel S 3-year OLS 0 Yes
Fotopoulos and Giotopoulos (2010) Greece 1995-2001 Manuf. Rel A 3-year OLS + No
Bottazi et al. (2011) France 1996-2002 Manuf. Rel S 1-year LAD, OLS - No
Shehzad et al. (2013) 65 countries 1994-2004 Bank Rel A 1-year GMM 0 No
Capasso et al. (2014) Netherlands 1994-2004 Manuf. Rel E 1-year QR; TM - Yes
Daunfeld and Halvarson (2015) Sweden 1997-2008 All Rel E 3-year FE, TM - Yes
Coad et al. (2018) Sweden 1998-2008 All Rel S 1-year QR - Yes
Panel B: Sustainability of HGFs
Höltz (2014) Austria 1985-2007 All Rel,Comp E 3-year PM, TM ≈10%e Yes
Bianchini et al. (2017) It, Sp, Fr, UK 2004-2011 All Rel S, E 1-year PM ≈10%e Yes
Moschella et al. (2019) China 1998-2007 Manuf. Rel S, E 3-year PM, TM <40%f Yes
Grover Goswati et al. (2019) 6 countries g 1998-2007 All Comp E 3-year PM, TM <10%e Yes
a Rel=Relative measure of growth; Comp=Composite index (Birch or OECD); b A=Assets; E=Employment; S=Sales
c OLS=Ordinary Least Squares; GMM=GMM-System; LAD=Least Absolute Deviation; QR=Quantile Regression; TM=Transition Matrix; FE=Fixed Effect: PM=Probability model d Special focus on HGFs; e probability of repeating HGFs; f Different threshold (top 20%) used to define HGFs; g Brazil, Côte d’Ivoire, Ethiopia, Hungary, Indonesia, and Turkey
However, few arguments exist to justify the reverse of fortune observed in previous empirical studies. In a path-breaking contribution, Penrose (1959) explains all firms experience naturally a growth process by learning-in-doing. However, firms experiencing fast growth (above the optimal growth rate) may suffer in the subsequent period because additional managerial tasks erode profitability (“Penrose effect”). Consequently, the growth of HFGs is slowed down to recover profitability. Another argument to explain negative autocorrelation is a regression-to-the-mean phenomenon in its original interpretation by Galton (1886). If growth is due to an external and unexpected event (such as lower input prices or increased temporary demand), firms experiencing a rapid growth in one period will return to their “normal” level of activity. This implies a negative growth in the second period and therefore a negative autocorrelation of growth rates.
2.2. The specificity of African firms
The relevance of existing theories of the firm as well as econometric results obtained from European firms are questionable in an African context. One may argue that firms are more likely to present positive correlation in their growth in Africa. For instance, firms in emerging economies have rooms for growth. The growing middle-class spurs demand for firms. Meanwhile the number of competitors and degree of competition is often limited in poor countries facilitating firm’s ability to continue their growth (Schwab and Werker, 2018).
On the other hand, African firms may be limited in their development process due to market failures and intrinsic factors (internal organization, managers’ skills, etc.). Firms may suffer from a lack of access to skilled labor and/or to capital, inhibiting their ability to continue their growth. In addition, managers and owners should be reluctant to develop their enterprise beyond a threshold for multiple reasons (e.g., corruption, tax burden, and loss of control on the firm). Furthermore, owners and managers of firms in developing countries are often unable to accompany firm’s growth due to their lack of managerial capital (Bruhn et al., 2010). Finally, African countries suffer from unstable economic environment inducing a source of turbulence in firm growth (unstable demand; rapid changes in prices of inputs and outputs). We limit this issue by focusing our study on a stable and dynamic economy (cf. Section 3).
To sum up, we are agnostic about whether the persistence of growth is stronger or weaker in African countries.
Ferdi P258 / Léon F. >> The elusive quest for high-growth firms in Africa…
2.3. The possible interactions between firm growth and other metrics of performance
For policymakers, it is important not only to know whether firms are able to sustain their growth but also to detect factors favoring persistence in growth to design effective policies to accompany these firms. Our work therefore also scrutinizes firm’s factors that could shape the autocorrelation of firm growth. The existing literature has examined the impact of usual characteristics of firms. Coad et al. (2014) point out that HGFs are not more frequent in some industries (e.g., high-tech sector) than in other sectors. However, size and age play a role. The autocorrelation is negative for small firms, while large firms show positive or no persistence in growth rate (Coad, 2007; Coad and Höltz, 2009; Capasso et al., 2014). Young firms exhibit positive autocorrelation in growth rate, contrary to old ones, as documented by Coad et al. (2018).
In this paper, we focus on other metrics of performance, namely profitability and productivity. There are some arguments to believe that only growing firms that are able to secure profits and/or generate enough productivity will be able to continue to grow. Penrose (1959) was the first to explain how a rapid growth episode is unstainable if it erodes profitability or productivity. Davidsson et al. (2009) argue that sound growth usually start with achieving sufficient levels of profitability. Different channels explain how the most efficient firms are able to sustain their growth.
First, profit and profitability are proxies of inherent performance of the firm and reflect underlying competitive advantage of the firm (competitive advantage effect). According to the resource-based view, (unobservable) characteristics or resource of the firm, reflected in their higher performances, allow efficient firms to continue to grow.
Second, profitable firms may also exploit their additional resources to finance their growth (internal
resource effect). Higher profits allow them to reduce the cost of (external) capital and to attract skilled
workers by offering higher wages or better working conditions.
Finally, successful firms may also benefit from a “signal effect”. These firms were able to capitalize on their first success (irrespective of its sources, luck or not) due to a signal effect for lenders, workers, clients, or suppliers. Previous success could be a way to build a reputation facilitating access to specific input (skilled workers, specific intermediate goods), capital (bank loans, trade credit) and output markets (consumer confidence). We may observe a form of “Matthew effect”: successful firms were able to capitalize on their first success due to a signal effect, even if this success is due to external reasons (e.g., pure luck).
While the competitive advantage effect is common for firms in industrialized and developing economies, the two last effects can be particularly relevant in opaque markets. Due to lack of transparent information, outsiders should rely on observable characteristics such as growth and profit. A firm combining growth and
profit should benefit a lot by accessing to less expensive inputs (labor, capital, intermediate goods) and reaching a large customer base.
3. Context and data
The main challenge for the analysis of firm dynamics in Africa is data availability. Until recently, only surveys, such as World Bank Enterprise Surveys, were available for African firms. Different statistical countries have recently produced census and/or administrative data. In this work, we benefit from the register of all formal firms operating in Senegal from 2006 to 2015.
3.1. Context
Senegal is the fourth West African economy (after Nigeria, Côte d’Ivoire and Ghana) but remains a low-income country. Despite good economic performance, more than 40% of population are below the poverty line. As many African countries, Senegal faces a strong demographic growth (more than 2.5% per year since 1995). According to National Institute of Statistics, the number of inhabitants will double in the next two decades (from 15 millions to 30 millions). The half of the population is below 20-year old. Therefore, creating sufficient decent jobs is of prime importance in Senegal. In this perspective, national authorities have launched a new ambitious program in 2012 (“Plan Sénégal emergent”) to stimulate an inclusive growth by the diversification of the economy.
Senegal is a stable African country in both political and economic terms. During the period of observations (2006-2015), Senegal did not witness massive political or economic events rendering our analysis unfeasible. This is of prime interest for our purpose because firm growth is unaffected by exogenous shock as it could be in other African countries (due to the political crisis or booms and busts in commodity prices for resource dependent countries). Senegal has never witnessed a coup d’état since its independence. Political tensions within Senegal (e.g., in southern region of the Casamance during the 1990s) or with neighbors (e.g., conflict with Mauritania between 1989 and 1991) existed but remained limited. The three major political transitions since independence have been peaceful.5
Since the 1994 Franc devaluation, Senegal has witnessed sustained growth (+4% per year since 1995) and does not suffer from major imbalances. Extractive industries, construction, tourism, fish and agriculture drive economic activity in Senegal. Senegal exports natural resources (phosphate, petroleum, zircon, gold) and agriculture products (groundnuts, fish, cotton) but it less resource dependent than many other African
5 In 1981 between Léopold Sédar Senghor and his former Prime minister Adbou Diouf. In 2000, the historical opponent Abdoulaye Wade was elected and remained in office until 2012. In 2012, Macky Sall became the fourth president of Senegal.
Ferdi P258 / Léon F. >> The elusive quest for high-growth firms in Africa…
countries. According to the World Bank, total natural resources rents represent between 2 and 5% of GDP (for comparison, it often exceed 10 or 20 percent in other African countries).
3.2. Data description
Our data are retrieved from the register of all formal firms operating in Senegal. It has been collected by the National Institute of Statistics and covers the universe of enterprises operating in the formal sector. It includes public, local private and foreign-owned firm operating in agriculture and fishing, manufacturing, trade, construction, services and finance. The unit of observation is the firm; but almost all firms have only one establishment in Senegal.
The register collects two types of information. First, we obtain administrative information including year of creation, city, industrial sector (two-digit), ownership structure (public; private; foreign), and the number of employees. Second, the database also reports basic financial information extracted from balance sheets (such as total assets) and income statements (such as total sales, profit). All financial data are deflated using the GDP deflator.
The initial database considers an unbalanced panel of 14,468 firms over the period 2006-2015 (82,400 observations). We apply some filter rules. First, we withdraw public companies (80 firms). Second, our aim consists on analyzing firm growth trajectories. Therefore, we need a sufficient number of observations per firm. However, our main indicators of firm growth (sales and employment) are not always provided. For instance, financial data (including sales) are filled in 57% of observations and data on employment for only one quarter of observations.6 Therefore, we keep only firms with at least four continuous value. In other
words, we restrict our sample to firms with three years of growth. Our final samples include 4,969 firms (27,441 observations) for sales; and, 1,642 firms (9,032 obs.) for employment.
Finally, one should recall that we focus exclusively on formal firms. In Senegal, as in many other low-income countries, informal activity accounts for a large share of total production. However, we do not believe that this restriction biases our results. Motivations to stay informal for managers as well as forms of informal firms are multiple (La Porta and Shleifer, 2014; Léon, 2019). Some of owners of informal firms are less interested in developing their business than finding a stable work. On the contrary, we expect that owners who decide to register are more growth-driven motivated. Another issue is about firm churning (entry and exit). We focus on surviving firms (at least during four periods). Firm entry is partially taking
6 When an observation in t is lacking while we have data in t-1 and t+1, we apply the arithmetic average to infer the value in t for financial value (sales). For employment, we fill the gap if the number of employees is unchanged between t-1 and t+1.
into account when we consider firm age as a moderator. However, the baseline analysis does not consider firm exit. We discuss this aspect in the robustness checks.
4. Methodology
To test the degree of persistence of firm growth, we follow the literature (e.g., Capasso et al., 2014; Coad et al., 2018) and run an augmented growth-autocorrelation model as follows:
𝐺𝑟𝑖,𝑡 = 𝛼 + 𝛽𝐺𝑟𝑖,𝑡−1+ ∇𝑿𝑖,𝑡−1+ 𝜏𝑗+ 𝜇𝑡+ 𝜀𝑖,𝑡 (1)
Where subscripts i and t refer to firm and period, respectively. The parameter of interest is β, which refers to the effect from lagged growth rates. If 𝛽 > 0, we infer that growth rates are persistent over time (auto-correlated) because firms having higher levels of growth rate in t-1 exhibit higher level of growth rates in t. At the opposite, a negative coefficient associated with the lagged growth reflects the reverse of the fortune. We control for firm’s characteristics (𝑿𝑖,𝑡−1) including firm size7, firm age, foreign-owned dummy and a
dummy for firm located in Dakar. 𝜏𝑗 is a set of sector dummies (2-digit) controlling for time-invariant
industry specific components. We finally include a set of time-dummies (𝜇𝑡) to account for common shock
affecting all firms each year.
In a second step, we investigate whether growth persistence differs according to firm’s characteristics (𝑿𝑖,𝑡−1). To test this hypothesis, we interact the lagged growth rate (𝐺𝑟𝑖,𝑡_1) with firm’s characteristics as
follows:
𝐺𝑟𝑖,𝑡 = 𝛼 + 𝛽𝐺𝑟𝑖,𝑡−1+ Θ(𝐺𝑟𝑖,𝑡−1∗ 𝑿𝑖,𝑡−1) + ∇𝑿𝑖,𝑡−1+ 𝜏𝑗+ 𝜇𝑡+ 𝜀𝑖,𝑡 (2)
Where firm’s characteristics (𝑿𝑖,𝑡−1) are the same than those described above.
Finally, we dedicate special attention on profitability and productivity as possible moderators. To investigate this issue, we extend Eq. (1) by adding an interaction between our proxies of profitability or productivity and the lagged growth rate as follows:
𝐺𝑟𝑖,𝑡 = 𝛼 + 𝛽𝐺𝑟𝑖,𝑡−1+ δ(𝐺𝑟𝑖,𝑡−1∗ 𝑃𝑖,𝑡−1) + ∇𝑿𝑖,𝑡−1+ 𝛾𝑃𝑖,𝑡−1+ 𝜏𝑗+ 𝜇𝑡+ 𝜀𝑖,𝑡 (3)
Where 𝑃𝑖,𝑡−1 is a measure of firm profitability or productivity (see below). If the best performing firms are
more able to sustain growth, we expect that δ > 0 (for HGFs).
Given the fact that growth rate distribution deviates from a normal law (Bottazzi and Secchi, 2006), we follow the literature and rely on quantile regression to estimate Eq (1). Quantile regression estimates the
7 Firm size is the logarithm of sales when we consider sales growth or the logarithm of employment when we consider employment growth.
Ferdi P258 / Léon F. >> The elusive quest for high-growth firms in Africa…
effects of the lagged growth rates at the different quantile of the distribution (Koenker and Hallock, 2001). Another advantage comes from the non-homogeneity of the impact of lagged growth rate on contemporaneous growth rate. Existing papers (Capasso et al., 2014; Coad, 2007; Coad et al., 2018) point out that the fast-growing firms and fast-declining firms exhibit stronger negative autocorrelation in growth rates.
5. Variables 5.1. Firm growth
The measurement of firm growth implies several methodological considerations. Delmar et al. (2003) document that firm growth measures employed in the literature differ in several dimensions: (i) firm growth indicators; (ii) the firm growth formula; and, (iii) the distinction between organic growth and acquisition growth. In this paper, we only have information on organic growth (within-firm growth). We are unable to account for acquisition. After an acquisition, the new entity is coded using a new identifier and we are unable to find the original firms. We briefly explain our choices made on the two first dimensions in the following.
5.1.1. Firm growth indicators
Different indicators of growth have been identified in the literature (Delmar et al., 2003): assets, employment, market share, physical output, profit, and sales. In this work, we focus on two frequently used indicators of growth, namely sales growth and employment growth. Indeed, sales growth and employment growth are frequently used in the literature and facilitate comparison with existing studies (cf. Table 1).
Although sales growth and employment growth have often been used, individually and interchangeably, it has become increasingly evident that these measures are not equivalent (Delmar et al., 2003; Coad, 2009). Each indicator has its advantages and drawbacks. Sales growth is the most common indicator used by managers and entrepreneurs and predict evolution of other indicators (employment, total assets, etc.). Sales growth may mirror best the short- and long-term changes in the firm. Employment growth has the advantages to be less sensitive to very short-term variation and measurement issues (e.g., deflation, manipulation of reported sales and profit). In addition, employment is often the explicit target for political authorities and is a better indicator for multi-product firms. The use of a single indicator is justified if one indicator is the best fitted for the question investigated (due to theoretical model in mind, for instance). Insofar as we do not have specific interest in one indicator, we consider both measures of growth.
Sales are defined as total sales revenue in deflated value (and in euros). We compute the number of workers as the number of employees plus one (for the manager). Sales growth and employment growth are
imperfectly correlated. In our data, growth of employment and growth of sales are weakly correlated not only at the annual basis (ρ=0.14), but also at the three-year period growth (ρ=0.22).
5.1.2. Firm growth formula
There are two basic approaches to measure growth: absolute or relative. The absolute growth examines the actual difference in firm size, while relative growth refers to relative changes in size. The implications of the choice between relative and absolute measures are obvious. A relative measure will favor growth in small firms, whereas an absolute measure will bias the results in favor of large firms. To reduce the impact of relative and absolute formula, composite measures have been suggested as the Birch index or the definition of high-growth firms by Eurostat-OECD. Nonetheless, the literature on firm growth rely on relative measure. In line with recent papers, we compute firm growth as the difference of logarithm, as follows:
𝐺𝑟(𝑦)𝑖,𝑡= log (𝑦𝑖,𝑡) − log (𝑦𝑖,𝑡−1) (4)
Where y is sales or employment. Taking the log-difference of firm size to proxy growth is its less sensitivity to heteroscedasticity (Tornqvist et al., 1985).
Time span over which growth is calculated range between 1-year to 3-year, as indicated in Table 1. Choosing longer periods has the advantage to avoid measurement errors or short-term fluctuations due to transitory shocks. However, annual growth is of prime importance for managers and is often the explicit target. In this paper, we consider both annual growth in the baseline analysis and triannual growth in the Appendix.8
5.2. Profitability and productivity
We focus particular attention on firm’s performance in the past period to shape the persistence of growth. Due to the limited data, we rely on two basic indicators of firm performance, namely financial performance and labor productivity. We rely on return-on-assets (profit before taxes divided by assets) as indicator of profitability. We rely on labor productivity because we are unable to compute total factor productivity (lack of data on capital). Labor productivity is the ratio of value added (in deflated value) per worker.
It is unclear whether profitability and productivity differ for our conceptual framework. One might expect that profitability is easily observable; however, managers may benefit from an increase in productivity for their operations. In addition, productivity is a better mirror of differences in efficiency. Because the
Ferdi P258 / Léon F. >> The elusive quest for high-growth firms in Africa…
dynamics in performance may be more important to explain dynamics in size, we also calculate the growth of profit and the growth of labor productivity (using the Eq. 4).
6. Results
6.1. Descriptive statistics
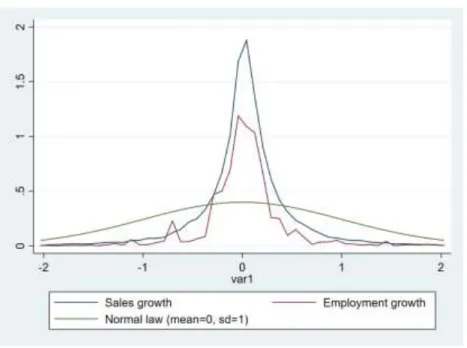
Table 2 (Panel A) presents descriptive statistics on annual firm growth and three-year growth. In any case, the growth rate of sales is higher than the rate of employment growth. On average, firm sales grow at 3 percent per year. However, employment growth is below one percent per year (+0.46%). Table 2 also indicates that three-year growth of sales (+12%) is higher than three-year growth of employment (+2.5%), in line with results from annual growth rates. The distribution of growth rates typically display heavy tails not only in developed countries (Bottazzi and Secchi, 2006; Coad et al., 2014) but also in emerging countries (Grover Goswani et al., 2019). Figure 1 plots the density of annual growth rates of sales and employment for the whole period, as well as the normal distribution for comparison. We confirm that the distribution of growth is fat-tailed and resembles a tent-shaped; as in developed countries, many firms experiences no growth (probability mass is located around zero).9 The majority of firms experience a
growth.
Figure 1: Distribution of firm growth rate, Senegal 2006-2015 (annual observations)
9 The distribution of three-year growth provides a close picture (available upon request). However, in this case, the distribution of employment growth is more concentrated toward zero.
Turning to other variables, Panel B indicates that our sample of formal firms in Senegal assembles, on average, relative large firms. However, as it is common with firm data, outliers drive average values. The average value of sales exceeds EUR 2 million per year. However, a half of firms earns less than EUR 150,000 and less than one fifth of companies ears more than EUR 1 million. We see the same distribution pattern for employment and age. Almost three quarters of firms have less than nine employees (and one third less than three employees); and only 15% more than 50 employees. Young firms, defined as firms with less than 5 year-old, account for more than one quarter of firms. Almost one half of firms are between 5-year old and 15-year old. The majority of firms operate in Dakar (more than 85%) and are private local firms (70%).
On average, firms in Senegal display a negative return-on-assets; albeit the majority of firms (70%) have a positive return-on-assets (extreme negative RoA drives average). The median value of RoA equals 3% and one quarter of firms exhibits a RoA above ten percent. Each worker is able to generate a value added of EUR 12,000 per year.10 As for size, average hides wide heterogeneity. Median firm has a productivity of
EUR 5,000 per year and only one quarter of firms exhibit a productivity above EUR 10,000. On average, firms experience a growth of profit and of labor productivity. Both indicators are partially correlated each together (ρ=0.33) and partially correlated with sales growth (ρ is between 0.34 and 0.36) but uncorrelated with employment growth.
10 The use of value added explains the negative value of labor productivity in some cases. However, this concerns only 5% of firms.
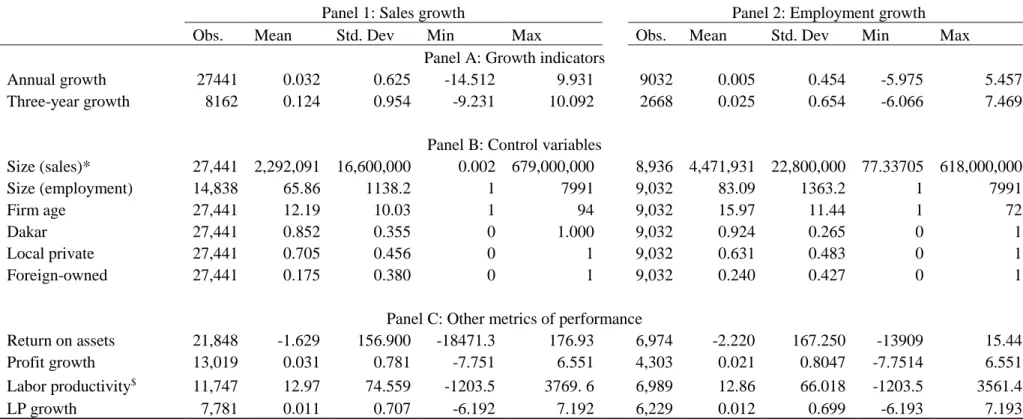
Ferdi P258 / Léon F. >> The elusive quest for high-growth firms in Africa… Table 2: Descriptive Statistics
Panel 1: Sales growth Panel 2: Employment growth
Obs. Mean Std. Dev Min Max Obs. Mean Std. Dev Min Max
Panel A: Growth indicators
Annual growth 27441 0.032 0.625 -14.512 9.931 9032 0.005 0.454 -5.975 5.457
Three-year growth 8162 0.124 0.954 -9.231 10.092 2668 0.025 0.654 -6.066 7.469
Panel B: Control variables
Size (sales)* 27,441 2,292,091 16,600,000 0.002 679,000,000 8,936 4,471,931 22,800,000 77.33705 618,000,000 Size (employment) 14,838 65.86 1138.2 1 7991 9,032 83.09 1363.2 1 7991 Firm age 27,441 12.19 10.03 1 94 9,032 15.97 11.44 1 72 Dakar 27,441 0.852 0.355 0 1.000 9,032 0.924 0.265 0 1 Local private 27,441 0.705 0.456 0 1 9,032 0.631 0.483 0 1 Foreign-owned 27,441 0.175 0.380 0 1 9,032 0.240 0.427 0 1
Panel C: Other metrics of performance
Return on assets 21,848 -1.629 156.900 -18471.3 176.93 6,974 -2.220 167.250 -13909 15.44
Profit growth 13,019 0.031 0.781 -7.751 6.551 4,303 0.021 0.8047 -7.7514 6.551
Labor productivity$ 11,747 12.97 74.559 -1203.5 3769. 6
6,989 12.86 66.018 -1203.5 3561.4
LP growth 7,781 0.011 0.707 -6.192 7.192 6,229 0.012 0.699 -6.193 7.193
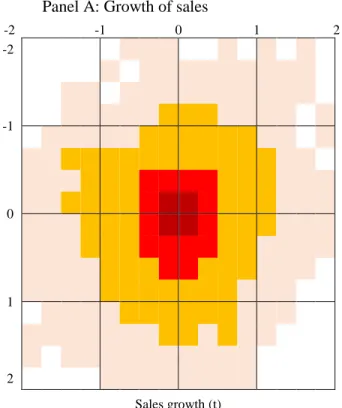
Figure 2: Scatterplot of growth rates at times t against rate at time t-1 Panel A: Growth of sales
-2 -1 0 1 2 S ales g ro wth (t -1) -2 -1 0 1 2 Sales growth (t)
Panel B: Growth of employment
-2 -1 0 1 2 Emp lo y m en t g ro wth (t -1) -2 -1 0 1 2 Employment growth (t) > to 10% of firms Between 0.1% and 1%
Ferdi WP n°258 / Léon F. >> The elusive quest for high-growth firms in Africa
We now turn to the dynamics of firm growth over time. In an unreported analysis, we point out that variability in growth rates in mainly explained by within-firm variation rather than between-firm variation. We run a simple model explaining growth rate by firm fixed effects. According to this regression, firm time-invariant characteristics (firm fixed-effects) explain less than 15% of total variance. Put differently, 85% of growth variation is due to changes within firm. We therefore examine firm growth persistence. A simple correlation between the contemporaneous growth rate and the past year growth rate is negative for both sales growth (ρ=-0.16) and employment growth (ρ=-0.20). This pattern is robust when we consider three-year growth with coefficient correlations ranging from -0.07 (sales growth) to -0.14 (employment). We provide a graphical view of correlations in Figure 2. We display the probability of growth in two consecutive years. Rather than reporting usual scatterplot, we show a figure that provides the number of firms by cells. Each cell reports an interval of growth in t-1 and in t. As the number of firms increases by cell, color used becomes darker. We use as cutoff the percentage of firms (0.1%, 1%, and 10%). We see that the majority of firms have low growth in both period t-1 and t, insofar as the distribution is located around zero (in t-1 and t). This feature is in line with firm growth distribution reported by previous papers on European firms (Capasso et al., 2014; Coad et al., 2018). In addition, growth rates in t-1 and in t do not seem closely related in one direction (firms are not located in one of the four corners).
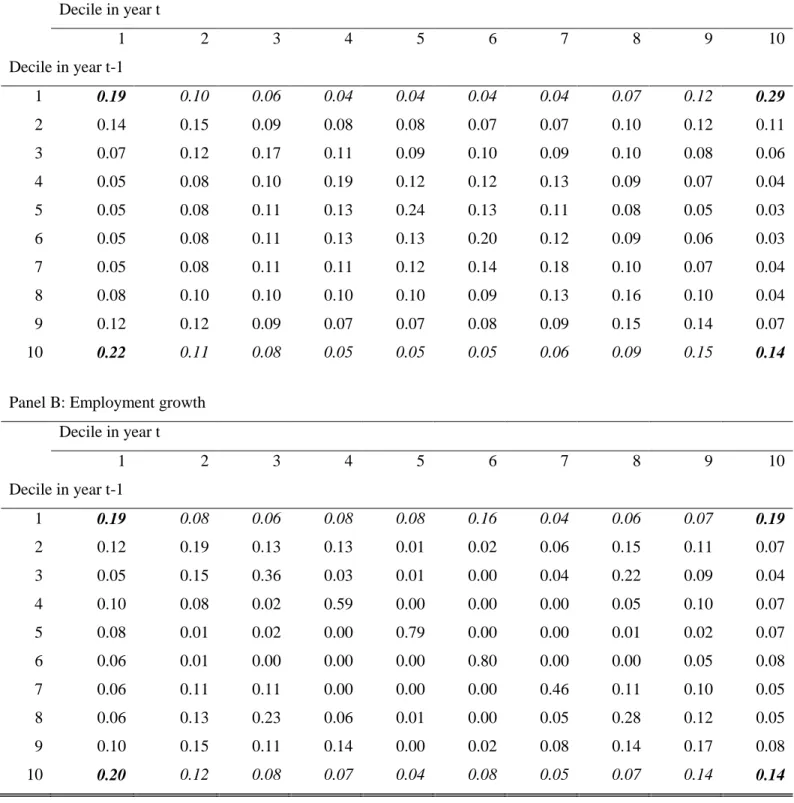
We then compute transition matrix, as previous analysis on European firms (cf. Table 1). We divide firms by decile of growth in t and t-1. The transition probability matrix P is the matrix with pkh as the elements
measuring the probability of moving from decile k to decile h in one period. This probability is relatively high (low) when the corresponding value in the transition matrix is higher (lower) than 0.1. We normalize each cell probability by the raw sum. We report transition matrix for annual observations using sales growth (Panel A) and employment growth (Panel B) in Table 3 for annual growth. The value on the matrix diagonal exceeding 0.10 signals the persistence of growth rate. If we focus on the top decile in the last raw (HGFs), we observe that three types of firms.
(i) Around 15% of HGFs remains in the same category. As a result, there is a non-negligible share of persistent HGFs.
(ii) Between 20% and 30% of firms migrate from top decile to bottom decile, and inversely. (iii) Remaining firms experiencing extreme growth in the past period become “normal” firms (defined as firms between the second and eighth deciles).
This decomposition is robust to the measurement of growth retained (sales or employment) and when we consider three-year growth instead of annual growth (as shown in the Appendix).
Table 3: Transition matrix of growth rate, annual growth
Panel A: Sales growth
Decile in year t 1 2 3 4 5 6 7 8 9 10 Decile in year t-1 1 0.19 0.10 0.06 0.04 0.04 0.04 0.04 0.07 0.12 0.29 2 0.14 0.15 0.09 0.08 0.08 0.07 0.07 0.10 0.12 0.11 3 0.07 0.12 0.17 0.11 0.09 0.10 0.09 0.10 0.08 0.06 4 0.05 0.08 0.10 0.19 0.12 0.12 0.13 0.09 0.07 0.04 5 0.05 0.08 0.11 0.13 0.24 0.13 0.11 0.08 0.05 0.03 6 0.05 0.08 0.11 0.13 0.13 0.20 0.12 0.09 0.06 0.03 7 0.05 0.08 0.11 0.11 0.12 0.14 0.18 0.10 0.07 0.04 8 0.08 0.10 0.10 0.10 0.10 0.09 0.13 0.16 0.10 0.04 9 0.12 0.12 0.09 0.07 0.07 0.08 0.09 0.15 0.14 0.07 10 0.22 0.11 0.08 0.05 0.05 0.05 0.06 0.09 0.15 0.14
Panel B: Employment growth
Decile in year t 1 2 3 4 5 6 7 8 9 10 Decile in year t-1 1 0.19 0.08 0.06 0.08 0.08 0.16 0.04 0.06 0.07 0.19 2 0.12 0.19 0.13 0.13 0.01 0.02 0.06 0.15 0.11 0.07 3 0.05 0.15 0.36 0.03 0.01 0.00 0.04 0.22 0.09 0.04 4 0.10 0.08 0.02 0.59 0.00 0.00 0.00 0.05 0.10 0.07 5 0.08 0.01 0.02 0.00 0.79 0.00 0.00 0.01 0.02 0.07 6 0.06 0.01 0.00 0.00 0.00 0.80 0.00 0.00 0.05 0.08 7 0.06 0.11 0.11 0.00 0.00 0.00 0.46 0.11 0.10 0.05 8 0.06 0.13 0.23 0.06 0.01 0.00 0.05 0.28 0.12 0.05 9 0.10 0.15 0.11 0.14 0.00 0.02 0.08 0.14 0.17 0.08 10 0.20 0.12 0.08 0.07 0.04 0.08 0.05 0.07 0.14 0.14
Ferdi WP n°258 / Léon F. >> The elusive quest for high-growth firms in Africa
To sum up, the distribution of firm growth in Senegal is in line with those observed in developed economies. In other words, the density of growth rates exhibits a “tent-shaped” form, suggesting that most firms do not grow at all and the tails of distribution (extreme deviation) account for the overwhelming part of the dynamics. We also see that growth sales exhibit higher level of growth rate than employment rate. However, both measurement of growth rate are weakly correlated. Differences across firm poorly explained differences in growth rate (less than 15%). The growth process is irregular and growth weakly persist over time (reverse of the fortune). We scrutinize in more details the last aspect in the following.
6.2. Baseline results
Figure 3 provides a summary representation of the quantile estimates of baseline model without interaction (Eq. 1) using annual observations. We display the associated table in the Appendix (Table A1). Our findings, in line with previous studies on European countries (cf. Table 1), can be summarized as follows:
(i) Growth rates of firm size are negatively auto-correlated;
(ii) The negative autocorrelation is stronger for sales growth than employment growth; (iii) The negative autocorrelation is stronger at the tails of the distribution (high-growth firms and fast-declining firms).
Econometric results are largely unchanged when we consider three-year periods as documented in Table A3 and Figure A1 in the Appendix.
Figure 3: Regression quantiles for sales (Panel A) and employment (Panel B) autocorrelation coefficients
Panel A: Sales growth
Ferdi WP n°258 / Léon F. >> The elusive quest for high-growth firms in Africa
We then scrutinize whether firm’s characteristics shape the negative autocorrelation. In line with previous papers, we consider usual firm’s characteristics. We also add interactions between lagged growth and size, age, location and foreign ownership (Eq. 2). Table 4 displays the results of three different quantile: 10% (fast-declining firms), 50% (median firms) and 90% (high-growth firms).11
Table 4: Quantile regression estimation including interactions with usual firm’s characteristics
Sales growth Employment growth
QR10 QR50 QR90 QR10 QR50 QR90
(1) (2) (3) (4) (5) (6)
Lagged growth -0.134** -0.248*** -0.871*** 0.132 2.98e-08 -0.454***
(-2.53) (-8.50) (-12.01) (0.47) (0.35) (-3.39)
Lag. growth*Size 0.00638* 0.0249*** 0.0783*** -0.0867*** -2.13e-08 0.149***
(1.92) (9.15) (13.94) (-5.59) (-0.75) (5.67)
Lag. growth*Age 0.00118 -0.00429*** -0.0101*** -0.00110 -1.21e-09 -0.00845***
(1.32) (-11.23) (-10.25) (-0.63) (-0.47) (-3.18)
Lag. growth*Foreign 0.00668 0.000447 -0.0513* 0.00331 -1.63e-08 -0.0691
(0.18) (0.05) (-1.93) (0.08) (-0.32) (-1.59)
Lag. growth*Dakar -0.0469 -0.0499*** -0.0591** 0.0211 1.01e-08 0.0614
(-1.31) (-7.77) (-2.09) (0.07) (0.12) (0.52) Size 0.0115*** -0.00422*** -0.0638*** -0.0514*** -1.51e-08*** -0.0285*** (3.06) (-5.49) (-31.29) (-9.09) (-2.80) (-6.16) Age 0.00328*** -0.00114*** -0.00340*** 0.000709 -3.78e-10 -0.00286*** (7.04) (-10.78) (-9.71) (1.42) (-1.15) (-5.86) Foreign-owned -0.000327 -0.000178 0.0393*** -0.0148 1.83e-09 0.00726 (-0.02) (-0.05) (3.54) (-0.91) (0.20) (0.52) Dakar -0.0662*** -0.00265 0.0604*** -0.0396 1.48e-10 -0.0208 (-3.49) (-0.73) (5.23) (-1.15) (0.01) (-0.53)
Time-dummy Yes Yes Yes Yes Yes Yes
Sector-dummy Yes Yes Yes Yes Yes Yes
Obs. 21906 21906 21906 6994 6994 6994
Firms 4969 4969 4969 1642 1642 1642
Quantile regressions are run and we refer to first decile (QR10), median (QR50) or top decile (QR90). Size is the logarithm of sales when we consider sales growth (columns 1 to 3) and logarithm of workers for employment growth (columns 4 to 6). *, **, *** refers to statistical significance at 10%, 5%, and 1%, respectively.
11 Results are unchanged when interactions enter one by one (available upon request). Findings from three-year periods are displayed in Table A4 in the Appendix. We confirm our main findings for size and age. Results are less robust for foreign-dummy.
For size and age, we confirm findings from European firms. The literature on growth rate autocorrelation indicates that autocorrelation in general is negative for small firms, while large firms show positive or no persistence in growth rate (Coad, 2007; Coad and Höltz, 2009; Capasso et al., 2014). Our data reveals that small fast-growing firms are unable to sustain their growth than large fast-growing firms are. For age, our estimates are similar to those reported for Sweden firms by Coad et al. (2018). The negative correlation of firm growth is stronger for older firms. However, even new firms experience a negative correlation, while Coad et al. (2018) report a positive correlation for new firms in Sweden.
We also provide interactions between lagged growth and dummy variable for foreign firms and firms located in Dakar. We document that foreign owned firms that experienced a rapid growth in t-1 are less able than local firms to grow in period t. Results for firms in Dakar is not consistent on different specifications.
To sum up, our findings indicate that young and large fast-growing firms are more able to sustain their growth, in line with existing works on European firms.
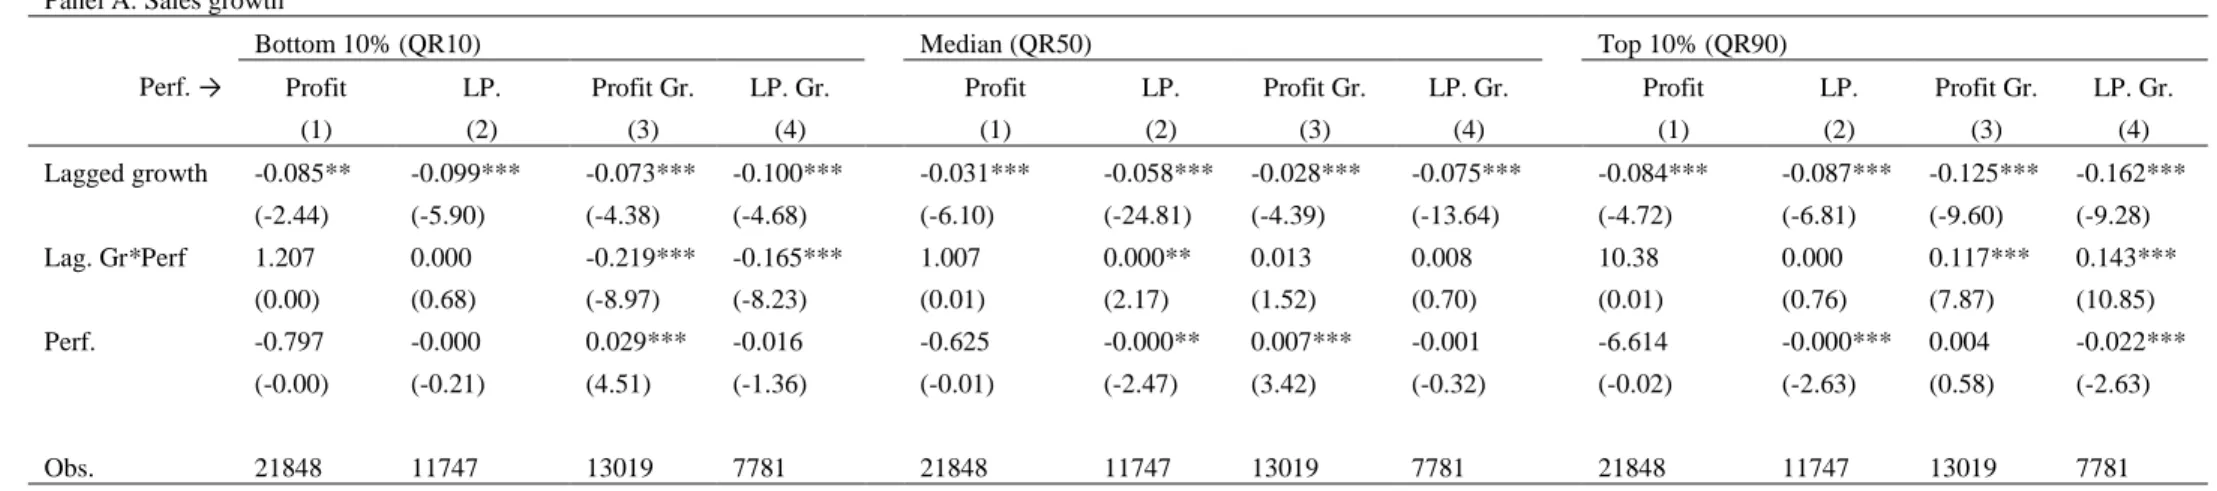
We then consider the impact of profitability and productivity to mitigate the negative autocorrelation of growth rate. In doing so, we run Eq. (3) that considers an interaction between lagged growth and different measures of profitability and productivity. As previously, we report the results for both measures of growth (sales and employment) and for three specifications (bottom decile, median and top decile). Table 5 displays econometric results for annual growth. In Panel A, we display results for sales growth and those for employment growth in Panel B.
We first consider the level of profitability (assessed by the return-on-assets) in the column (1) and the level of labor productivity in column (2). We find that interactions between ROA and lagged sales growth is always positive but never statistically significant, irrespective of quantile considered (Panel A). For employment growth, the interaction is always never statistically significant and coefficient of the interaction turns to positive for bottom decile to negative for median and top decile. As displayed in the Appendix, considering three-year periods are not more conclusive. In column (2), we consider the level of productivity in the first period and we provide a similar finding. The most productive firms are unable to sustain their rapid growth. As shown in the Appendix (Table A5) our findings are unaltered when we consider three-year periods instead of annual observations. To sum up, neither profitability nor productivity seem to discriminate between persistent high-growth firms and other firms.
Ferdi WP n°258 / Léon F. >> The elusive quest for high-growth firms in Africa
Table 5: Quantile regression estimations with interactions between lagged growth rate and performance indicators
Panel A: Sales growth
Bottom 10% (QR10) Median (QR50) Top 10% (QR90)
Perf. → Profit LP. Profit Gr. LP. Gr. Profit LP. Profit Gr. LP. Gr. Profit LP. Profit Gr. LP. Gr.
(1) (2) (3) (4) (1) (2) (3) (4) (1) (2) (3) (4) Lagged growth -0.085** -0.099*** -0.073*** -0.100*** -0.031*** -0.058*** -0.028*** -0.075*** -0.084*** -0.087*** -0.125*** -0.162*** (-2.44) (-5.90) (-4.38) (-4.68) (-6.10) (-24.81) (-4.39) (-13.64) (-4.72) (-6.81) (-9.60) (-9.28) Lag. Gr*Perf 1.207 0.000 -0.219*** -0.165*** 1.007 0.000** 0.013 0.008 10.38 0.000 0.117*** 0.143*** (0.00) (0.68) (-8.97) (-8.23) (0.01) (2.17) (1.52) (0.70) (0.01) (0.76) (7.87) (10.85) Perf. -0.797 -0.000 0.029*** -0.016 -0.625 -0.000** 0.007*** -0.001 -6.614 -0.000*** 0.004 -0.022*** (-0.00) (-0.21) (4.51) (-1.36) (-0.01) (-2.47) (3.42) (-0.32) (-0.02) (-2.63) (0.58) (-2.63) Obs. 21848 11747 13019 7781 21848 11747 13019 7781 21848 11747 13019 7781
Panel B: Employment growth
Bottom 10% (QR10) Median (QR50) Top 10% (QR90)
Perf. → Profit LP. Profit Gr. LP. Gr. Profit LP. Profit Gr. LP. Gr. Profit LP. Profit Gr. LP. Gr.
(1) (2) (3) (4) (1) (2) (3) (4) (1) (2) (3) (4) Lagged growth -0.048** -0.039 -0.039* -0.140*** -0.000 -0.006* -0.000 -0.000 -0.097** -0.055* -0.162*** -0.171*** (-2.04) (-1.33) (-1.75) (-3.06) (-0.04) (-1.78) (-0.69) (-0.01) (-2.05) (-1.91) (-5.80) (6.82) Lag. Gr*Perf 0.006 -0.001 -0.002 0.115*** -0.000 -0.001** 0.000 -0.000 -0.004 -0.003 -0.020 -0.154*** (0.00) (-1.08) (-0.12) (3.22) (-0.00) (-2.33) (0.01) (-0.00) (-0.00) (1.59) (-1.12) (-10.21) Perf. -0.000 0.000* 0.005 0.285*** -0.000 0.000 0.000 0.000 0.000 0.001*** 0.027*** 0.064*** (-0.00) (1.75) (0.67) (3.06) (0.00) (0.00) (0.46) (0.00) (0.00) (3.39) (3.61) (14.75) Obs. 6974 4303 6989 6229 6974 4303 6989 6229 6974 4303 6989 6229
Quantile regressions are run and we refer to first decile (QR10), median (QR50) or top decile (QR90). Control variables (size, age, location, ownership, sector dummies and year dummies) are included but unreported. Panel A displays results using growth of sales and Panel B those from employment growth. *, **, *** refers to statistical significance at 10%, 5%, and 1%, respectively.
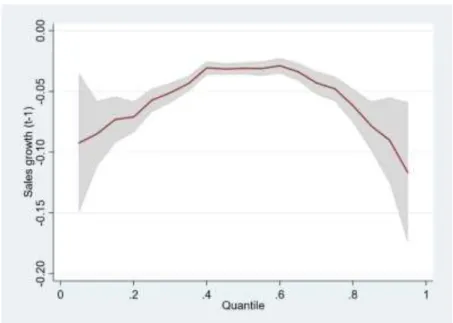
In a second step, we examine whether size growth is accompanied with growth in performance (instead of level of performance). In column (3), we consider the growth of profit and in column (4) the growth of labor productivity. In models explaining growth of sales, we see that growth of performance has a positive effect on both high-growth firms (top decile) and fast-declining firms (bottom decile). Firms experiencing a rapid sales growth accompany with an increase in their profitability or productivity suffer less from a reverse of fortune. Meanwhile, fast-declining firms were more able to change their status from declining to growing firms. Figure 4 shows the marginal effect of lagged growth rate on current growth rate for high-growth firms for different deciles of profit high-growth (blue line) and labor productivity high-growth (grey line). We see that even firms combining a rapid size growth and a rapid growth of profit or labor productivity are unable to sustain their growth in the future period. However, this finding should be treated with caution because it is not robust. Indeed, we cannot provide similar results with employment growth (Panel B) and it is imperfectly confirmed for three-year periods (Table A5 in the Appendix).
Figure 4: Conditional marginal effect of lagged growth rate for different value of profit growth (in blue) and labor productivity growth (in grey
The graph presents marginal effect of lagged growth rate for high-growth firms (top 10%) when sales growth are employed. The blue line refer to the marginal effect of lagged value of sales growth according to the decile of profit growth. The grey line refers to the conditional marginal effect according to labor productivity growth. Dashed lines report confidence intervals at 5%.
Ferdi WP n°258 / Léon F. >> The elusive quest for high-growth firms in Africa
To sum up, the negative correlation between past growth and contemporaneous growth is shaped by firm age, size and ownership but it is largely unaffected by previous performance (both profitability and productivity).
6.3. Robustness checks and extensions
As indicated in the previous section, we run all models by using three-year periods instead of annual observations (Tables A2 to A5). The main conclusions are unaltered as explained above. We run additional sensitivity tests to gauge the robustness of our main findings (unreported but available upon request). First, the literature on growth persistence relies on pooled model and rarely considers the panel dimension of data. Capasso et al. (2014) discuss in detail this choice. Nonetheless, we test whether our finding are robust when we explicitly consider the panel dimension of our data. In doing so, we rely on the quantile model for panel data developed by Powell (2016).12 Our main finding are largely unchanged when we consider panel
structure of data.
Second, one might argue that our findings are sensitive to measure of growth retained. Several papers (e.g., Coad et al, 2018) employ demean annual growth rate. They compute the annual growth rate of the sub-sector and compute growth rate of firm i as the difference between its growth rate in year t and the mean value of the growth rate of firms operating in the same sector in year t. Our econometric results are similar when we employ demeaned growth. In addition, yet importantly, a statistical artefact due to year base used to compute growth might bias our findings. Observing a rapid growth is more likely for firms having a low level of sales or employment in base year. Inversely, firms having a high level of sales or employment are more able to shrink. To control for dependence on base year, we change the measure of firm growth in line with Haltiwanger et al. (2013). Growth is therefore defined as the change of sales (respectively, employment) during t and t-1, divided by the firm’s simple average of sales (resp. employment) during the same period.13 Again, our results are unaffected by this change.
Third, as raised above, we do not account for exit firm in our baseline analysis. We are uncertain whether explicitly considering exit may bias our findings, especially for HGFs. One possible bias could be the moderating impact of age because young firms are more likely to exit (Aga and Francis, 2017). To test whether our findings are unchanged when we consider exit, we propose two alternative specifications. First, as Capasso et al. (2014), we include all observations (and not only firms with at least three year of growth).
12 We employ the qregdp command in Stata developed by Baker et al. (2016). 13 The formula is 𝐺𝑟̃ (𝑦)
𝑖,𝑡=
(𝑦𝑖,𝑡−𝑦𝑖,𝑡−1) 0.5(𝑦𝑖,𝑡+𝑦𝑖,𝑡−1)
Second, we generate a figure of growth for exit firm by fixing the value to -100.14 Both robustness checks
confirm our main findings.
Finally, as explained in Section 2, one channel by which higher profits could allow to sustain growth is through the alleviation of credit constraints. Credit-constrained firms could benefit from higher profits by retaining internal funds or by obtaining external funds at lower costs. We therefore examine whether credit-constrained firms are more able to exploit better profitability to maintain their growth. To compute an indicator of credit-constraint, we rely information reported in the balance sheets. We create a dummy variable equals to one if a firm has a positive value for debt and zero if firm has no debt. Around two thirds of firms are credit-constrained, i.e., having no access to formal debt, according to our definition. We then run Eq. 3 on both sub-samples (constrained firms and unconstrained firms). Econometric results, unreported but available upon request, show no difference between both sub-samples.
7. Conclusion
This paper’s aim is to the persistence of firm growth in Senegal from 2006 to 2015. We exploit a rich administrative dataset covering all formal firms operating in Senegal. We document that Senegalese firms do not strongly differ from their European counterparts on this aspect. The density of growth rates exhibits a “tent-shaped” form, suggesting that most firms do not grow at all and the tails of distribution (extreme deviation) account for the overwhelming part of the dynamics. In addition, we find that growth was not persistent over time, especially for firms at the tails of distribution (high-growth firms and fast-declining firms). A small number of high-growth firms are able to persist in their status (15%). However, transition from top decile to bottom decile (and vice versa) is more likely than the subsistence in the same category. Finally, we investigate factors mitigating the negative autocorrelation of growth rate. In line with existing literature on European countries, we point out the role of demographic variables (age and size). However, we fail to document that firms combining rapid growth and superior profitability/productivity in the first period were more able to sustain their growth. This finding is in line with previous results from Europe (Bianchini et al., 2017) and in China (Moschella et al., 2019).
From a policy perspective, our findings point out that HGFs are often one-hit wonder. Therefore, policies to promote HGFs that are based on their previous growth are subject to caution. In addition, except for age and size, our findings indicate that persistent HGFs do not differ from other firms in their observable characteristics. In particular, it is unclear whether persistent HGFs differ by combining their rapid size growth with other indicators of performance. As a result, trying to select potential gazelles and allocate
14 In theory the value should be minus infinity because log(0) equals minus infinity. The minimum of growth never exceeds -15 for continuing firms so fixing -100 seems a good approximation.
Ferdi WP n°258 / Léon F. >> The elusive quest for high-growth firms in Africa
resources to them may be challenging for policymakers and investors. To design effective policies, it could be instructive to investigate why firm growth does not persist over time, while other are able to sustain their success. Our paper, in line with exiting literature (Daunfeldt et al., 2015; Bianchini et al., 2017; Moschella et al., 2019), points out that observable characteristics are not enough to provide an answer.
This work is mainly descriptive. Rather than a limitation, we believe that continuing to describe firm dynamics in Africa and elsewhere is crucial if we want to design effective policies. McKelvie and Wiklund (2010) argue that the lack of knowledge about firm growth is due to the impatience of researchers. Rather than describing how firms grow in the first step (firm dynamics), they directly tried to explain why firms grow (determinants of firm growth). A promising avenue in this way could be to shed lights on regularities in the growth process (stable vs. unstable growth; interaction between different aspects of growth) distinguishing successful firms and unsuccessful firms. We leave this question for future works.