HAL Id: hal-01583214
https://hal.archives-ouvertes.fr/hal-01583214
Submitted on 7 Sep 2017
HAL is a multi-disciplinary open access
archive for the deposit and dissemination of
sci-entific research documents, whether they are
pub-lished or not. The documents may come from
teaching and research institutions in France or
abroad, or from public or private research centers.
L’archive ouverte pluridisciplinaire HAL, est
destinée au dépôt et à la diffusion de documents
scientifiques de niveau recherche, publiés ou non,
émanant des établissements d’enseignement et de
recherche français ou étrangers, des laboratoires
publics ou privés.
Solid-state NMR H-N-(C)-H and H-N-C-C 3D/4D
correlation experiments for resonance assignment of
large proteins
Hugo Fraga, Charles-Adrien Arnaud, Diego Gauto, Maxime Audin, Vilius
Kurauskas, Pavel Macek, Carsten Krichel, Jia-Ying Guan, Jérôme
Boisbouvier, Remco Sprangers, et al.
To cite this version:
Hugo Fraga, Charles-Adrien Arnaud, Diego Gauto, Maxime Audin, Vilius Kurauskas, et al..
Solid-state NMR H-N-(C)-H and H-N-C-C 3D/4D correlation experiments for resonance assignment of large
proteins. ChemPhysChem, Wiley-VCH Verlag, 2017, �10.1002/cphc.201700572�. �hal-01583214�
See discussions, stats, and author profiles for this publication at: https://www.researchgate.net/publication/319020315
Solid‐state NMR H‐N‐(C)‐H and H‐N‐C‐C
3D/4D correlation experiments for resonance
assignment of large proteins
Article
in
ChemPhysChem · August 2017
DOI: 10.1002/cphc.201700572 CITATIONS0
READS23
12 authors
, including:
Some of the authors of this publication are also working on these related projects:
RoBioMol
View project
Myelocystomatosis oncoprotein (Myc) Basic Helix-Loop-Helix Leucine Zipper
View project
Diego F Gauto
Institut de Biologie Structurale (IBS), Grenobl…
15 PUBLICATIONS90
CITATIONSSEE PROFILE
Pavel Macek
17 PUBLICATIONS93
CITATIONSSEE PROFILE
Cecile Breyton
French National Centre for Scientific Research
61 PUBLICATIONS1,916
CITATIONSSEE PROFILE
Paul Schanda
Institut de Biologie Structurale, Grenoble
79 PUBLICATIONS2,217
CITATIONSSEE PROFILE
All content following this page was uploaded by Paul Schanda on 11 August 2017.
(Author pre-print)
Solid-state NMR H-N-(C)-H and
H-N-C-C 3D/4D correlation
experiments for resonance
assignment of large proteins
Hugo Fraga
[a,b], Charles-Adrien Arnaud
[a], Diego F.
Gauto
[a], Maxime Audin
[c], Vilius Kurauskas
[a],
Pavel Macek
[a], Carsten Krichel
[a], Jia-Ying Guan
[a],
Jerome Boisbouvier
[a], Remco Sprangers
[c,d],
Cécile Breyton
[a]and Paul Schanda*
[a]Abstract: Solid-state NMR can provide insight into protein structure
and dynamics at the atomic level without inherent protein size limitations. However, a major hurdle to studying large proteins by solid-state NMR spectroscopy is related to spectral complexity and resonance overlap, which increase with molecular weight and severely hamper the assignment process. Here we show the use of
two sets of experiments that expand the tool kit of 1H-detected
assignment approaches, and which correlate a given amide pair
either to the two adjacent CO-CA pairs (4D
hCOCANH/hCOCAcoNH), or to the amide 1H of the neighboring
residue (3D HcocaNH/HcacoNH, which can be extended to up to 5D). The experiments are based on efficient coherence transfers between backbone atoms using INEPT transfers between carbons and cross-polarization for heteronuclear transfers. We exemplify the usefulness of these experiments with applications to assemblies of deuterated, fully amide-protonated proteins from ca. 20 to 60 kDa monomer, at MAS frequencies from ca. 40 to 55 kHz. These experiments will also be applicable to protonated proteins at higher MAS frequencies. We report the resonance assignment of a domain within the 50.4 kDa bacteriophage T5 tube protein pb6, and compare these to solution-state NMR assignments of the isolated domain in solution. This comparison reveals contacts of this domain to the core of the polymeric tail tube assembly.
Introduction
Magic-angle spinning (MAS) solid-state NMR (ssNMR) has made rapid progress over the last decade, and has enabled the study of structure, interactions and dynamics of proteins of increasing size and complexity.[1–5] It also opened new avenues
for studying proteins in their native environment, such as cell walls and membranes[6–8]. Resonance assignment remains a
crucial and often time-consuming step to be accomplished before any atomic-resolution information can be obtained from ssNMR data. Resonance overlap is a major challenge for the assignment process, particularly for large proteins due to the large number of resonances. In addition to the overlap problem, the intensity of individual cross-peaks decreases with the size of the protein, because of the lower number of molecules in the fixed volume of the sample rotor. A powerful strategy to increase resolution and sensitivity is based on proton detected experiments applied at high MAS frequencies, with deuterated samples that are re-protonated at amide sites.[9–14] Fast MAS
and deuteration extend the coherence life times (R2’) of 1H, 15N
and 13C nuclei, resulting in two beneficial effects: (i) the
associated narrow line widths increase resolution and intensity, (ii) the coherence transfer between nuclei becomes more efficient, which further increases sensitivity in correlation experiments. Different three-dimensional experiments have been proposed previously to correlate the amide site (1H-15N) to
the 13Cα, 13Cβ and 13CO nuclei of the same residue
(intra-residue Hi-Ni-Ci) and preceding residue (Hi-Ni-Ci-1).[15–17]
Sequential assignment of amides is achieved by matching the
13C
i and 13Ci-1 frequencies of different amide sites. Additionally, it
has been proposed to correlate the 1H-15N frequency pair to the 15N frequency of the neighboring residue.[18,19]
Overlap of the H-N frequencies, i.e., peak overlap in the two-dimensional “root” spectrum, increases the ambiguity of connecting a given H-N pair to the corresponding intra- and inter-residue 13C frequencies, and, therefore, severely
complicates the assignment process, particularly for large (>~20 kDa) proteins. We address this problem here by introducing two complementary approaches for correlating the amide sites with either the 13Cα and 13CO carbon atoms on either side of the
given amide site, resulting in a pair of four-dimensional (Hi-Ni
-Cαi-COi, Hi-Ni-Cαi-1-COi-1) spectra, or to the amide protons of
either of the neighboring residues, resulting in another set of correlation spectra (Hi-Ni- Hi-1, Hi-Ni- Hi+1).
The choice of the transfer elements in sequential correlation experiments needs to ensure highest signal-to-noise ratio. For heteronuclear transfers (H-C, C-N, N-H) ramped cross-polarization transfer is generally found most favorable. For C-C transfers, different schemes have been proposed, using either scalar-coupling based INEPT steps[16,17] or dipolar-based
transfers[20,21]. Under conditions of fast MAS (>50 kHz) and
deuteration, the 13C coherence life times become long (typically
of the order of >10 ms for 13Cα and >25 ms for 13CO[22]). Under
such conditions, INEPT-based transfers generally outcompete the dipolar-based ones. Of central importance to the present study is the realization that the INEPT-based transfer scheme allows the simultaneous labeling of the 13Cα or 13CO resonance
frequency during the transfer delay, a property that dipolar-based transfer schemes do not have. Therefore, the addition of
13C frequency dimensions comes without any additional loss of
sensitivity (except for the √2 loss inherent to quadrature detection in any indirect dimension) because frequency editing
and transfer are achieved during the same delay, which represents a significant advantage over dipolar-transfer based schemes[23]. Constant-time evolution has the additional benefits
that the corresponding time-domain signal does not decay, improving resolution-enhancement through linear prediction, and that the effect of homonuclear J-couplings is removed;[24] the
latter is particularly interesting for 13Cα, which is difficult to
decouple from 13Cβ. Here, we present a suite of sequential
resonance assignment experiments, based on these general
design principles, and explore the usefulness of this approach through measurements on different assemblies of proteins with monomer sizes ranging from 20 to 60 kDa.
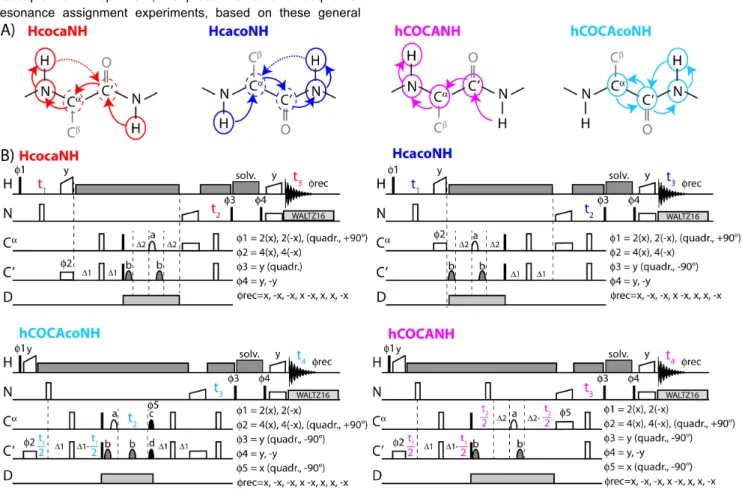
Figure 1. Proton-detected resonance assignment approaches used in this study. (A) Coherence transfer pathways in the four proposed experiments. Encircled
nuclei are frequency-edited; dashed circles denote nuclei which could be edited in a constant-time manner during transfer, extending these experiments to 4D or 5D. Capital letters denote frequency dimensions that were edited in the experiments presented in this study. (B) Corresponding pulse sequences. Narrow filled (open) rectangles denote hard 90° (180°) pulses; the shaped symbols on the 13C channel represent REBURP[25] (denoted with ‘a’), ISNOB2[26] (‘b’), EBURP2[25]
(‘c’) and time-reversed EBURP2 (‘d’) shapes, with band widths of 70 ppm for pulses applied to CO (centered at 175 ppm), and 32 ppm for pulses applied to Cα (centered at 54 ppm). Cross-polarization steps are denoted with open symbols with a linear ramp on one of the channels. The symbol denoted with ‘solv.’ is used for suppression of solvent signals. It is composed of a composite sequence of RF pulses with constant amplitude, a duration of ca. 850 µs per pulse element, applied with variable phases (either randomized or following a WALTZ-16 scheme), and a total duration of typically 60-130 ms. Decoupling of the 2H spins (ca 3
kHz WALTZ16) is optional and requires suitable hardware. 1
H decoupling (10 kHz WALTZ16) used during all indirect chemical-shift evolution periods and INEPT transfers. During acquisition, 3 kHz WALTZ-16 decoupling is applied on 15N. The INEPT transfer delays are typically 4.2-4.7 ms, and are optimized individually for
the periods with transverse magnetization on CO (Δ1) and Cα (Δ2). Note that in the present implementation the maximum evolution time, and thus the digital resolution, is limited by the total INEPT transfer delay (ca. 9 ms); while this evolution time is typically sufficient, semi-constant-time evolution schemes[24] can be
implemented in a straightforward manner, although at a sensitivity cost.
Results and Discussion
Design of 4D and 3D assignment experiments
Figure 1 shows the pulse sequences proposed in this study for generating 3D and 4D correlation spectra. One pair of experiments, HcocaNH and HcacoNH, correlates a given H-N pair to the 13Cα and 13CO nuclei of the same residue (4D
hCOCANH) or the preceding residue (4D hCOCAcoNH). In a second pair of experiments, the amide HN pair is connected to the amide 1H frequency of the preceding (HcacoNH) or
consecutive (HcocaNH) residue. The main aim of this pair of experiments is to provide an additional nucleus – the amide 1H –
to complement and confirm sequential assignments. Inherently, the drawback of using two proton frequencies is that proton line widths are generally larger than heteronuclear line widths, and resolution is, thus, limited. For this reason this pair of spectra is intended primarily to confirm sequential connectivities. Note that it is straightforward to extend these latter pulse sequences to 4D or 5D experiments (two 1H dimensions, one 15N dimension and
one or two 13C dimensions). In these experiments, the 13C
dimensions may be edited in a constant-time manner during the INEPT delays[24], in the manner that is employed in the
hCOCANH and hCOCAcoNH experiments of Figure 1, without additional relaxation losses.
We use in this study a range of different 2H,13C,15N-labeled
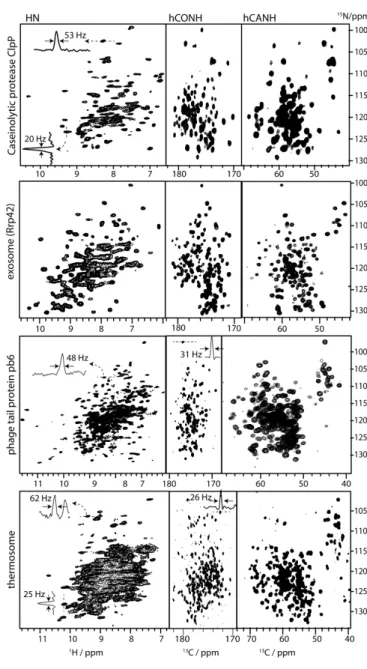
proteins that represent a significant challenge for contemporary ssNMR in terms of their size and thus spectral complexity: (i) the caseinolytic protease assembly ClpP from Thermus thermophilus forms a double-ring structure of a total molecular weight of 300 kDa, composed of 14 identical subunits of 21 kDa each; (ii) the 173 kDa large archaeal exosome core particle consists of three heterodimers (formed by Rrp41 and Rrp42). In the sample used here, the 275-residue large Rrp42 subunit was labeled, in complex with unlabeled Rrp41; (iii) pb6 is the major protein that forms the tail of bacteriophage T5. The sample used in this study consists of long tubular tail-like particles assembled by the ca. 50 kDa-large pb6 monomers; (iv) the thermosome protein from P. horikoshii forms hollow particles formed by 16 subunits of 60 kDa each; we used a sedimented preparation of these particles. These proteins differ considerably in their size, three-dimensional structure, oligomeric state and preparation method, and their spectra and relaxation properties provide to some extent a general view of the properties of such assemblies. The proton-detected 2D HN and 3D hCANH and 3D hCONH spectra of these proteins are displayed in Figure 2, along with several traces across correlation peaks, indicating typical line widths (further discussed via relaxation measurements below). Coherence life times of the 1H, 13C and 15N nuclei are key
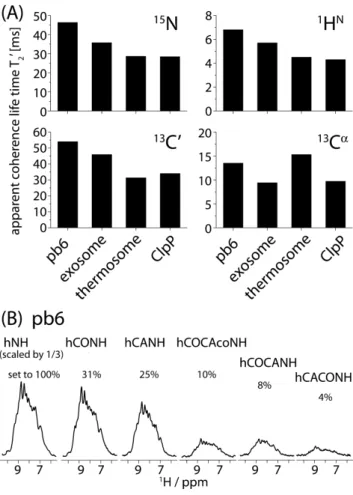
parameters dictating the resolution of correlation spectra, and influencing the efficiency of coherence transfer steps. We measured the apparent coherence life times for these four proteins, using spin-echo relaxation delays (see Supporting Information for details about methods). These experiments were performed as series of one-dimensional experiments, and thus report on the bulk of amide sites in these proteins. The apparent coherence life times, reported in Figure 3A, provide an indication of average life times. Coherence life times of the order of up to 50 ms are found for 15N and 13CO, while amide-1H spins relax
within ca. 5-7 ms, and the apparent decay of 13Cα is of the order
of 9-15 ms (note that the scalar coupling to 13Cβ was not
decoupled in these measurements but deconvoluted, see Supplementary Methods and Figure S2). The coherence life times observed in these various samples of oligomeric complexes are similar to previously reported values on smaller and most often crystalline protein samples.[11,22,27,28] The
calculated line widths L, based on these coherence life times T2’
(L=1/(T2’.π)) are of the order of 50-70 Hz (1HN), and 25-35 Hz
(13Cα), in reasonable agreement with experimentally observed
line widths (cf. Figure 2); for 15N and 13CO the predicted line
widths (6-10 Hz) are about 2-3 fold lower than experimentally observed ones, suggesting the presence of additional line broadening due to sample heterogeneity and/or magnetic-field inhomogeneity. While these calculated and experimentally observed line widths are similar to well-behaving crystalline proteins samples, the sheer number of cross-peaks in these samples of large proteins (from 200 to 500 expected cross-peaks) results in heavy resonance overlap, as reflected in Figure 2, and thus motivate the use of high-dimensional experiments. The 4D strategy largely resolves these ambiguities and facilitates sequential walks, because two frequencies (13Cα, 13CO) are simultaneously matched.
We next investigated the efficiency of the different correlation experiments from Figure 1. One-dimensional traces of the various experiments obtained from the sample of the phage tail tubes (pb6 protein) are shown in Figure 3B. We find that the
most efficient experiments are hCONH and hCANH with approximately 25% of the signal amplitude relative to the most basic HN correlation experiment, mirroring previous reports. For the least efficient experiment reported in this study, hCACONH, the remaining is ca. 4%. These values are comparable to previously reported ones.[16,22,29]
Figure 2. Proton-detected correlation spectra of large protein assemblies at 55
kHz MAS (14.1 T magnetic field strength). The identity of the proteins is written on the left of each panel. For the case of hCONH and hCANH spectra, a projection along the 1
H dimension was generated by superimposing all 15
N-13
C planes over the range of 1
H frequencies over the amide region. Representative 1D traces are reported at positions indicated by dashed lines. Note that in the 13
C dimensions, the line width is primarily limited by sampling of the indirect dimension, not by inherent line widths.
Figure 3. Coherence life times and relative sensitivities of correlation
experiments. (A) Apparent coherence life times, T2’, of 15N, 1HN, 13Cα and 13CO
measured in the four proteins used in this study. For 13
Cα, the apparent decay is heavily influenced by the large (~35 Hz[24]
) scalar coupling to the 13
Cβ, which is difficult to decouple, and the reported value corresponds to the decay of the envelope of the decay which is modulated by the scalar coupling (see Supporting Information Figure S2). (B) Relative signal intensities of the different experiments applied to pb6, as obtained from1D traces. Note that the first spectrum, hNH, has been scaled to one third. The percentages of the signal height of the different spectra are reported above each spectrum.
Application of the approach to the 14-mer ClpP assembly
We applied the two sets of experiments first to the 21 kDa protein ClpP. Figure 3A shows an example of a sequential walk through part of the ClpP sequence. As expected, the 4D spectra are particularly useful in cases where the 3D “sub-spectra” leave several options for connecting the HN frequency pair to the carbon frequency. For example, 2-3 different intra-Cα
frequencies are possible for HN of G109 and inter-Cα
frequencies of E107 (Figure 3A); these ambiguities are resolved in the 4D spectra.
Figure 3B shows example sequential walks using the sequential
1HN-1HN correlation experiments. For many instances we find in
these experiments both the sequential cross-peaks (Hi-Ni-Hi-1,
Hi-Ni-Hi+1, respectively) as well as the diagonal peak (Hi-Ni-Hi).
The former cross-peaks arise from initial cross-polarization from the nearest amide proton to the spatially closest proton (Hi-COi-1
and Hi-Cαi, for HcocaNH and HcacoNH, respectively), while the
diagonal peak stems from Hi-COi and Hi-Cαi-1 CP, respectively.
The corresponding distances are 2-2.1 Å for the nearest H-C
pair, and 2.5-3.1 Å for the next H-C. Accordingly, we find that the diagonal peaks have mostly lower signal intensity than the sequential connectivity peaks.
Figure 4. Assignment spectra of ClpP (14x21 kDa) for selected stretches
along the protein sequence. (A) In the 4D assignment strategy, sequential connectivities between H-N sites are established through two matching frequencies, Cα (shown as vertical axis) and CO (frequency written in the matching panels). (B) Assignment using pairs of sequential H-H connectivities. Crosses denote the position of diagonal peaks in cases where only the sequential cross-peak is observed. Orange (black) arrows point to residue i+1 (i-1).
In order to assess the usefulness of the approach we have performed initial assignments, and achieved ca. 50% of the backbone assignment (Table S1). These assignments are corroborated by 13C-detected 3D experiments. While more
complete assignment is deferred to future publication, these results convinced us that the approaches proposed here are useful and applicable to even larger proteins.
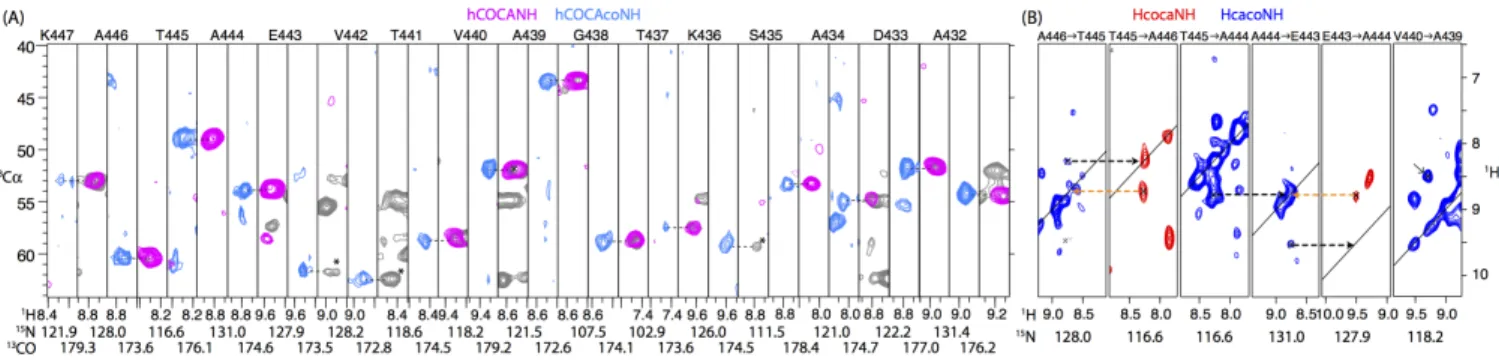
Figure 5. Assignment of the 50.4 kDa phage tail tube protein pb6, assembled to polymeric tubular structures, exemplified with a strip comprising residues K447 to
A432 of this 464-residue protein. (A) Assignment strategy based on 4D hCOCANH (pink) and 4D hCOCAcoNH (light blue) experiments. Also shown is a hCANH spectrum (grey), which is helpful in cases where the cross-peak in the hCOCANH experiment is not detected (three instances shown here, marked with an asterisk). Residue linking is obtained by matching the Cα and CO frequencies. (B) Complementary assignment information, exemplified with 5 residues from the
same stretch of residues shown in panel (A).
Insight into 50.4 kDa bacteriophage T5 tube protein
We next investigated whether this approach could be successful for even much larger proteins, and collected the set of four experiments on the phage tail tube protein composed of the 50.4 kDa pb6 protein. Pb6 is, to our knowledge, larger than any protein that has been assigned so far by ssNMR. De novo assignment of such a large protein is a real challenge and time-consuming. The full assignment is not within the scope of the current report which has a methodological focus. To assess the usefulness of the approach we focused on assignment of a ca. 10 kDa large domain of pb6 within the full-length pb6 assembly, called Ig-like domain (i.e. the spectra were collected with full-length protein, but we only attempted assignment of this domain). This approach is also interesting because the Ig-like domain can be produced in isolation, and studied in solution. The assignment of this domain in solution is reported in Figure S1. We used these solution-state assignments to facilitate assignment of the Ig domain in the context of the full-length 50.4 kDa protein assembled to tubes.
Figure 5A shows an example sequential walk through a 15-residue stretch using the pair of 4D H-N-C-C experiments, and Figure 5B shows sequential amide-to-amide connectivities for selected residues of this stretch of residues. Remarkably, despite the size of this protein, the detection sensitivity and resolution in these experiments allows very straightforward sequential linking using these experiments. During the assignment process, we also used 3D hcaCBcaNH and NCACB experiments, which prove very useful to identify the amino acid type. Using this approach, we could assign the backbone (HN, N,
Cα and CO sites) of the Ig-like domain (i.e., residues 375 to 462
of the full-length pb6 protein) to 92%. Further assignment of the rest of the protein is currently on-going. The assignment of the 10 kDa Ig-like domain already establish that the proposed approach has the capability to provide assignment for proteins that significantly exceed those routinely studied by solid-state NMR.
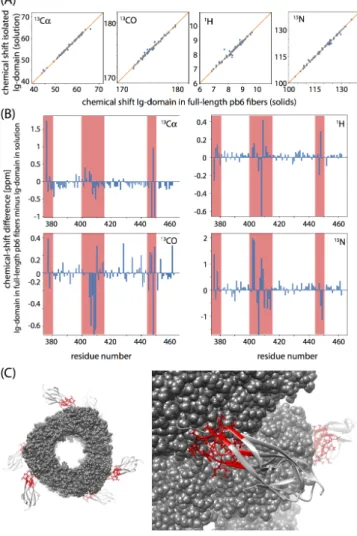
With these chemical-shift assignments at hand, we investigated if and how the conformation of this domain in the tubes formed by the full-length protein differs from the truncated domain in solution. Figure 6 shows the differences in HN, N, Cα and CO
chemical shifts in solution (Ig-like domain alone) and solids (full-length pb6 protein). A first observation is that the chemical shifts are, overall, very similar, establishing that this domain retains its
conformation when part of the assembled tube. The regions with significant differences in chemical shifts are plotted onto a structural model of the pb6 tail tubes[30] in Figure 6. These parts
are located in close proximity to the remainder of the protein, i.e., where the Ig-like domain contacts the core of the tail tube, as one expects from the structural model. We are currently extending the assignments of pb6 to the remaining 374 residues, in order to characterize the structure, interactions and dynamics of these assemblies in detail. The approaches presented herein will be a key element to pursuing these studies.
In summary, we have shown here high-dimensional approaches for backbone assignments of proteins by MAS ssNMR. The approaches exploit the fact that 1H, 13C and 15N line widths are
favorable under the experimental conditions chosen here (deuteration and ca. 40-60 kHz MAS). It is expected that this strategy can be extended in a straightforward manner also to other experimental conditions that result in narrow line widths. In particular, when even faster MAS is used (>100 kHz), deuteration may be abandoned while line widths and transfer efficiencies remain comparable. The inherent drawbacks of deuteration, namely that one needs to re-protonate the amide sites, which may not be possible for some proteins, and that for many proteins the expression levels are lower in D2O-based
media, would be circumvented with such an approach. Experiments as those presented herein will contribute to extend the applicability of MAS ssNMR to proteins of increasing size, complexity and biological interest.
Figure 6. Insight into bacteriophage T5 tail tube protein pb6 by comparison of
solution- and solid-state NMR chemical shifts. Shown are the chemical shifts of the Ig-like domain (residues 375 to 364) studied either in a truncated construct in solution, or in the context of the tubes formed by the full-length pb6 protein (solids). (A) Correlation of chemical shifts in these two states. (B) Residue-wise chemical-shift differences Δδ. Regions with significant Δδ values are highlighted in red, and plotted onto the structural model of the full-length pb6 tubes[30]
in panel (C).
Supporting Information
This manuscript is accompanied by Supporting Information which lists details about the protein constructs, expression and purification of samples used herein. Furthermore, tables with NMR acquisition parameters, pulse sequences used for measuring T2’ values, a comparison of 2D HN spectra of the Ig
domain in isolation and of the full-length pb6 protein, as well as an annotated spectrum of ClpP. The chemical shift assignments of the Ig-domain of pb6 in solution have been deposited in the BioMagResBank under accession numbers
27196 and
27201.
[1] L. B. Andreas, K. Jaudzems, J. Stanek, D. Lalli, A. Bertarello, T. Le Marchand, D. Cala-De Paepe, S. Kotelovica, I. Akopjana, B. Knott, et al., Proc. Natl. Acad. Sci. 2016, 113, 9187–9192. [2] A. Loquet, N. G. Sgourakis, R. Gupta, K. Giller, D. Riedel, C.
Goosmann, C. Griesinger, M. Kolbe, D. Baker, S. Becker, et al.,
Nature 2012, 486, 276–9.
[3] F. Hu, W. Luo, M. Hong, Science 2010, 330, 505–508. [4] M. Tang, A. E. Nesbitt, L. J. Sperling, D. A. Berthold, C. D.
Schwieters, R. B. Gennis, C. M. Rienstra, J. Mol. Biol. 2013,
425, 1670–1682.
[5] H. Van Melckebeke, C. Wasmer, A. Lange, E. Ab, A. Loquet, A. Böckmann, B. H. Meier, J. Am. Chem. Soc. 2010, 132, 13765– 75.
[6] M. Renault, A. Cukkemane, M. Baldus, Angew. Chem. Int. Ed.
Engl. 2010, 49, 8346–8357.
[7] P. Schanda, S. Triboulet, C. Laguri, C. Bougault, I. Ayala, M. Callon, M. Arthur, J.-P. Simorre, J Am Chem Soc 2014, 136, 17852–17860.
[8] T. Jacso, W. T. Franks, H. Rose, U. Fink, J. Broecker, S. Keller, H. Oschkinat, B. Reif, Angew. Chem. Int. Ed. Engl. 2012, 51, 432–435.
[9] B. Reif, J. Magn. Reson. 2012, 216, 1–12.
[10] L. B. Andreas, T. Le Marchand, K. Jaudzems, G. Pintacuda, J.
Magn. Reson. 2015, 253, 36–49.
[11] D. H. Zhou, J. J. Shea, A. J. Nieuwkoop, W. T. Franks, B. J. Wylie, C. Mullen, D. Sandoz, C. M. Rienstra, Angew. Chemie
2007, 119, 8532–8535.
[12] V. Agarwal, S. Penzel, K. Szekely, R. Cadalbert, E. Testori, A. Oss, J. Past, A. Samoson, M. Ernst, A. Böckmann, et al.,
Angew. Chem. Int. Ed. Engl. 2014, 53, 12253–12256.
[13] J. Medeiros-Silva, D. Mance, M. Daniëls, S. Jekhmane, K. Houben, M. Baldus, M. Weingarth, Angew. Chemie Int. Ed.
2016, 55, 13606–13610.
[14] P. Schanda, M. Huber, R. Verel, M. Ernst, B. H. Meier, Angew.
Chem. Int. Ed. Engl. 2009, 48, 9322–9325.
[15] P. Fricke, V. Chevelkov, M. Zinke, K. Giller, S. Becker, A. Lange,
Nat. Protoc. 2017, 12, 764–782.
[16] E. Barbet-Massin, A. J. Pell, J. S. Retel, L. B. Andreas, K. Jaudzems, W. T. Franks, A. J. Nieuwkoop, M. Hiller, V. Higman, P. Guerry, et al., J. Am. Chem. Soc. 2014, 136, 12489–12497. [17] R. Linser, U. Fink, B. Reif, J. Magn. Reson. 2008, 193, 89–93. [18] L. B. Andreas, J. Stanek, T. Le Marchand, A. Bertarello, D. C.-D.
Paepe, D. Lalli, M. Krejčíková, C. Doyen, C. Öster, B. Knott, et al., J. Biomol. NMR 2015, 62, 253–261.
[19] S. Xiang, K. Grohe, P. Rovó, S. K. Vasa, K. Giller, S. Becker, R. Linser, J. Biomol. NMR 2015, 1–9.
[20] C. Shi, H. K. Fasshuber, V. Chevelkov, S. Xiang, B. Habenstein, S. K. Vasa, S. Becker, A. Lange, J. Biomol. NMR 2014, 59, 15– 22.
[21] S. Xiang, J. Biernat, E. Mandelkow, S. Becker, R. Linser, Chem.
Commun. 2016, 0–3.
[22] E. Barbet-Massin, A. J. Pell, K. Jaudzems, W. T. Franks, J. S. Retel, S. Kotelovica, I. Akopjana, K. Tars, L. Emsley, H. Oschkinat, et al., J. Biomol. NMR 2013, 56, 379–386. [23] S. Xiang, V. Chevelkov, S. Becker, A. Lange, J. Biomol. NMR
2014, 60, 85–90.
[24] M. Sattler, J. Schleucher, C. Griesinger, Prog. Nucl. Magn.
Reson. Spectrosc. 1999, 34, 99–158.
[25] H. Geen, R. Freeman, J. Magn. Reson. 1990, 93, 93–141. [26] E. Kupce, J. Boyd, I. D. Campbell, J. Magn. Reson. Ser. B 1995,
106, 300–303.
[27] M. J. Knight, A. L. Webber, A. J. Pell, P. Guerry, E. Barbet-Massin, I. Bertini, I. C. Felli, L. Gonnelli, R. Pierattelli, L. Emsley, et al., Angew Chem Int. Ed. Engl. 2011, 50, 11697–11701. [28] R. Linser, U. Fink, B. Reif, J. Biomol. NMR 2010, 47, 1–6. [29] S. Penzel, A. A. Smith, V. Agarwal, A. Hunkeler, M.-L. Org, A.
Samoson, A. Böckmann, M. Ernst, B. H. Meier, J. Biomol. NMR
2015, 63, 165–186.
[30] C.-A. Arnaud, G. Effantin, C. Vivès, S. Engilberge, M. Bacia, P. Boulanger, E. Girard, G. Schoehn, C. Breyton, submitted 2017.
View publication stats View publication stats